
Abstract
Background:
Jones fracture of the fifth metatarsal is a common overuse injury in soccer players and may cause long-term absence from training. Despite the increasing population of female soccer players, the incidence and risk factors of Jones fracture, including plantar pressure characteristics, among these players have not been clarified.
Purpose:
To investigate the association between Jones fracture and plantar pressure distribution during running and musculoskeletal characteristics in young female soccer players.
Study Design:
Case-control study; Level of evidence, 3.
Methods:
A cohort of female soccer players who played competitively in high school and college teams, aged 15 to 21 years, were followed over a year. All players underwent physical examination at baseline, which included anthropometric measurements, body composition evaluation, joint laxity, double- and single-leg balance measurements, lower limb muscle flexibility, and hip internal rotation angle, foot arch height ratio, and dynamic foot pressure measurements during running. Foot pressure distribution was analyzed by measuring the sum and maximal pressure of 10 areas, and the loading rates of the lateral toes, lateral metatarsal, lateral forefoot, forefoot/rearfoot ratio, and lateral/medial ratio were defined. All these measurements were compared between players who had Jones fracture (Jones group) and players without injuries (control [Con] group).
Results:
A total of 105 players were included, and 4 players (6 feet) were included in the Jones group. Hamstring flexibility was significantly lower in the Jones group than in the Con group. The Jones group presented a higher forefoot/rearfoot ratio of the maximal pressures, lower sum pressure in the lateral heel, higher maximal pressure in the lateral toes, and higher maximal pressure in the first to third metatarsals than the Con group. No significant differences were found between the 2 groups regarding other factors.
Conclusion:
Foot plantar pressure with a higher forefoot/rearfoot ratio, less loading on the heel, and higher pressure on the lateral toes and medial metatarsals during running were associated with Jones fracture in female soccer players. Lower hamstring flexibility was identified as a risk factor for Jones fracture, which has not been reported in male soccer players.
A Jones fracture is a proximal fifth-metatarsal stress fracture that occurs in sports that require cutting and pivoting, such as rugby, basketball, and handball, and has particularly been reported among soccer players.1,7,8,12,19,32,33 It has been reported that the incidence of Jones fracture is 5.6%. 12 However, higher prevalence has been seen among professional Asian male soccer players, with 13.6% of players having a history of Jones fracture. 34
There are 3 types of fifth-metatarsal bone fracture subsequently classified into 3 zones by Dameron 6 : zone 1 is the most proximal zone, including the peroneal tendon insertion and the fifth metatarsocuboid joint; fractures in this zone are often acute tuberosity avulsion fracture. Zone 2 includes the metaphyseal-diaphyseal junction; and zone 3 is just distal to fourth-fifth intermetatarsal ligament and extends distally for approximately 1.5 cm. Jones fracture is widely defined as a fracture in zones 2 and 3.
Unlike other metatarsal stress fractures, which can heal in a relatively short time with nonoperative treatment, 1 Jones fractures have high rates of nonunion, delayed union, and refracture8,44 and often require surgical intervention and prolonged recovery.14,29,39 Therefore, Jones fractures can cause 3 to 5 months of absence from soccer.7,8 Incomplete fracture can be treated nonoperatively by removing the associated risk factors (ie, reducing the load on the affected area) and preventing fracture progression.22,38 Risk factors for Jones fracture are multifactorial, including environmental (eg, artificial turf 24 and type of cleats 30 ) and physical factors. Many studies have investigated physical risk factors of Jones fracture among male soccer players from various aspects of the foot structure,11,15,20,31,42 musculoskeletal factors,12,20,34 and plantar pressure.16,18,24,37 High medial arch,11,31,42 restricted hip internal rotation, 34 and forefoot adduction10,23 have been identified as factors related to Jones fracture in male soccer players.
Soccer has grown popular among female athletes worldwide and, according to the Fédération Internationale de Football Association Women's Football Survey 2014, there were more than 4.8 million registered women soccer players, 9 and the population of female soccer players has been increasing.4,13 Rizzone et al 33 reported that stress fracture rates were higher in female soccer players (7.38/100,000 athlete-exposures) than in male soccer players (4.37/100,000 athlete-exposures) (risk ratio, 1.69; 95% CI, 1.09-2.63). However, evidence regarding the risk factors for Jones fracture in female soccer players is limited. 40 Because it has been reported that musculoskeletal characteristics differ between male and female soccer players (eg, female soccer players have greater laxity and superior single-leg balance compared with male soccer players 36 ), the risk factors of Jones fracture reported in male soccer players may not apply to female soccer players. To the best of our knowledge, no prospective studies have investigated the risk factors of Jones fracture in female soccer players. Although some studies have reported the plantar pressure characteristics in players who had a history of Jones fracture, no prospective studies have investigated the characteristics of dynamic plantar pressure distribution during running in players with Jones fracture. Therefore, this prospective study aimed to investigate the incidence and risk factors of Jones fracture in female soccer players with respect to muscle flexibility and range of motion of lower extremities, foot arch height, and plantar pressure distribution during running.
Methods
Study Design and Participants
This prospective cohort study examined high school and college Japanese female soccer players during the 2018 to 2019 season. A total of 121 female soccer players who played competitively in high school and college teams, with a mean age of 17.0 years (range, 15-21 years), were included. They all trained on artificial turf for the entire season, and they played approximately 50 games in a season. All participants received a preseason medical assessment and a questionnaire regarding injury history, and those who had stress fracture of the lower limbs before the survey were excluded from the analysis. All participants were followed up for a year. According to the classification of fifth-metatarsal bone fracture, 6 Jones fracture was diagnosed by an orthopaedic surgeon by the focal tenderness and the result of radiography demonstrating the fracture in zones 2 and 3. Preseason measurements of players who subsequently developed a Jones fracture were compared with those of players who had none. All measurements were performed at our institution. This study was a part of the Prospective Study of Predictors of Sports Injuries: UTokyo Sports Science Initiative Sports Injury Prevention Project.25,28,36 This study was approved by the institutional review board of our institution, and all participants provided informed consent before study participation.
Measurements
The following measurements were performed during the preseason medical assessment.
Anthropometrics
Height, body weight, and body mass index (BMI) were recorded.
Body Composition
Body composition parameters were measured using the InBody 270 (Biospace Co Ltd), a multifrequency impedance analyzer that can record each player's lean soft tissue mass (skeletal muscle mass), body fat mass, and percentage body fat and mineral content.
Foot Arch Height Ratio
Foot length and navicular bone height were measured in the natural standing position. The foot arch height ratio was calculated by dividing the navicular bone height by the foot length.
Muscle Flexibility
Muscle flexibility tests were performed using a standard goniometer to measure relevant joint angles to assess the iliopsoas, quadriceps femoris, hamstrings, gastrocnemius, and soleus muscles bilaterally using methods described previously.25,36,41 Iliopsoas flexibility was measured by determining the hip joint angle when the participants passively bent their opposite hip joint to the maximum with their hands in the supine position. Quadriceps flexibility was evaluated in degrees as the knee flexion range of movement in the prone position. Hamstring flexibility was evaluated by measuring the angle of knee extension, with the hip kept at 90° of flexion in the supine position. Gastrocnemius flexibility was evaluated by the maximal dorsiflexion angle in the supine position with the knee extended. Soleus flexibility was evaluated by the maximal dorsiflexion angle in the prone position, with the knee kept at 90° of flexion. The reliability was high for all of these measures, with an intraclass correlation coefficient of interrater reliability of 0.86 to 0.99.35,41
Weightbearing Ankle Dorsiflexion Angle
The weightbearing ankle dorsiflexion angle was measured in weightbearing position with the foot placed forward. First, the participant was asked to lean forward on the foot with maximal hip and knee flexion; then the ankle dorsiflexion angle was measured with the patient's heel on the ground.
Passive Hip Internal Rotation Angle
The passive hip internal rotation angle was measured in the prone position (with the hips at 0° extension).
Balance Tests
The Footscan system (1 × 1–m Footscan pressure plate, sampling rate 250 Hz; RSscan International) with 8192 resistive sensors and 5.08 × 7.62–mm pixel resolution was used to measure the plantar pressure in double- and single-leg standing positions. The repeatability and reliability of this instrument have been reported previously.45,46 All measurements were taken barefoot. Participants’ body weight and foot size were recorded. The double- and single-leg standing balance tests for both legs were performed for each 30-s trial with the arms crossed over the chest and eyes opened. The total distance of the center of pressure during the balance tests was measured as the balance parameter, as previously reported. 25
Plantar Pressure Analysis During Running
Plantar pressure was measured while jogging on a flat 10-m course using the Footscan system (Figure 1). Participants jogged on the pressure plate 2 times for measurements, and the mean value of 2 trials was used for the analysis. Participants practiced jogging on the force plate to ensure adequate recordings can be achieved. The foot pressure sensors were calibrated by entering each individual's body weight and foot size before the measurements to compensate for the effect of body weight and foot size. The sum pressure (N/cm2) and peak pressure (N/cm2) were extracted in 10 areas of the foot, which were divided using this system as previously reported 17 : (1) hallux; (2) toes 2 to 5; (3, 4, 5, 6, and 7) metatarsals 1 to 5; (8) midfoot; (9) medial heel; and (10) lateral heel (Figure 2). Then, relative loads of the local areas were calculated by dividing the sum pressure or peak pressure of the local area by that of the total area of the foot as follows: lateral toes (area 2)/total area, lateral forefoot (areas 2, 5, 6, and 7)/total area, and lateral metatarsal (areas 5, 6, and 7)/total area. The ratio of the forefoot (areas 1, 2, 3, 4, 5, 6, and 7)/rearfoot (areas 8, 9, and 10) and lateral (areas 2, 5, 6, 7, and 10)/medial (areas 1, 3, 4, and 9) of the sum and peak plantar pressures were also calculated. The manufacturer-supplied software in Footscan was used for all data measurement and processing.

Plantar pressure measurement while running on a flat 3-m course using the Footscan system.

The 10 areas of the foot divided by the Footscan system.
Statistical Analysis
A statistical power analysis was conducted for sample size estimation. According to previous studies,34,43 the estimated intragroup standard deviation of the plantar peak pressure 43 and that of the hip internal rotation angle 34 was 5 N/cm2, 11°, respectively, and the estimated difference between the Jones group and control (Con) group was >6 N/cm2, 14°, respectively. This study required >4 players with Jones fracture and >114 controls to achieve 80% power and an alpha of .05.
Players who were diagnosed with stress fracture of the lower limbs at baseline were excluded from the analysis, and participants who were diagnosed with Jones fracture during the 1-year follow-up after the preseason medical assessment were assigned to the Jones group. Players who had other stress fractures of the lower limbs were excluded from the analysis, and players who had no stress fracture were assigned to the Con group.
Differences in the preseason measurements between the Jones and Con groups at baseline were compared using the unpaired t test or Mann-Whitney U test depending on whether they were normally distributed (Shapiro-Wilk test) or not. Age, height, body weight, BMI, skeletal muscle mass, body fat mass, percentage body fat, body mineral mass, and soccer experience were compared between the Jones and Con groups. Foot arch height ratio, muscle flexibility, passive hip internal rotation angle, balance parameter during the balance tests, and plantar pressure parameters during running of the injured limb in the Jones group were compared between that of both limbs in the Con group. We excluded from analysis the noninjured foot of the Jones group. Post hoc power analysis was conducted for the variables that demonstrated significant differences. All statistical analyses were conducted using IBM SPSS Statistics for Windows Version 26.0 (IBM Corp) and Version 11.0 (SPSS Japan Inc), and the significance level was set at P < .05.
Results
At baseline, 15 of the 121 players who had a history of stress fracture of the lower limbs were excluded from the analysis, and 106 players were followed up for 1 year from the baseline. One player who sustained a fourth-metatarsal fracture during the follow-up period was excluded. Finally, 105 players were analyzed. The Jones and Con groups included 4 players (6 feet) and 101 players (202 feet) at follow-up assessment, respectively (Figure 3). In the Jones group, 2 players had bilateral Jones fractures, 4 feet of the support leg had Jones fracture, and 2 feet on the kicking leg had injuries.
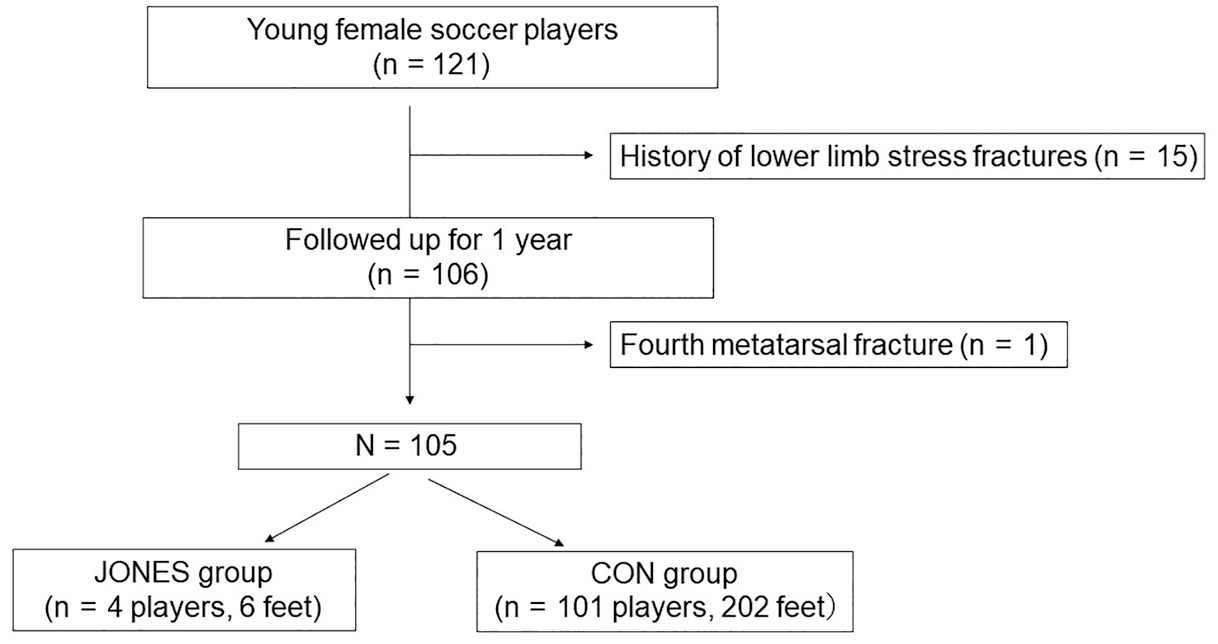
Flow diagram of patient selection process.
No significant differences in age, anthropometric measurements, and soccer experience were found between the Jones and Con groups (Table 1). No significant differences in body composition, general joint laxity test score, and double-leg balance measurement were noted between the 2 groups (Table 2). Lower limb parameters were compared between the injured limb of the Jones group and the uninjured limb of the Con group (Table 3). Hamstring flexibility was significantly lower in the injured limb than in the uninjured limb (P = .02). No significant differences were found in the other lower limb parameters.
Comparison of Age, Anthropometric Measurements, and Soccer Experience Between the Jones and Con Groups a

BMI, body mass index.
The P value was obtained from the unpaired t test.
Comparison of Body Composition, Joint Laxity, and Double-Leg Balance Measurements (COP Distance) Between the Jones and Con Groups a

COP, center of pressure.
The P value was obtained from the unpaired t test.
Comparison of Lower-Limb Muscle Flexibility, Hip Internal Rotation Angle, Foot Arch Height Ratio, and Single-Leg Balance Measurements (COP Distance) Between the Injured Limb of the Jones Group and the Uninjured Limb of the Con Group a

COP, center of pressure.
The P value was obtained by the Mann-Whitney U test.
Statistically significant at P < .05.
The comparisons of the sum plantar pressure distribution and the maximal plantar pressure during running are shown in Tables 4 and 5, respectively. The sum pressure in the lateral heel (area 10) was significantly lower in the injured limb (P = .005) than in the uninjured limb (Table 4). The forefoot/rearfoot ratios of the sum and maximal pressures were significantly higher in the injured limb than in the uninjured limb (P = .03 and .02) (Tables 4 and 5). The maximal pressure in toes 2 to 5 (area 2), first metatarsal (area 3), second metatarsal (area 4), and third metatarsal (area 5) were significantly higher in the injured limb than in the uninjured limb (P = .004, .03, .02, and .01). The lateral toes/total area ratio of maximal pressure was significantly higher in the injured limb (P = .009) (Table 5). Among the variables that showed a statistically significant difference, sample size of the hamstrings flexibility, sum pressure in the lateral heel, forefoot/rearfoot ratio of the maximal pressure, maximal pressure in toes 2 to 5 (area 2), first metatarsal (area 3), second metatarsal (area 4), and third metatarsal (area 5) were calculated to have >80% power to test the hypothesis (Table 6).
Comparison of the Sum of the Plantar Pressure During Running Between the Injured Limb of the Jones Group and the Uninjured Limb of the Con Group

The P value was obtained by the Mann-Whitney U test.
Statistically significant at P < .05.
Comparison of the Maximal Plantar Pressure During Running Between the Injured Limb of the Jones Group and the Uninjured Limb of the Con Group

The P value was obtained by the Mann-Whitney U test.
Statistically significant at P < .05.
Results of Post Hoc Power Analysis of the Variables That Showed Statistically Significant Difference

The time phases of the dynamic plantar pressure distribution, which represents the Jones and Con groups, are described in Figure 4. The loading pressures of the medial and lateral heels reach a maximum at the beginning of the contact phase, and then the pressure of the metatarsal bones and toes reaches its peak, while the foot leaves the ground with its toes. This time phase of the loading pattern was observed in 6 feet of the Jones and Con groups. As shown in Figure 3, the plantar pressure of the forefoot near the toe-off phase was relatively higher than that of the rearfoot near the contact phase in the Jones group, which was consistent with the statistical analysis.

Characteristics of the dynamic plantar pressure of the feet with Jones fracture.
Discussion
To our knowledge, this study is the first to prospectively report the risk factors of Jones fracture in female soccer players regarding musculoskeletal measurements and plantar pressure distribution during running. The results of musculoskeletal measurements showed that hamstring flexibility was significantly lower in the injured limb than in the uninjured limb. The most important findings of this study were that the plantar pressure characteristics during running in female soccer players who had Jones fracture compared with controls were as follows (Figure 5): (1) higher forefoot/rearfoot ratio of the maximal pressures, (2) lower sum pressure in the lateral heel, (3) higher maximal pressure in the lateral toes, and (4) higher maximal pressure in the first to third metatarsals. No statistically significant differences in other items were found between the groups.
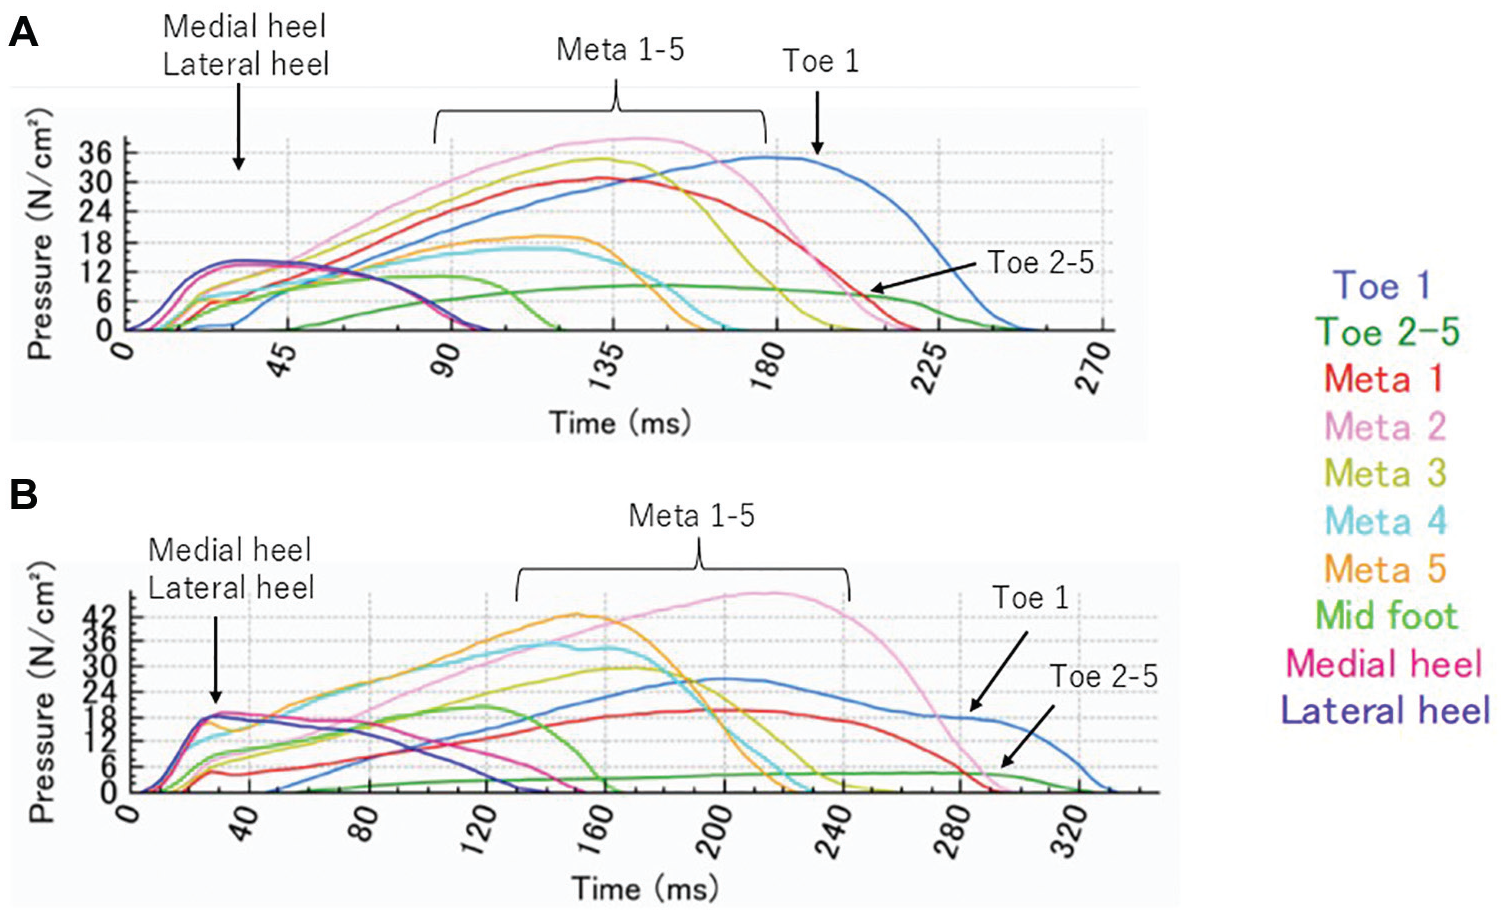
Typical example of the time phase of dynamic plantar pressure distribution during running. (A) Injured foot of the Jones group. (B) Uninjured foot of the Con group. Meta, metatarsal.
In this study, the incidence of Jones fracture in young Japanese female soccer players was 2.8%, which was lower than that reported for male soccer players. In a prospective study, Fujitaka et al 12 reported that the incidence of Jones fracture in Japanese collegiate male soccer players was 5.6%. An epidemiological study reported a higher incidence of stress fracture in female than in male collegiate soccer players, 33 whereas another study found no significant sex difference in stress fracture rates among high school soccer players. 3 Further studies investigating sex differences in the prevalence of Jones fracture among soccer players are required.
In this longitudinal study, the forefoot/rearfoot ratio of the maximal plantar pressure during jogging was significantly higher in players who had Jones fracture than in the players without injury. Our result is supported by Wilzman et al, 43 who found that lower hindfoot (heel) impulse during the shuttle run predicted incident foot stress fracture in female collegiate runners; thus, higher forefoot loading would be indicative of incident stress fracture in feet. Less loading under the heel indicates a greater momentum change by the forefoot during running and possibly causes excessive loading on the forefoot. In addition, feet with Jones fracture had higher maximal pressure in the lateral toes and higher maximal pressure in the first to the third metatarsals compared with the uninjured feet. A cross-sectional study of elite male soccer players 37 also supported our result that players who have returned to sports after sustaining Jones fracture demonstrated significantly higher maximal plantar force at the lateral forefoot and lateral toes (toes 2-5) during kicking and curved running compared with controls. Forefoot adduction 10 and inverted forefoot 23 are risk factors for Jones fracture, and foot alignment reflects kinematics during walking and running.26,27 Therefore, an inverted forefoot position may have caused higher loads at the lateral toe of the feet with Jones fracture. No differences were found in ankle flexibility and foot arch; however, the static inverted or everted alignment of the forefoot was not evaluated in this study. Further studies are needed to consider the influence of static forefoot alignment on dynamic plantar pressure distribution in soccer players.
In this study, no significant difference was found in the sum and maximal pressures at the fifth-metatarsal area. Previous studies16,18 have reported that male athletes with a history of Jones fracture presented significantly excessive loading at the base of the fifth metatarsal while walking and running compared with uninjured matched controls. The result of this study was different from the previous studies, possibly because these previous studies have investigated male athletes, whereas the present study evaluated female soccer players. Furthermore, while previous studies have retrospectively analyzed the plantar pressure of athletes with a history of Jones fracture, the present study prospectively analyzed the plantar pressure of female soccer players with Jones fracture. Meanwhile, Hetsroni et al 15 reported that the plantar pressure of male soccer players with Jones fracture revealed significantly lower peak pressure than controls. Thus, whether the increased loads on the base at the fifth metatarsal cause Jones fracture remains controversial.
Static and dynamic balance measurements were not associated with Jones fracture, and this finding agrees with the results of a previous study on male soccer players. 23 However, lower muscle flexibility of the hamstring was associated with the occurrence of Jones fracture in our cohort, which was not reported in previous studies among male soccer players. Reduced flexibility of the hamstring might reflect the biomechanics during walking and running; for example, decreased unloading on the heel may lead to increased loading on the forefoot during running. However, the association between reduced hamstring flexibility and dynamic plantar loading pattern requires further investigation.
In the present study, no association was found among hip internal rotational angle, foot arch height ratio, and Jones fracture. Many studies have reported musculoskeletal risk factors associated with the onset of Jones fracture. Studies have revealed that a high medial longitudinal arch11,31,42 and range limitation in hip internal rotation 34 are associated with an increased risk of Jones fracture in male soccer players. Restricted hip internal rotation may cause subtalar supination, which increases lateral plantar loading and may lead to Jones fracture in men. 34 Czuppon et al 5 reported that men generally have significantly less range of motion of hip internal rotation than women in a collegiate athlete cohort. Our study participants had a high flexibility of hip internal rotation compared with that reported in male soccer players 34 ; therefore, hip internal rotation angle might have no influence on the occurrence of Jones fracture in this cohort. Musculoskeletal risk factors for Jones fracture may be different between men and women because of the general sex differences in musculoskeletal characteristics. It has been reported that sex-based musculoskeletal differences influence on the differences of sports injury occurrence, such as greater range of motion in internal and external hip rotation in female athletes compared with male athletes can potentiate the risk of noncontact anterior cruciate ligament injuries which incident rates are higher in female athletes. 21
The results of this study unveiled that a significantly higher load on the lateral toes and the first to third metatarsals during running in feet with Jones fracture indicates the possibility of increased stress damage to the fifth metatarsal by a twisting moment. As direction changes while cutting and pivoting mainly cause mechanical stress on the fifth metatarsal and lead to Jones fracture,7,12 the plantar pressure during cutting and pivoting should also be further investigated. However, plantar pressure distribution during running in athletes with Jones fracture may provide additional information to understand the characteristics of athletes with such fractures. Thus, the findings of this study have an important role in indicating the possibility that plantar pressure characteristics during running could predict Jones fracture, and it may also be beneficial for prevention and early intervention, which could prevent complete Jones fracture that requires a long absence from sports activities.
Limitations
First, the number of players with Jones fracture was relatively small. Therefore, multivariate analysis was not performed in this study. Further studies with a larger sample size including a wide range of age groups of female soccer players are required to confirm the present findings. Second, dynamic plantar pressures were measured barefoot while only jogging, whereas the injury usually occurs while wearing shoes, and dynamic pressure measurements during other specific movements as well as sprinting or cutting were not measured. Third, although bone stress injuries in female athletes may be related to relative energy deficiency in sport (RED-S), menstruation cycle, hormone balance, or bone mineral density,1,2 these factors were not evaluated in this study. However, body composition was not different between players with Jones fracture and players without such fractures. Further studies are required to investigate the association between Jones fracture and RED-S.
Conclusion
This prospective study was conducted to examine the dynamic plantar pressure distribution during running and the musculoskeletal characteristics associated with young female soccer players with Jones fracture. The female soccer players with Jones fracture presented significantly higher forefoot/rearfoot ratio of the plantar pressure, with less loading on the heel and higher pressure on the lateral toes and medial metatarsal compared with the uninjured group. In addition, hamstring flexibility was significantly lower in players with Jones fracture, whereas no significant differences in other musculoskeletal factors were found, which were different from the physical risk factors reported in male soccer players.
Footnotes
Acknowledgements
The authors gratefully acknowledge the cooperation of the physicians, physical therapists, and athletic trainers as volunteer staff in our study.
Final revision submitted October 1, 2024; accepted November 11, 2024.
One or more of the authors has declared the following potential conflict of interest or source of funding: Scholarship donations were received from East Japan Railway Company and Shimamura-Syoukai. Grants were received from the Nakatomi Foundation, Japan Sports Medicine Foundation, Japan Sport Council, Japanese Orthopaedic Society for Sports Medicine, Watanabe Memorial Foundation for the Advancement of New Technology, Japan Keirin Autorace foundation, Japan Society for the Promotion of Science (KAKENHI 20K11358), Japan Orthopaedics Traumatology Foundation, and Japanese Orthopaedic Society of Knee, Arthroscopy and Sports Medicine. AOSSM checks author disclosures against the Open Payments Database (OPD). AOSSM has not conducted an independent investigation on the OPD and disclaims any liability or responsibility relating thereto.
Ethical approval for this study was obtained from Graduate School of Medicine and Faculty of Medicine, The University of Tokyo (No. 11907-2).