
Abstract
Background:
The graft tension applied during anterior cruciate ligament (ACL) graft fixation (subsequently referred to as initial graft tension) could potentiate posttraumatic osteoarthritis (PTOA) and influence other outcomes.
Purpose/Hypothesis:
The purpose of this study was to analyze the effects of initial graft tension on imaging and patient-reported outcomes related to PTOA 15 years postreconstruction surgery. Clinical and functional outcomes were also assessed. It was hypothesized that (1) the high-tension group would have improved imaging findings and outcomes compared with the low-tension group at 15-year follow-up and (2) the imaging findings and outcomes for the high-tension group would be equivalent to the sex-, race-, age-, and activity level matched control group.
Study Design:
Randomized controlled trial; Level of evidence, 1.
Methods:
Consented patients underwent ACL reconstruction (ACLR) with bone–patellar tendon–bone or a 4-strand hamstring tendon autograft. A matched uninjured control group was assembled for comparison. Two laxity-based tensioning procedures were randomized: (1) tension set to restore normal anteroposterior (AP) laxity at time of surgery relative to the contralateral uninjured knee (low-tension group) or (2) tension set to overconstrain AP laxity at time of surgery relative to the contralateral knee (high-tension group). Baseline outcome measures, radiographs, and magnetic resonance imaging (MRI) scans were collected prior to surgery and at 15 years postoperatively.
Results:
For medial joint space width, the differences between limbs across the 3 groups were not significant. Within the tension groups, the Whole Organ MRI Score was significantly higher in the surgical knee relative to the contralateral knee in both groups, while the Osteoarthritis Research Society International radiographic scores were higher in the surgical knee in the low-tension group only. A total of 43% of patients in both tension groups met the Knee injury and Osteoarthritis Outcome Score composite criteria for a symptomatic knee compared with controls (10%; P = .01). Most other outcomes, including AP laxity, International Knee Documentation Committee knee examination score, and single-leg hop test were not significantly different between the 3 groups.
Conclusion:
The results do not support the hypotheses that patients in the high-tension group would have better chondroprotection compared with the low-tension group and have equivalent outcomes with the matched controls. Overall, the results show that patients undergoing ACLR are more likely to develop PTOA and display inferior outcomes compared with the uninjured matched control group, regardless of graft tension.
The yearly frequency of anterior cruciate ligament (ACL) rupture in the United States is estimated to be between 30 and 78 individuals per 100,000 people. 26 This value continues to increase due to the growing participation in organized sports from a young age, as well as the development of more advanced diagnostic tools. 33 Many patients opt for surgical reconstruction to restore joint function and prevent knee instability. 25 Nonetheless, ACL reconstruction (ACLR) does not guarantee a return to full capacity, as only 63% of athletes return to their preinjury level of sport, 5 and >50% of patients develop radiographic posttraumatic osteoarthritis (PTOA) 10 to 20 years after injury,34,35 an incidence that is similar to ACL-injured patients that do not undergo surgery. 1 Knee PTOA, resulting in articular cartilage dysfunction and loss, is radiographically characterized by osteophyte formation and joint space narrowing,1,3,25,37,44 likely due to the inflammatory response that the knee sustains upon injury and again during reconstruction surgery, as well as mechanical factors such as altered joint contact mechanics due to the ACL injury and/or concurrent meniscal pathology. 23
There are several mechanical factors thought to promote PTOA, including the initial graft tension applied at surgical fixation. 22 While there is no consensus on the optimal initial graft tension protocol, 6 several recommendations have been made to minimize joint laxity, while refraining from overconstraining the joint. Overtensioning is thought to impair range of motion, damage the articular surfaces, and promote graft failure.30,32,40 To the contrary, a graft that is overtensioned at the time of surgery may stretch out during the healing process and better restore normal joint function with time, providing long-term chondroprotection. 9 With this in mind, the current study sought to examine the development of PTOA between patients undergoing ACLR with high- and low-initial graft tension levels over the long term.
For this study, imaging and patient-reported outcome (PRO) measures at 15-year follow-up were compared between the high and low initial graft tension groups and a matched control group.2,14,21 Clinical and functional outcomes were also assessed. We hypothesized that (1) the high-tension group would have improved imaging findings and outcomes compared with the low-tension group at 15-year follow-up and that (2) the imaging findings and outcomes for the high-tension group would be equivalent to the sex-, race-, age-, and activity level matched control group. The primary outcome to identify patients with radiographic PTOA was a measurement of joint space width of the medial compartment (mJSW). 10 However, secondary imaging outcomes (ie, Osteoarthritis Research Society International [OARSI] radiographic score 3 and the Whole-Organ Magnetic Resonance Imaging Score [WORMS] 43 ) were evaluated to provide a comprehensive joint assessment of PTOA. Furthermore, the composite Knee injury and Osteoarthritis Outcome Score (KOOS) model presented by Englund et al 19 was used to identify patients with a symptomatic knee. Additional clinical,16,29 functional, 12 and PROs19,45,51 were also included to assess general clinical and functional outcomes as detailed below.3,10,43
Methods
Trial Design
This 15-year analysis concluded the long-term follow-up of a prospective randomized controlled trial (ClinicalTrials.gov NCT00434837). The 3-year (89% follow-up), 21 7-year (71% follow-up), 2 and 10- to 12-year (63% follow-up) 14 results have been previously published, while the current manuscript focuses on the data obtained at the 15-year time point (Figure 1). The study was approved by the institutional review board of Rhode Island Hospital, and all participants provided written informed consent.
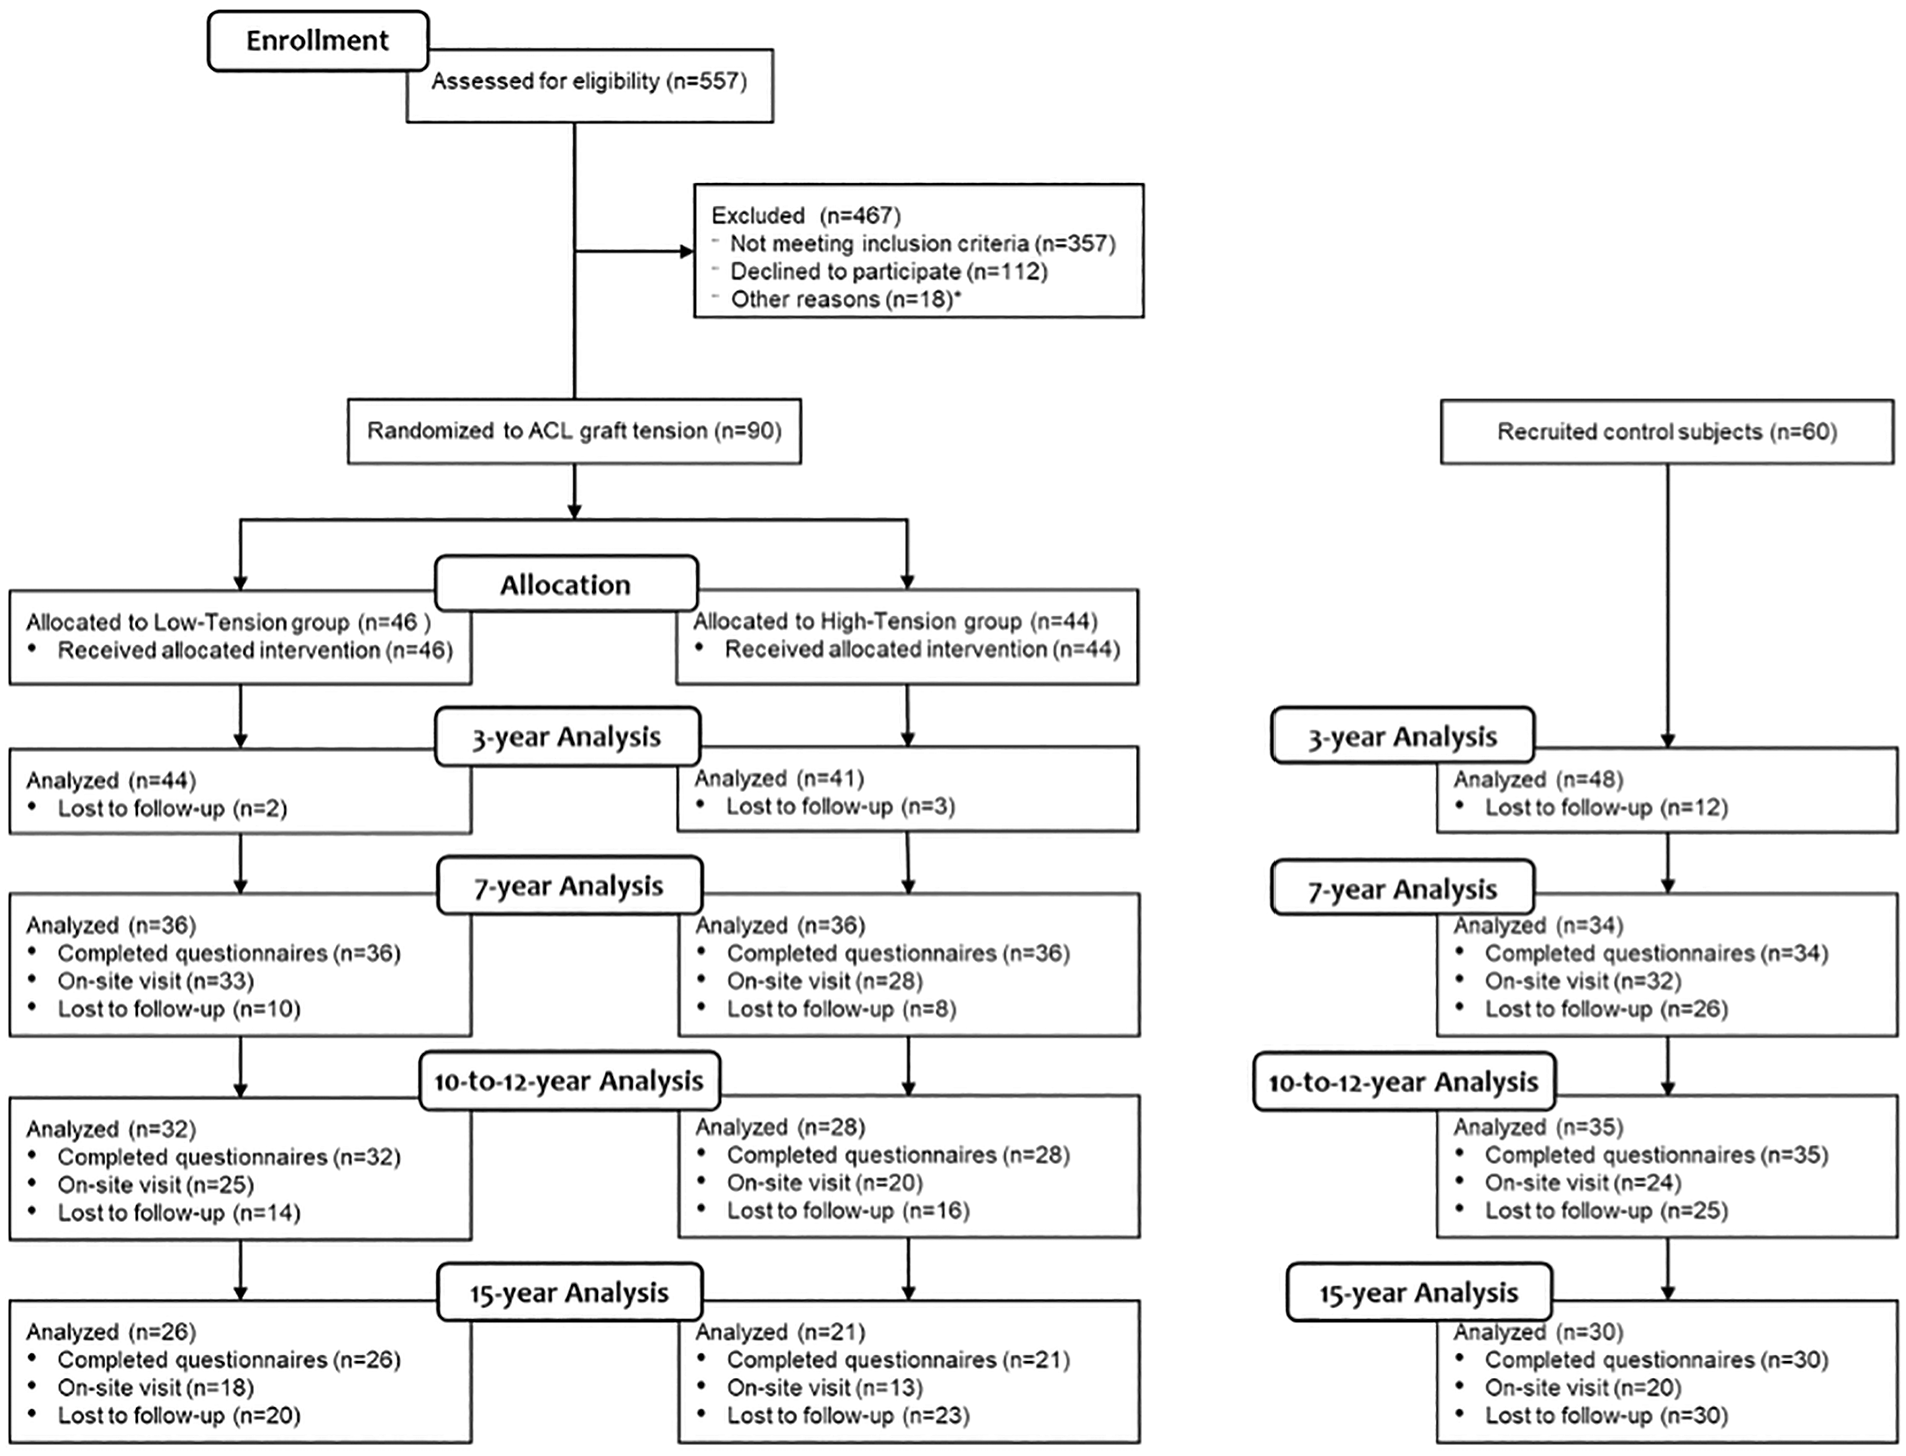
CONSORT (Consolidated Standards of Reporting Trials) diagram depicting the study design, patient allocation, and loss to follow-up through 15 years. ACL, anterior cruciate ligament. *Dropped out after being initially enrolled (1 canceled surgery, 2 opted out of randomization, 2 positive pivot in uninjured knee, 2 partial ACL tears not reconstructed, 1 allograft, 1 quadriceps tendon repair, 4 meniscal tears greater than one-third involvement, and 5 chondral lesions).
Participants and Entry Criteria
Male and female patients between the ages of 15 and 50 undergoing ACLR with either a bone–patellar tendon–bone (BPTB) or a 4-strand semitendinosus-gracilis hamstring tendon (HS) autograft from the practice of 3 surgeons (P.D.F., M.J.H. and R.M.S.) were included. 21 All 3 surgeons performed both procedures. Graft choice was not randomized and was ultimately made by the patient. 21 Patients were excluded if they sought reconstruction >12 months following injury, if they required a partial meniscectomy involving more than one-third of the meniscus, or displayed increased clinical laxity (≥grade 2) of the medial collateral ligament (MCL), lateral collateral ligament (LCL), or posterior cruciate ligament (PCL). A previous knee injury or radiographic evidence of arthritis at the time of enrollment were also exclusion criteria. Patients were prospectively recruited as outlined in Figure 1, and a total of 90 ACL-reconstructed patients were enrolled. 21 Another 60 participants, who were frequency matched to the surgical patients by age, sex, race, and activity level were recruited to serve in the uninjured control group. 21 Potential control participants were excluded if they reported a previous knee injury; had increased clinical laxity of the MCL, LCL, or PCL relative to the control knee; or displayed radiographic evidence of degenerative arthritis. The details regarding the inclusion/exclusion criteria can be found in a previous paper. 21 The “index” knee for the uninjured control group patients was randomly selected at the time of enrollment.
ACLR/Initial Graft Tension Protocols
The ACLR was performed using either a BPTB autograft harvested from the central third of the ipsilateral patellar tendon or an HS autograft as previously described in detail.2,14,21 The transtibial technique was used for femoral tunnel drilling, as was standard at the time of study initiation, and operating procedures were standardized between surgeons. 21 All grafts underwent 20 manual tension cycles to precondition them prior to fixing the distal end of the graft. For BPTB autografts, the bone blocks were secured with metal interference screws. 21 The HS autografts were fixed with cortical fixation on the femur and a biodegradable interference screw on the tibia, which was reinforced at the surgeon's discretion with a screw and spiked soft tissue washer. 21 Initial graft tensioning was performed following a “laxity-based” protocol,4,20,21 in which the level of graft tension was determined by the resulting anteroposterior (AP) laxity value at 20° of knee flexion for the index knee relative to the uninjured contralateral knee at surgery. For the low-tension group, the knee was positioned at 0° flexion and firmly tensioned such that the AP laxity value of the index knee was equal to the contralateral knee. 21 The grafts of the high-tension group were firmly tensioned at 30° of knee flexion to overconstrain the surgical knee by 2 mm compared with the contralateral knee. 21 AP laxity (manual maximum test) of the surgical knee was verified intraoperatively in comparison with that of the contralateral knee at 20° flexion using a sterilizable knee arthrometer (KT-1000S; MEDmetric Corp) by a trained physical therapist. The initial graft tensioning process was repeated if the targeted knee laxity was not reached within 1 mm. All patients followed standard rehabilitation programs postoperatively with the goal of returning to sport at 6 months. 8
Osteoarthritis Imaging Outcomes
At the 15-year follow-up visit, a radiographic series (lateral and weightbearing posteroanterior radiographs) was obtained from both knees of the patients in the 2 tension cohorts and the uninjured control patients who returned for on-site assessment. 21 Sets of magnetic resonance imaging (MRI) sequences were also acquired. The sequences included a sagittal T1-weighted Water Excitation 3D Fast Low Angle Shot, coronal intermediate-weighted turbo spin-echo (TSE), sagittal T2*-weighted Water Excitation 3D Double-Echo Steady-State, and a sagittal intermediate-weighted TSE with fat saturation. The detailed sequence specifications have been previously published. 14
Medial Joint Space Width
mJSW was calculated from the weightbearing radiographs using a semiflexed posteroanterior view with the participant standing on a frame to standardize knee position relative to the x-ray beam. 10 Briefly, the radiographs were manually segmented to outline the articular surfaces of the femur and tibia along with reference points on the medial and lateral epicondyles. The segmentations were done independently by 2 trained research assistants (M.Q.C. and E.N.F.) using commercial image processing software (Mimics; Materialise). A custom program in MATLAB (Mathworks) was then used to calculate the mJSW as the perpendicular distance between the femoral condyle and tibial plateau boundaries at 25% of the total bicondylar width. 18 This location was previously shown to be consistent with the highest reduction in joint space width during osteoarthritis progression. 39 Measured joint space width values were then scaled using the image distances between beads of a calibration standard taped to the fibular head to account for variations in width due to radiographic image parallax. 42
Radiographic Scoring
The modified OARSI radiographic score was used to grade the overall condition of the knee joint. 3 The scale, based on osteophyte formation and joint space narrowing, evaluates joints from 0 (normal) to 4 (severe). Posteroanterior and lateral radiographs of both knees were graded accordingly in each patient. A dichotomous scale was used to analyze sclerosis, attrition, and ligamentous calcification of the knee, and a total score computed. These radiographs were scored by an experienced musculoskeletal radiologist (H.C.G.), who was blinded to the experimental group.
MRI Scoring
The WORMS was used to evaluate PTOA features in the knee. 43 The MRI sequences were used to grade 14 independent features in 15 joint regions. The features included cartilage signal and morphology, subarticular bone marrow abnormalities, subarticular cysts, subarticular bone attrition, and marginal osteophytes. Additionally, the conditions of the menisci and cruciate and collateral ligaments, as well as the presence of loose bodies and periarticular cysts, also contributed to the score. These evaluations were scored by the same experienced musculoskeletal radiologist, who was blinded to the experimental group.
Patient-Reported Outcomes
The primary PROs were assessed by the KOOS. 45 Additionally, the 36-Item Short Form Health Survey (SF-36), 51 Tegner activity scale, 49 and a form to report subsequent knee injuries were used to assess general outcomes.
The KOOS composite model by Englund et al 19 was used to identify participants with a symptomatic knee. This model stipulated that patients with a KOOS-QOL value ≤87.5 and with ≥2 of the other subscales meeting the other model criteria (ie, KOOS Pain ≤86.1, KOOS Symptoms ≤85.7, KOOS Activities of Daily Living [ADL] ≤86.8, and KOOS Sport and Recreation [Sport/Rec] ≤85.0) have poor knee function and pain that may indicate joint arthrosis or are at risk for joint arthrosis.19,52
The additional PROs were acquired to evaluate general outcomes. The SF-36 questionnaire assessed health status in the areas of physical functioning (PF), physical role limitations (RP), bodily pain (BP), vitality (V), social functioning (SF), emotional role (RE), mental health (MH), and general health (GH). The Tegner activity scale graded the patients’ general activity level on a scale of 1 to 10 with 1 representing physical disability due to knee problems and 10 indicating national- or international-level soccer participation. Patients also reported any subsequent knee injuries that required a doctor's visit in another follow-up survey.
Clinical and Functional Outcomes
Clinical examinations were administered by the sports physical therapist (S.L.F.). Patients were evaluated using the 2000 International Knee Documentation Committee (IKDC) examination score, 29 which rated knees as normal (A), nearly normal (B), abnormal (C), or severely abnormal (D) based on knee function, symptoms, and range of motion. The final IKDC examination rating reflected the worst examination score across all categories.
The AP laxity was also measured in both index and contralateral knees using a knee arthrometer (KT-1000; MEDmetric Corp) (S.L.F.). 16 A total of 3 manual maximum tests were administered and the values were averaged. The mean laxity difference between the index and contralateral knees was calculated, compared, and reported.
The single-leg hop test for distance was administered (S.L.F.) to patients 3 times per leg. 12 These trials were averaged, and a mean hop deficit was calculated as the quotient of the mean index limb values and mean contralateral limb values multiplied by 100.
Statistical Analysis
Mixed-model analyses of variance were used to evaluate group differences on continuous outcomes assessed 15 years postsurgery. Pairwise comparisons among the 2 tension groups and controls were performed using the Fisher Protected Least Significant Difference procedure. For outcome measures reported as a difference score between index and contralateral knees (ie, mJSW, OARSI, WORMS, AP laxity) or as a ratio (ie, single-leg hop test), the left or right knee was randomly chosen in control patients to represent the index limb. Comparisons between index and contralateral limbs within each group were performed using a 1-sample test of the mean difference equal to zero based on estimates derived from the mixed model. For the single-leg hop, the 1-sample test's null hypothesis tested whether the index knee was 100% of contralateral. All means presented are least squares means and associated 95% CIs.
Chi-square tests were used to evaluate group differences in the percentage of patients with KOOS composite model scores and the distribution of IKDC examination scores. All analyses were performed by a biostatistician (G.J.B.) using SAS statistical software (SAS Institute). Statistical significance was evaluated based on P < .05.
Given the number of patients lost to follow-up, power calculations were computed post hoc based on the number of patients available for analysis and the observed variance estimates. Power was estimated to be 80% using α = .05 for detecting differences between tension groups with corresponding effect sizes (Cohen d): mJSW difference: 1.2 mm, d = 1.11; KOOS Sport/Rec: 12.7 units, d = 0.84; hop deficit: 22%, d = 1.12; and AP knee laxity difference: 2.3 mm, d = 1.08.
Results
Patient Characteristics
At 15 years postsurgery, 26 low-tension (15 female and 11 male), 21 high-tension (14 female and 7 male), and 30 control patients (13 female and 17 male) participated in the follow-up assessment (Figure 1). Of those patients, 18 low-tension, 13 high-tension, and 20 control patients came in for in-person visits to undergo clinical examination, functional testing, and imaging, with the remaining patients completing the questionnaires via mail. Loss to follow-up was similar between groups: 20 patients from the low-tension group (43.5%), 23 patients from the high-tension group (52.3%), and 30 patients from the control group (50.0%). The participants’ age, weight, days to surgery, sex, ethnicity, and graft type are summarized in Table 1.
Baseline Demographic Information for the Study Participants Included in the 15-Year Follow-up a

BPTB, bone–patellar tendon–bone graft; HS, 4-strand hamstring tendon graft; na, not applicable for control subjects.
Osteoarthritis Imaging Outcomes
No significant differences between the 3 groups were observed in the mJSW difference score (index minus contralateral) at the 15-year time point (P = .22) (Table 2). Additionally, within-group analyses resulted in no significant difference in mJSW between index and contralateral limbs, though a positive difference was observed in the high-tension group indicating a tendency for greater mJSW in the surgical limb (P = .08). Detailed data relating to the mJSW are provided in Supplemental Material Table S1, available separately.
OA Imaging Outcomes Between the Tension Groups and Control Group Overall at 15 Years Postreconstruction a

Data are presented as mean (95% CI). mJSW, medial joint space width; OA, osteoarthritis; OARSI, Osteoarthritis Research Society International; WORMS, Whole-Organ Magnetic Resonance Imaging Score.
Imaging outcome differences for mJSW, OARSI, and WORMS refer to index compared with contralateral leg.
Significant difference (P < .05) between surgical and control knees within group.
There were no significant differences between groups in the mean OARSI difference score (ie, index minus contralateral) (P = .07) (Table 2). Within-group comparisons of surgical versus contralateral knees found that the surgical knee had a significantly greater mean OARSI score than the contralateral knee in the low-tension group (P = .002). However, no significant differences were observed between knees in the high-tension or control groups. WORMS difference scores (index minus contralateral) were also not significantly different between the 3 groups at the 15-year postoperative assessment (P = .05) (Table 2). However, the mean WORMS score in the surgical limb was significantly greater than that observed in the contralateral limb in both low- and high-tension groups resulting in mean differences of ≥10 in each group compared with a near-zero observed mean difference in the control patients in which the index limb was randomly assigned.
Patient-Reported Outcomes
At the 15-year follow-up, there were significant differences between groups for each of the KOOS subscale scores (Table 3). Subsequent pairwise testing indicated no significant differences between the low-tension and high-tension groups. The low-tension group had significantly lower scores from the control group in all subscale scores (KOOS QOL, P = .007; KOOS Sport/Rec, P = .001 (Figure 2A); KOOS Symptoms, P = .01; KOOS ADL, P = .004; KOOS Pain, P = .001), while the high-tension group had significantly lower scores from the control group in 3 of the 5 subscale scores (KOOS QOL, P < .001; KOOS Symptoms, P = .006; KOOS Pain, P = .04).
KOOS Subscales and KOOS Composite Model Results Between the Tension Groups and the Control Group at 15 Years Postreconstruction a

KOOS subscale scores are presented as the mean (95% CI). Values not sharing a common superscript letter are significantly different (Fisher LSD; P < .05). The KOOS composite model results are presented as the number of patients (%) meeting the threshold for a symptomatic knee. Percentages not sharing a common superscript letter (a, b) are significantly different (chi-square test; P < .05). ADL, Activities of Daily Living; KOOS, Knee injury and Osteoarthritis Outcome Score; QOL, Quality of Life; Sport/Rec, Sport and Recreation.
Using the KOOS composite score to identify patients with a symptomatic knee, 19 the percentage of patients meeting this threshold was significantly greater for each of the ACL-reconstructed groups compared with the control group (Table 3). There was no significant difference between the 2 tension groups. Only 22% of the ACLR patients with a symptomatic knee had imaging evidence of PTOA and there was no correlation between them.
There were no significant differences between groups in 7 of the 8 SF-36 categories (PF, P = .17; RP, P = .25; GH, P = .61; BP, P = .15; V, P = .53; SF, P = .82; MH, P = .67) (Supplemental Table S2). However, RE was significantly different between groups (P = .033), with the low-tension group inferior to both the high-tension group (P = .044) and the control group (P = .014). There was no significant difference between the high-tension and the control group (P = .81). Mean Tegner activity scale scores were not significantly different between groups (P = .08) (Supplemental Table S2).
Throughout the 15-year study, 37 of 150 participants (24.7%) reported a total of 50 subsequent knee injuries to either knee (Supplemental Table S3). Twenty of 44 patients (45.5%) in the high-tension group reported 15 surgeries and 10 other injuries that were not surgically treated, 11 out of 46 patients (23.9%) in the low-tension group reported 11 surgeries and 4 injuries not surgically treated, and 6 control patients of 60 (10.0%) reported 5 surgeries and 5 injuries not surgically treated since their baseline examination at enrollment. Of those participants remaining at the 15-year follow-up, 23 out of 77 subjects (29.8%) reported a total of 32 knee injuries. The high-tension group reported 7 surgeries and 8 nonsurgically treated injuries, the low-tension group reported 7 surgeries and 2 nonsurgically treated injuries, and the control group reported 4 surgeries and 4 nonsurgically treated injuries. Between the 12- and 15-year time points, only 2 surgeries and 2 nonsurgically treated injuries were reported: 2 surgeries and 1 injury from the high-tension group, as well as 1 surgery in the control group. Throughout the duration of the study, there were 8 graft failures reported (4 high tension, 4 low tension). Additionally, there were 9 reported contralateral ACL tears (5 high tension, 3 low tension, 1 control group). A full account of the subsequent injuries is provided in Supplemental Table S3.
Clinical and Functional Outcomes
At 15 years postsurgery, the distribution of IKDC examination scores was not significantly different across groups (P = .34). This finding represents a departure from the baseline time point, where patients sustaining ACL injury had significantly inferior scores to the control group (Table 4). Similarly, there were no significant differences in the arthrometer measurements of AP laxity between the 2 tension groups and the matched control (P = .15) (Figure 2B, Supplemental Table S4). However, within the high-tension group, mean AP laxity was significantly greater in the surgical knee than the contralateral knee (mean difference, 1.60 mm; P = .014). However, the mean difference between surgical and contralateral knees in the low-tension group was not significant (mean difference, 0.99 mm; P = .057).
IKDC Examination Outcomes at Baseline and 15-Year Follow-up a
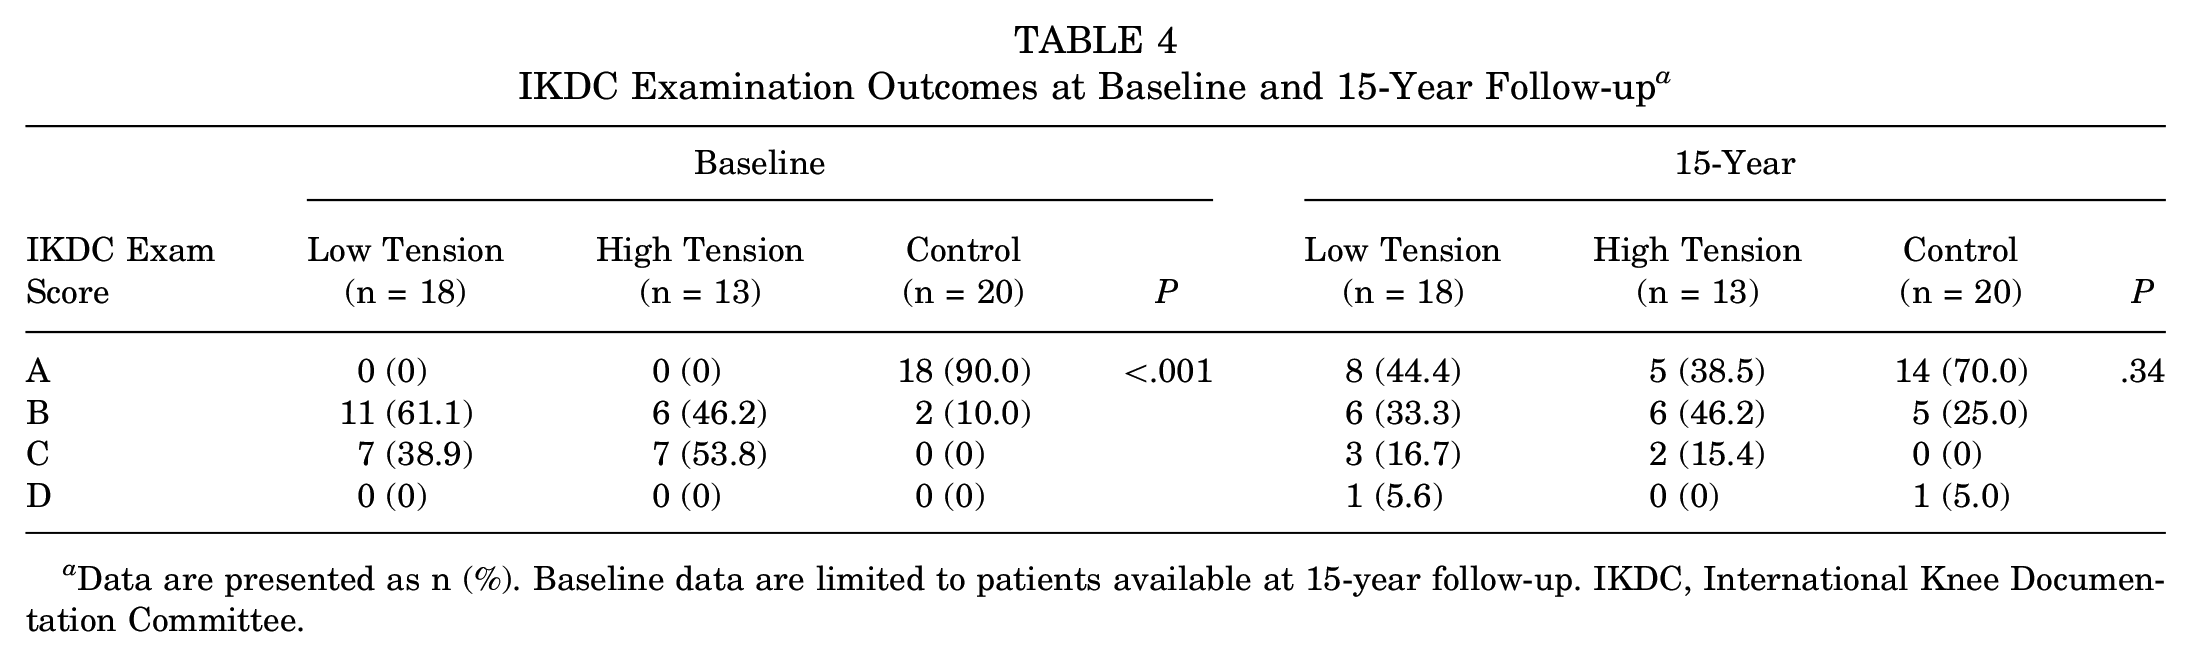
Data are presented as n (%). Baseline data are limited to patients available at 15-year follow-up. IKDC, International Knee Documentation Committee.
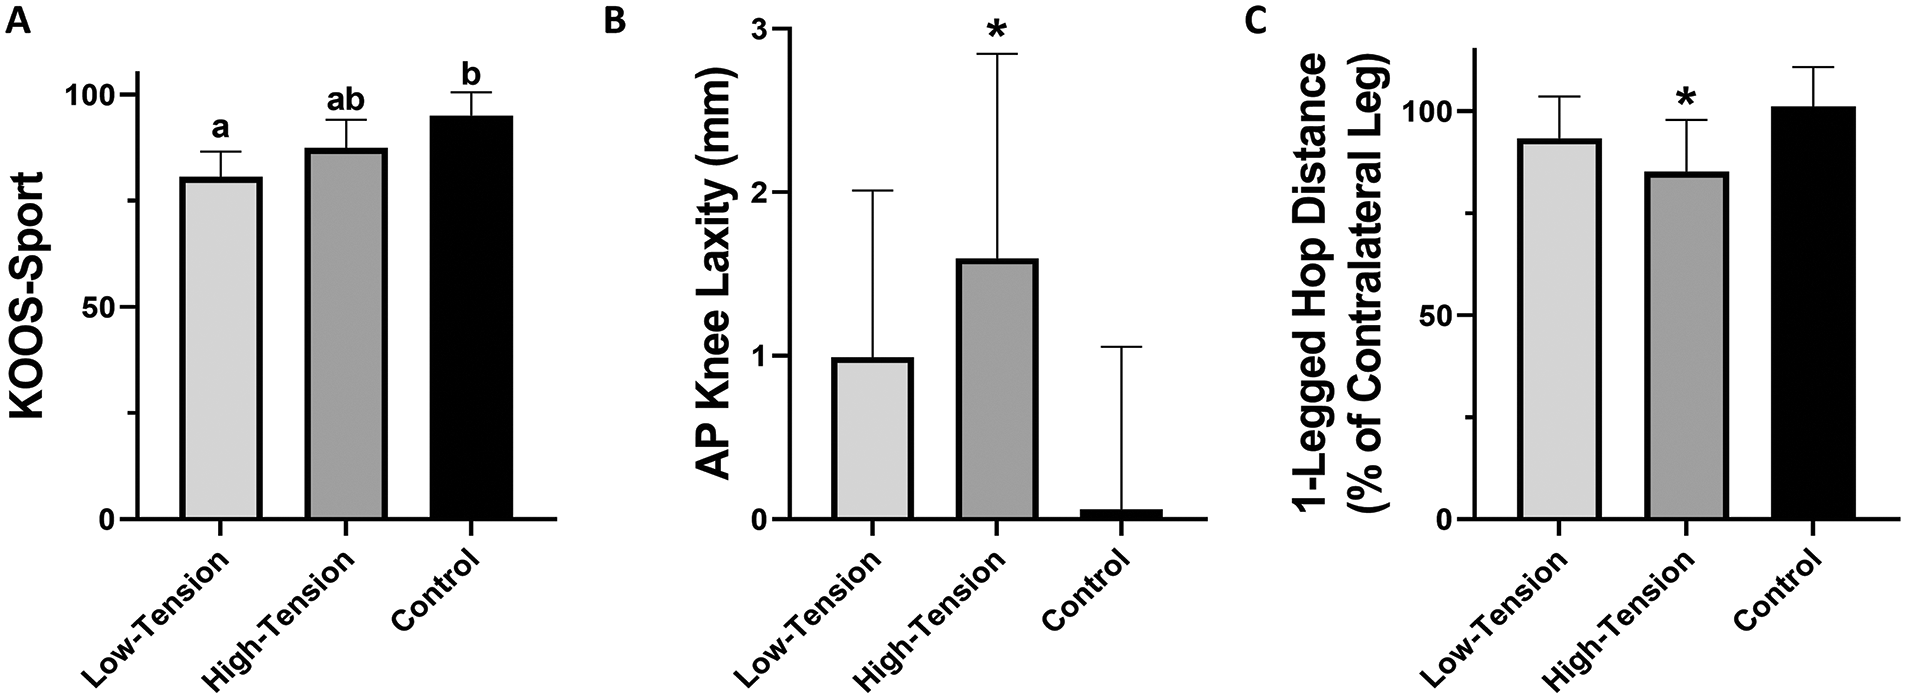
(A) Mean KOOS Sport/Rec at 15-year follow-up. The error bars represent the 95% CI. Means not sharing a common letter above bars are significantly different (P < .05). (B) Mean difference (index-contralateral) for anteroposterior knee laxity at 15-year follow-up. The error bars represent the 95% CI. Asterisk indicates a significant difference (P < .05) between index and contralateral limbs within group. (C) Mean deficit in single-leg hop distance at 15-year follow-up. The error bars represent the 95% CI. Asterisk indicates a significant deficit (P < .05) in index limb relative to contralateral within group. KOOS, Knee injury and Osteoarthritis Outcome Score; Sport/Rec, Sport and Recreation subscale.
There were no significant differences between tension groups and the control group related to the single-leg hop deficit (P = .14) (Figure 2C). Though not significant, a greater deficit was observed in the high-tension group compared with the control group (P = .05) (Supplemental Table S5). Additionally, within the high-tension group, the deficit in the surgical leg was significant when compared with the contralateral leg (P = .023).
Discussion
The most important finding of this trial was that both tension groups presented with imaging evidence of PTOA and a symptomatic knee when compared with the control group at 15-year follow-up. While mJSW between the 3 groups were not significantly different, there were additional data suggesting the 2 tension groups provided imaging evidence of PTOA in the surgical knee that was not present in the control group. The WORMS scores were significantly greater in the surgical knee compared with the contralateral knee in both groups, and both the OARSI and the WORMS scores in the surgical knees were significantly greater than the contralateral knees in the low-tension group. Furthermore, the KOOS composite score demonstrated that the percentage of patients with a symptomatic knee in the 2 tension groups was greater than that in the control group. Thus, it seems reasonable to conclude that there were no differences in PTOA-related outcomes between the 2 tension groups, but that patients undergoing ACLR had higher rates of PTOA than the uninjured control group.
As mentioned above, the difference in mJSW between the index and contralateral legs, the primary outcome measure of this trial (NCT00434837), showed no significant differences between groups. Interestingly, positive difference scores were observed in both tension groups, indicating the possibility of greater articular cartilage thickness in the index knee of the surgical groups. This observation is consistent with the 7-year time point, which was posited to reflect an earlier stage of PTOA progression caused by the breakdown of proteoglycans. 2 It should be noted that mJSW measurements provide an assessment of joint space width only but do not consider osteophyte formation and other imaging hallmarks of PTOA. The WORMS and OARSI scores consider more PTOA features, such as osteophyte formation, sclerosis, and/or cartilage signal changes. Thus, these 2 scores provide a more holistic assessment of PTOA status than mJSW. However, the mean difference between limbs for the OARSI and WORMS scores (P = .07 and P = .05, respectively) were statistically fragile and the scores for the injured knees had significantly worse scores. Unfortunately, loss to follow-up at 15 years may have reduced our power to detect group differences corresponding to relatively large effect sizes for all imaging outcomes.
The KOOS was originally developed to track the progression of osteoarthritis after knee joint injuries. 45 There were no significant differences between the 2 tension groups for any of the KOOS subscale scores. While there are no differences between tension groups, it should be noted that the ADL and Sport/Rec subscale scores showed significant differences between the low-tension and control groups but not between the high-tension and control groups. The 3 other KOOS subscale scores were significantly different for both tension groups when compared with controls. As mentioned above, the low-tension and high-tension groups had a nearly identical proportion of patients with symptomatic knees, as indicated by the KOOS composite model (~43%), which was significantly greater than that of the control group (10.0%) (Table 3). The other PROs, which included the SF-36 and the Tegner score, did not find differences between groups, except for the RE category of the SF-36.
The IKDC knee examination showed 4 patients (22.3%) in the low-tension group, 2 patients (15.4%) in the high-tension group, and 1 patient in the control group (5.0%) with a grade of C or D at the 15-year time point. Patients graded with a C (abnormal) or D (severely abnormal) on the IKDC scale have been classified as having a symptomatic knee. 15 While the IKDC data were not significantly different between experimental groups, they followed those of the KOOS composite model, which may be more sensitive. Other clinical and functional outcomes were less interesting, as the mean AP laxity difference between index and contralateral legs was not significantly different between treatment groups. Likewise, the single-leg hop showed no significant differences across groups. Again, loss to follow-up may have limited our ability to detect these differences.
The results of this paper add to a growing body of research regarding the effect of initial graft tension on various outcomes. Kim et al 30 used 8-, 12-, or 15-kg force on HS grafts at 30° knee flexion and reported no significant differences in clinical outcomes. van Kampen et al 50 similarly found no significant difference in outcomes after using 20 N and 40 N in tensioning at 20° knee flexion with BPTB grafts. 50 Yoshiya et al 56 observed a comparable increase in laxity with BPTB grafts in both 25 N and 50 N tension groups after surgery, which became more similar to the contralateral knee over time. In contrast, Nicholas et al 40 reported significantly better knee stability and decreased laxity in the higher tension group when using 45 N and 90 N to tension BPTB grafts, while Yasuda et al 55 reported decreased knee laxity in the higher tension HS grafts (80 N) than the lower tension (20 N and 40 N) HS grafts at 30° knee flexion. Kirwan et al’s 31 evidence-based review compiled the data from these studies to conclude that neither tension group was particularly compelling. Given that a laxity-based tension approach was used in this study, it is difficult to directly compare the results with the current study. However, the general conclusion that the differences between tension groups have a minimal effect on outcomes is consistent.
Recent analyses have suggested that quantification of initial graft tension may vary between graft types. Taketomi et al 48 suggested that outcomes following ACLR with HS graft were more sensitive to initial graft tension, with 93.8% of HS graft patients receiving a higher graft tension being placed in the “unstable knee” category compared with 21.4% of BPTB graft patients. Alternatively, Chung et al 13 posited that graft tension may be tissue specific, suggesting 20 N to 60 N tensioning for BPTB and 70 N to 80 N for HS and other soft tissue grafts, while Naghibi et al 38 suggested that BPTB and HS grafts require lower tensioning (40 N) than a quadriceps tendon graft (80 N). Given that graft type was not a randomized controlled variable in this study, we are unable to examine the combined effect of graft type and initial graft tension on outcomes, though this may be an avenue for further research.
It is interesting to note that in a retrospective study, Asai et al 7 reported higher ultrashort echo time (UTE-T2) imaging values for HS graft patients tensioned at 40 N at 20° knee flexion compared with the group tensioned with 20 N at full extension at 6-month follow-up. Higher UTE-T2 values are associated with higher free water content and collagen disorganization and may suggest incomplete graft ligamentization. Their findings suggest that graft tensioning may influence graft healing. It is difficult to relate these findings to the current study, as the knee angles, tensions, and follow-up time points are different.
In the earlier analyses of the current study,2,14,21 the primary consensus across time points was that there were no significant differences in outcomes or PTOA development among tension groups, but that the 2 experimental tension groups performed worse than the matched control group. Likewise, the 15-year results presented here continue to demonstrate this difference. To the best of our knowledge, no previous clinical trials have evaluated the relationship between initial graft tension and PTOA.
The results of this study suggest that overtensioning the graft at the time of surgery does not have a detrimental effect on the outcome and PTOA. We found that there was no significant difference in AP laxity between the 2 tension groups at 15-year follow-up. We previously reported that the AP laxity values between the high- and low-tension groups were significantly different immediately after graft fixation and that this difference became nonexistent 1 year postoperatively. 21 These data suggest that the graft under the high-tension condition stretches out over time more than the low-tension condition. The number of symptomatic knees (42%) between tension groups was similar, and the imaging outcomes, and most of the other clinical, functional, and PROs, were also not different between tension groups at 15-year follow-up.
Limitations
A primary limitation of this study is the loss to follow-up from baseline to the 15-year time point, with approximately half of the subjects lost (43.5% low tension, 52.3% high tension, 50.0% control). This loss may have limited the power of the study to detect group differences that correspond to relatively large effect sizes. Nonetheless, the overall rate of retention over the course of 15 years was better than would be expected, with an 89% retention rate at the 3-year, 21 71% at the 7-year, 2 and 63% at the 10- to 12-year 14 follow-ups, respectively. Given the timeline of PTOA progression, conducting the tension study over a 15-year period still offers valuable data regarding patient outcomes, particularly those related to OA, despite a high loss to follow-up.
Evaluating the symptoms related to PTOA is a challenge, given that there are patients with imaging evidence that do not have symptomatic PTOA and that there are patients with symptomatic PTOA that do not have imaging evidence. 19 Thus, we elected to use the KOOS composite model introduced by Englund et al 19 to evaluate knee symptoms. It is possible that the KOOS composite model would also capture knee pathologies not related to PTOA. However, one could postulate that these other pathologies would likely promote PTOA. It should be noted that in the current study, only 22% of the patients with a symptomatic knee had imaging evidence of PTOA. Additionally, an evaluation of patellofemoral arthritis was not conducted, as axial radiographs were not acquired. Patellofemoral arthritis is commonly seen following ACLR. 41
Another limitation was that the radiologist, while blinded to the experimental group, could identify the surgical limbs from the control limbs, which could potentially bias the scoring of radiographic images and MRIs. Nonetheless, it was not possible for the radiologist to discern the initial graft tension of the surgical limbs, nor distinguish the contralateral images of the tension and control groups.
In addition, both ACLR procedures under study utilized a transtibial guide to position the femoral tunnel, as it was common practice at the time the study was initiated. 54 Therefore, these findings may not be relevant to anatomic placement techniques.
Finally, patients were not blinded to graft type, as the graft type was selected by the patient in consultation with his or her doctor. Both BPTB and HS grafts were considered comparably suitable for ACLR at the time of recruitment.24,27,28,36,46,47,53 The more recent literature has identified a higher prevalence of graft failure24,46 and knee instability17,24,27,36,47 in patients receiving HS grafts, though patients with BPTB grafts may experience higher rates of anterior knee pain.24,27,28,36 Additionally, a growing body of evidence shows that the chosen graft type may affect the ideal initial graft tension7,11,13,38,48 and could possibly influence patellofemoral osteoarthritis. 41 Nevertheless, the distribution of graft type in the respective experimental groups is comparable, which should reduce the potential confounding effects of graft type that may influence patient outcomes. Unfortunately, our numbers are too small to analyze the results by graft type.
Conclusion
In conclusion, the study results do not support the hypotheses that patients in the high-tension group would have better chondroprotection compared with the low-tension group and have equivalent outcomes with the matched control. Overall, the data show that patients undergoing ACLR are more likely to develop PTOA and display inferior outcomes compared with the uninjured matched control group, regardless of graft tension.
Supplemental Material
sj-pdf-1-ojs-10.1177_23259671251320972 – Supplemental material for Effect of Initial Graft Tension on Knee Osteoarthritis Outcomes After ACL Reconstruction: A Randomized Controlled Clinical Trial With 15-Year Follow-up
Supplemental material, sj-pdf-1-ojs-10.1177_23259671251320972 for Effect of Initial Graft Tension on Knee Osteoarthritis Outcomes After ACL Reconstruction: A Randomized Controlled Clinical Trial With 15-Year Follow-up by Anika N. Breker, Gary J. Badger, Ata M. Kiapour, Meggin Q. Costa, Emma N. Fleming, Stacy L. Ferrara, Cynthia A. Chrostek, Paul D. Fadale, Michael J. Hulstyn, Robert M. Shalvoy, Holly C. Gil and Braden C. Fleming in Orthopaedic Journal of Sports Medicine
Footnotes
Acknowledgements
The authors would like to thank Dr. Kurt Spindler, MD, for serving as the Data Safety Officer for the duration of this study as well as Madalyn Hague, BS, and Megan Pinette, BS, for their help with data management and implementing of the mJSW postprocessing program developed by Ata M. Kiapour, PhD. They would also like to acknowledge Children's Orthopedic Surgery Foundation and the Harvard Medical School Eleanor and Miles Shore Faculty Development Program. They are grateful to the Musculoskeletal Informatics Group at Boston Children's Hospital for assistance with the image-processing work.
Final revision submitted September 18, 2024; accepted October 9, 2024.
One or more of the authors has declared the following potential conflict of interest or source of funding: The study was supported by grants from the National Institutes of Health (NIAMS R01-AR047910 and NIAMS R01-AR074973) and the Lucy Lippitt Endowment. A.M.K. is a consultant for Miach Orthopaedics and maintains a conflict-of-interest management plan managed by Boston Children's Hospital and Harvard. P.D.F. has received hospitality payments and travel support from Arthrex. M.J.H. has received hospitality payments and travel support from Arthrex. R.M.S. has received consulting fees from Depuy-Synthes Products and Stryker and hospitality support from Arthrex, Kairos, and Stryker. B.C.F. is a co-founder of Miach Orthopaedics, has received royalties from Springer Publishing, and is an associate editor for the American Journal of Sports Medicine; he maintains a conflict-of-interest management plan managed by Rhode Island Hospital. AOSSM checks author disclosures against the Open Payments Database (OPD). AOSSM has not conducted an independent investigation on the OPD and disclaims any liability or responsibility relating thereto.
Ethical approval for this study was obtained from Lifespan (reference No. IRB00000482).
References
Supplementary Material
Please find the following supplemental material available below.
For Open Access articles published under a Creative Commons License, all supplemental material carries the same license as the article it is associated with.
For non-Open Access articles published, all supplemental material carries a non-exclusive license, and permission requests for re-use of supplemental material or any part of supplemental material shall be sent directly to the copyright owner as specified in the copyright notice associated with the article.