
Abstract
Background:
While quadriceps tendon (QT) and patellar tendon (PT) tears are relatively rare in the National Football League (NFL), the impact they can have on a player’s season and career is significant. Despite the importance of extensor tendon injuries within the NFL, there is a lack of recent literature describing their risk factors, incidence, and impact on performance.
Purposes:
To determine the incidence and impact of QT and PT injuries in the NFL between the 2009-2010 and 2022-2023 seasons and to explore the impact that player and injury characteristics have on injury risk, return to play (RTP), and player performance.
Study Design:
Descriptive epidemiology study.
Methods:
Publicly available data were reviewed to capture all PT and QT tears reported in the NFL between the 2009-2010 and 2022-2023 seasons. RTP and performance metrics were recorded for each player during the season before injury and the first 2 seasons postinjury. Data were analyzed to determine statistically significant differences in proportions using chi-square tests, Fisher exact tests, or McNemar tests. Statistical significance was set at P < .05.
Results:
A total of 80 extensor tendon tears (24 QT tears, 56 PT tears) were identified between the 2009-2010 and 2022-2023 NFL seasons. Risk factors for QT injury included body mass index ≥31, age ≥26 years, and >4 years of NFL experience. The risk for QT injury was higher in offensive and defensive linemen compared with skill players. The risk for PT injury was higher for offensive linemen compared with other position groups. Overall, 96.3% of extensor tendon injuries were season ending. The RTP rate for QT injuries was greater (58.3%) than that for PT injuries (55.4%). QT injuries resulted in a greater rate of return to prior performance level and a quicker return to performance compared with PT injuries.
Conclusion:
The rates of QT and PT injury were higher in this study compared with those found in prior NFL studies. This study found similar RTP rates after QT injury but significantly lower RTP rates after PT injury compared with the previous literature. This highlights the significant, devastating, and increasing impact that extensor tendon injuries have on NFL players.
Keywords
Knee injuries are common among National Football League (NFL) players. While quadriceps tendon (QT) and patellar tendon (PT) tears are relatively rare, the impact they can have on a player’s season and career is significant. Previously, the literature has shown that, even with timely surgical repair of QT and PT tears, players often never return to their preinjury performance level. 5 These tendons are particularly important in high-energy athletes, such as professional football players, who use powerful quadriceps muscles to run, jump, and cut. Despite the importance of extensor tendon injuries within the NFL, there is a lack of recent literature describing their risk factors, incidence, and impact on performance.
QT tears are most often due to, in part, degenerative changes to the tendon and are most commonly seen in patients >40 years of age. 5 The location of tendon injury is most often about 1 to 2 cm proximal to the superior pole of the patella, coinciding with the avascular region of the tendon. 2 The most common mechanism of injury to the QT in NFL players involves forceful, eccentric load on the knee’s extensor mechanism. 5 Prodromal symptoms and predisposing factors are usually not present, with the injury usually occurring spontaneously.
Compared with QT injuries, PT injuries are associated with a younger patient population. Injuries of the PT are most commonly seen in men in their 20s and 30s, often due to extreme tensile forces placed on the tendon or as the final result of repetitive microtrauma to the PT.13,18,24 In certain populations, such as those with systemic illness or those who use steroids chronically, tears may be more chronic and caused by less forceful activity. In the NFL, the most common mechanism of PT injury is eccentric overload to the extensor mechanism of the knee. Less than half of the PT tears in the NFL are associated with antecedent symptoms. 4
Surgical treatment is indicated for complete and high-grade partial tears of the PT and QT. Often, nonabsorbable sutures or suture tape is placed along the tendon and secured with bone tunnels or suture anchors to the patella. 7 Acute repair helps restore the extensor mechanism of the knee and allows for early knee mobilization.1,17,19,29-31,34,35 Torn tendons have great healing potential when reapproximated, with early motion and tendon stress leading to increased strength, increased remodeling of collagen, and decreased scar tissue. 16 Most patients eventually return to normal knee function after surgery. Prior research within the NFL, however, has shown that these injuries have the potential to significantly impact a player’s career. At least 1 study has reported that, among all sports, American football players have the worst surgical outcomes with the lowest return to play (RTP) rate and the most significant decrease in performance compared with other professional athletes by sport. 23 These findings suggest that extensor tendon injuries may have a particularly negative impact on RTP and performance in NFL athletes.
Despite the importance of extensor tendon injuries within the NFL, there is a lack of recent literature describing their risk factors, incidence, and impact on performance. The purpose of this study was to determine the incidence and impact of QT and PT tears in the NFL between the 2009-2010 and 2022-2023 seasons. Furthermore, we explored the impact that player characteristics (position, age, body mass index [BMI], etc) and injury characteristics (degree of tear, laterality, etc) have on injury risk, RTP, and player performance.
Methods
Injury Identification and Data Collection
Publicly available data were reviewed to capture all PT and QT tears reported in the NFL between the 2009-2010 and 2022-2023 seasons. The first round of screening involved looking through NFL injury reports on Pro-Football-Reference.com to determine all players who were designated as “out” for at least 1 game or put on the “injured reserve” or “physically unable to perform” list because of an injury listed as “knee,”“leg,”“quadriceps,” or “undisclosed.”25,27
The NFL’s weekly injury report policy consists of practice reports, game status reports, and in-game injury reports. 21 The practice reports provide teams and the public with an accurate description of a player’s injury status and his level of participation during the practice week. The game injury reports provide teams and the public with an accurate description of a player’s anticipated availability for the team’s next game. Teams are required to report the status of their injured players at least 1 to 2 days before the next game and issue notice to the opposing team, local and national media, broadcast partners, and so forth. Team personnel are also responsible for reporting in-game injury information factually and accurately as soon as possible for the benefit of the network television audience and media. 21
Publicly available data from online league and player databases were used to further characterize the type and severity of each injury.6,10,11 Players who were determined to have PT or QT injuries were included in this present study. Player information (position, height, weight, age, and years of experience) and injury details (degree of tear, side of injury, injury during practice versus game, and what point in the season the injury occurred) were recorded for each injury included in this study. Injuries were graded as 1 (strain), 2 (partial tear), or 3 (complete tear or rupture) based on news articles and reports. If a report stated that a player had a “rupture” or “complete” tear, it was classified as a grade 3 injury. If a news report stated that a player had a “partial” or “incomplete” tear, then it was classified as a grade 2 injury. If a player’s injury was described as a “strain,” it was classified as a grade 1 injury. Injuries for which detailed reports did not outline the severity of the tear were classified as grade 3 if they were surgically managed and grade 2 if nonsurgical management was attempted. All dates of injury, operative versus nonoperative treatment, and surgical dates were identified by publicly available press releases. This form of data collection is well established in the literature.2,3,8,9,14,15,23
Player Performance
Pro Football Focus (PFF) was used to collect quantitative player grades for analysis. 26 The PFF grading system utilizes trained analysts who manually evaluate and grade every player on every play during a football game using every camera angle available. The grade is then finalized by a team of senior analysts who represent the top 2% to 3% of all PFF analysts. Each position has its own grading rubric, with each player being given a grade of −2 to +2 in 0.5 increments on a given play (with 0 being the average or expected grade). The grades are then converted to a 0 to 100 scale at the game and season level, making it easy to compare players relative to their peers. PFF overall offensive or defensive season rating (0-100) was recorded for each player during the season immediately before and the first 2 seasons after injury. The first postinjury season was defined as the first season the player was able to RTP in a game after injury. Relative performance 1 season after injury and 2 seasons after injury were calculated by dividing the PFF score for each season by the PFF score for the immediate preinjury season. The number of players who returned to prior performance within 2 seasons of injury was determined. Rookie players who did RTP were excluded from these data, as they had no available performance or game logs from the year before injury.
Return to Play
RTP information for each player was determined by looking at game log and season statistics on Pro-Football-Reference.com. 27 RTP was defined as returning to play in at least 1 regular season game after injury. For players who returned to play, the date of the next regular season NFL game that they played in was recorded. The number of games that each player started in and the number of games played in were recorded for the season immediately before their injury and the first 2 postinjury seasons. The relative number of games played in and the number of games started in were calculated 1 and 2 seasons after injury by dividing postinjury data by data from the season immediately before injury. The number of players who returned to play in as many games and the number who returned to start in as many games within 2 seasons after injury were determined. Rookie players who did RTP were again excluded from these data. RTP time for each player who returned was calculated in number of days between injury and the next regular season NFL game played in.
Statistical Analysis
For statistical analyses, the total number of NFL players, offensive players, defensive players, special teams players, and players by position were calculated in player-years based on the standard composition of a 53-man NFL roster for 32 teams and 14 seasons. 32 Player position groups were categorized as offensive linemen, offensive skill positions (quarterback, running back, wide receiver, and tight end), defensive linemen, defensive skill positions (cornerback, safety, and linebacker), and special teams. Thresholds for BMI, age, and years of experience were set at 31, 26 years, and 4 years, respectively, based on the reported NFL averages.12,22,28,33 Total years of NFL experience were defined for each player based on the total number of seasons in which they played at least 1 regular season game before and including the year the tendon injury occurred. Descriptive statistics were calculated to determine means, standard deviations, and percentages. Data were analyzed to determine statistically significant differences in proportions using chi-square tests, Fisher exact tests, or McNemar tests. Statistical significance was set at P < .05. Odds ratios (ORs) were calculated when significant differences in proportions were noted. Statistical analysis was performed using Microsoft Excel.
Results
A total of 80 extensor tendon tears in 77 players were identified between the 2009-2010 and 2022-2023 NFL seasons, with a mean age of 26.66 ± 3.02 years and a mean BMI of 32.73 ± 4.44. A total of 24 QT tears in 24 players were identified, with a mean age at the time of injury of 28.42 ± 3.03 years and a mean BMI of 34.29 ± 3.66. A total of 56 PT tears in 53 players were identified, with a mean age at the time of injury of 25.91 ± 2.71 years and a mean BMI of 32.06 ± 4.61. Patient characteristics are displayed in Table 1. The mean player age was calculated based on player age at the time of injury. The mean years of NFL experience were calculated by determining the total number of seasons that each player participated in at least 1 game at the time the extensor injury occurred. Yearly incidence for QT and PT tears is plotted in Figure 1.
Patient Characteristics a

Data are presented as mean ± SD. BMI, body mass index; NFL, National Football League. 1 in = 0.025 meters; 1 lb = 0.454 kg.

Yearly incidence for quadriceps tendon and patellar tendon tears between the 2009-2010 and the 2022-2023 NFL seasons. The dotted black line in each panel represents a linear trend line.
Among the 24 QT tears, 2 (8.3%) were grade 2 (partial) tears and 22 (91.7%) were grade 3 (complete) tears. Two (8.3%) occurred in practice, while 22 (91.7%) occurred in a game. In total, 21 (87.5%) QT tears occurred during the regular season, with 17 (81%) of those occurring in the first 8 games of the season. Nine (37.5%) QT tears occurred in the left knee, 13 (54.2%) occurred in the right knee, and 2 (8.3%) had unknown laterality. All 24 QT tears were treated with surgical management.
Among the 56 PT tears, 5 (8.9%) were grade 2 tears and 51 (91.1%) were grade 3 tears. Eight (14.3%) occurred in practice, while 48 (85.7%) occurred in a game. A total of 39 (69.6%) PT tears occurred during the regular season, and 17 (30.4%) occurred during the preseason. Of the 38 injuries that occurred during a regular season game, 21 (55.3%) occurred in the first half of the season and 17 (44.7%) occurred in the second half of the season. Seventeen (30.4%) PT tears occurred in the left knee, 32 (57.1%) occurred in the right knee, 3 (5.4%) were bilateral, and 4 (7.1%) had unknown laterality. In total, 53 (94.6%) PT tears were treated surgically and 3 (5.4%) injuries had unknown management. Injury characteristics are summarized in Table 2.
Injury Characteristics a

Data are presented as n (%). Nonop, nonoperative.
There was 1 regular season injury during practice.
Seven (29.2%) QT injuries occurred in offensive players, 16 (66.7%) occurred in defensive players, and 1 (4.2%) occurred in a special teams player. Among the 7 offensive player QT tears, 1 occurred in an offensive skill position player and 6 occurred in offensive linemen. Among the 16 defensive player QT tears, 10 occurred in defensive linemen and 6 occurred in defensive skill position players. The 1 special team’s QT tear occurred in a kicker.
A total of 32 (57.1%) PT injuries occurred in offensive players and 24 (42.9%) occurred in defensive players. Among the 32 offensive player PT tears, 15 occurred in offensive skill position players and 17 occurred in offensive linemen. Among the 24 defensive player PT tears, 8 occurred in defensive linemen and 16 occurred in defensive skill position players. Injuries by position and position group are displayed in Table 3.
Quadriceps Tendon and Patellar Tendon Injuries by Position a

Data are presented as n (%).
QT tears were significantly more likely to occur in players with BMI ≥31 (P = .025; OR, 3), aged ≥26 years (P < .001; OR, 11), and with ≥4 years of NFL experience (P = .025; OR, 3). QT tears were also significantly more likely to occur in games than in practice (P = .0001; OR, 11), in the regular season compared with preseason or postseason (P < .0001; OR, 23), and in the first half of the season compared with the second half of the season (P = .0088; OR, 4.3). Being an offensive versus defensive player did not appear to be a significant risk factor for QT tear. However, the rate of QT injury was significantly greater for offensive and defensive linemen compared with offensive and defensive skill players (P = .0016; OR, 5.2).
PT tears were significantly more likely to occur in games than in practice (P < .0001; OR, 55) and in the regular season compared with preseason or postseason (P = .005; OR, 2.3). Age, BMI, offensive versus defensive player, years of NFL experience, and early versus later regular season did not appear to be significant risk factors for PT tears. Risk for PT injury was significantly higher for offensive linemen compared with other position groups (P = .021; OR, 2.0). PT and QT risk factor data are displayed in Table 4.
Risk Factors for Quadriceps Tendon and Patellar Tendon Tears a
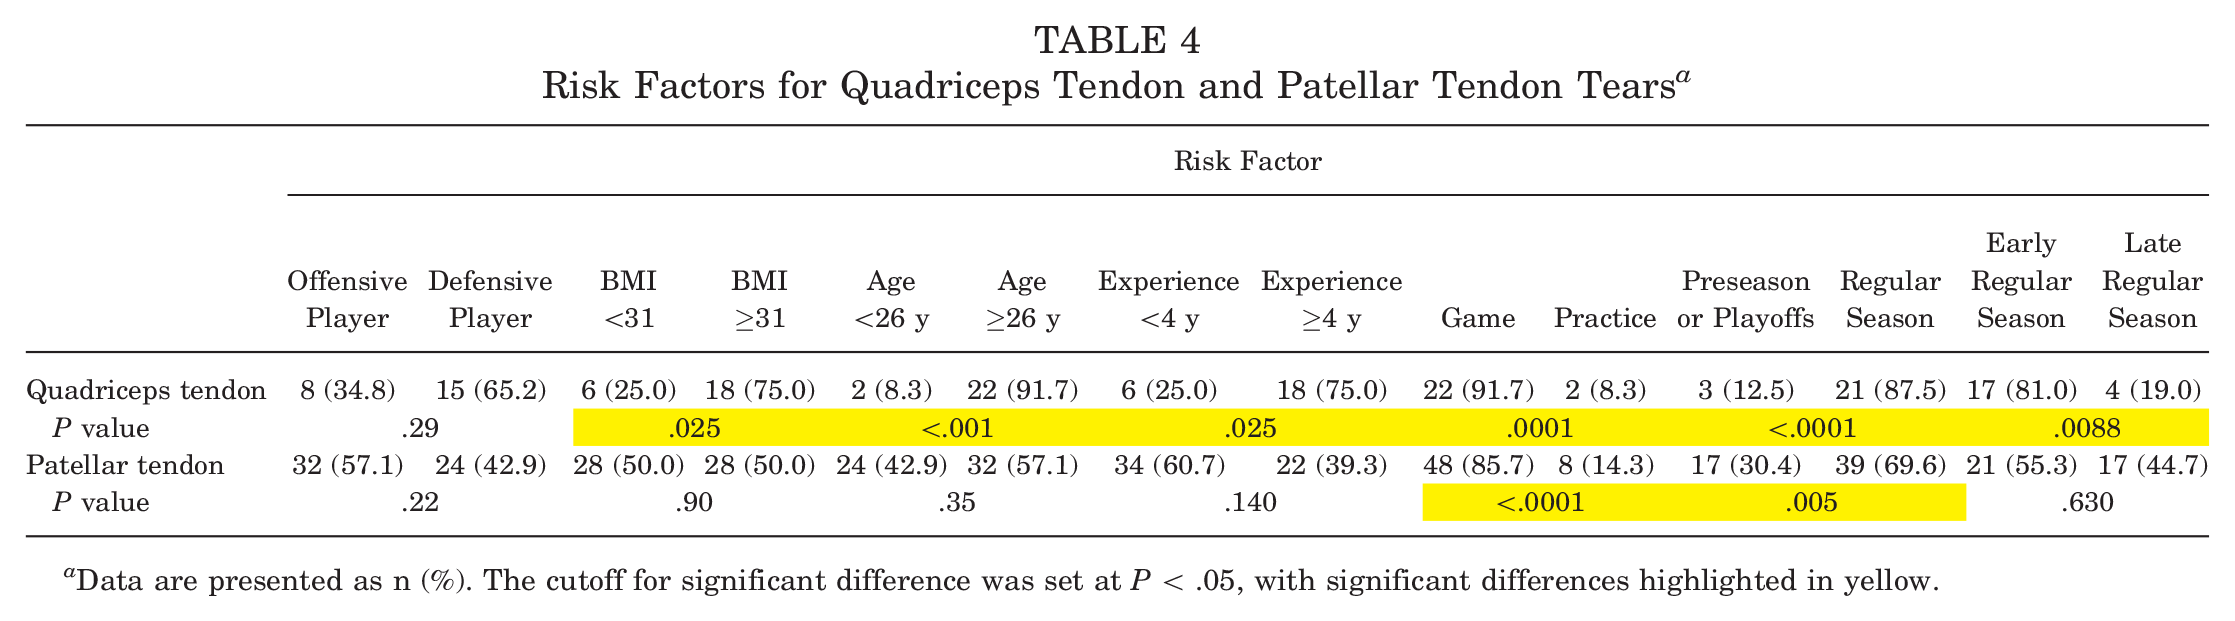

Data are presented as n (%). The cutoff for significant difference was set at P < .05, with significant differences highlighted in yellow.
The overall RTP rate for QT tears was 58.3% (14/24). For players with QT tears, 33.3% (8/24) returned to their prior performance level within 2 years, with 6 players doing so during the next season and 2 players doing so during the second postinjury season. Overall, 25% (6/24) of players with QT tears returned to play in as many games within 2 seasons as they did in the season before injury, and 12.5% (3/24) returned to start in as many games within 2 seasons as they did in the season before injury. For players with QT tears who did RTP, the mean time to RTP in a regular season game was 345.57 ± 45.58 days.
The overall RTP for PT tears was 55.4% (31/56). For players with PT tears, 21.4% (12/56) returned to their prior performance level within 2 years, with 7 players doing so during the next season and 5 players doing so during the second postinjury season. Overall, 26.0% (13/50) of players with PT tears returned to play in as many games within 2 seasons as they did in the season before injury, and 16.0% (8/50)returned to start in as many games within 2 seasons as they did in the season before injury. For players with PT tears who did RTP, the mean time to RTP in a regular season game was 356.97 ± 113.46 days. RTP and performance results are summarized in Table 5.
RTP and Performance Results for Quadriceps Tendon and Patellar Tendon Tears a

Data are presented as n (%) unless otherwise indicated. Return to play (RTP) was defined as returning to play in at least 1 regular season game after injury.
The overall RTP percentages, the percentage who returned to playing in as many games as before injury, the percentage who returned to starting in as many games as before injury, the percentage who returned to prior performance, and the percentage of those who returned to performance in the first or second season postinjury were evaluated based on player age, years of experience, offense versus defense, BMI, complete versus partial tear, left versus right tear, unilateral versus bilateral tear, quadriceps versus patellar injury, and position group. Among QT injuries, there were no significant differences in any of these RTP or performance percentages. Among PT injuries, players with NFL experience >4 years were significantly more likely to RTP than those with ≤4 years of NFL experience (P = .033; OR, 3.4). Furthermore, players aged ≥26 years (P = .018; OR, 11.4), players with NFL experience >4 years (P = .05; OR, 4.2), and defensive players (P = .027; OR, 4.7) were significantly more likely than their counterparts to return to playing as many games as they did in the year before PT injury. Defensive linemen were significantly more likely than offensive linemen to return to playing in as many games as they did in the year before PT injury (P = .046; OR, 15). These data are displayed in Tables 6 and 7.
RTP and Return to Performance Based on Player and Injury Characteristics for Quadriceps Tendon Injuries a

The cutoff for significant difference was set at P < .05. BMI, body mass index; RTP, return to play. Data are presented in 2×2 contingency squares with the associated P value for each square listed.
RTP and Return to Performance Based on Player and Injury Characteristics for Patellar Tendon Injuries a

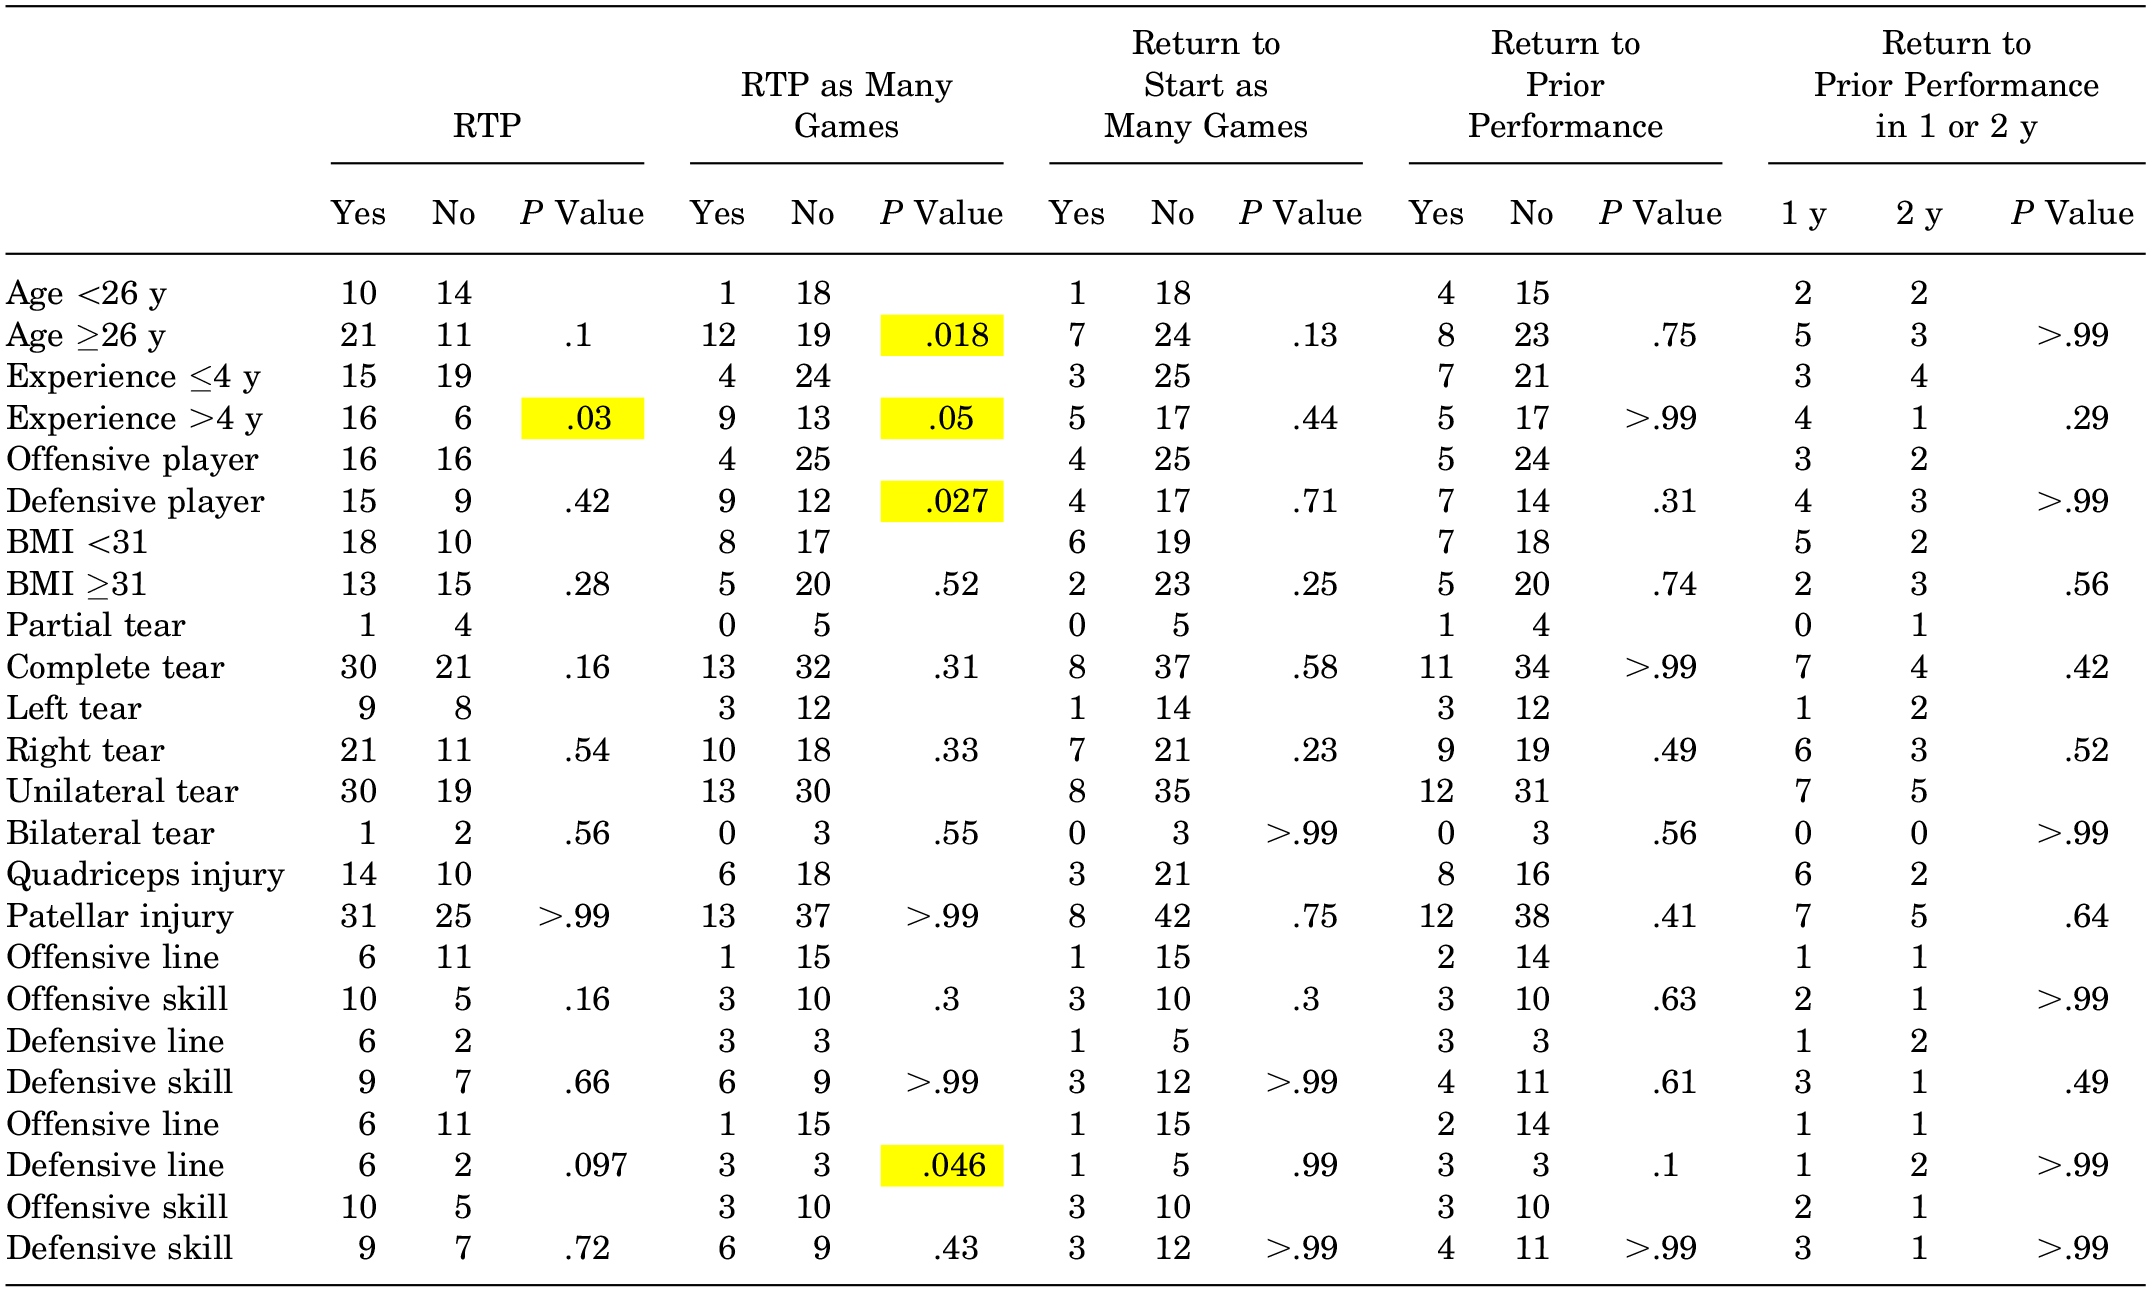
The cutoff for significant difference was set at P < .05, with significant differences highlighted in yellow. BMI, body mass index; RTP, return to play. Data are presented in 2×2 contingency squares with the associated P value for each square listed.
Discussion
While QT and PT tears remain rare in the NFL, the impact that these injuries can have on a player’s career is significant. This study identified a total of 24 QT tears and 56 PT tears in the NFL between the 2009-2010 season and the 2022-2023 season. PT injuries were more than twice as common as QT injuries in the NFL during this time frame, with mean rates of 4.0 per year and 1.7 per year, respectively. Linear trend lines for QT and PT tear incidence suggest that QT tear incidence may be decreasing slightly while PT tear incidence is increasing slightly. QT tears were associated with greater mean player BMI and mean player age compared with PT tears. Player risk factors for QT injury include BMI ≥31, age ≥26 years, and having ≥4 years of NFL experience. BMI, age, and NFL experience did not seem to be significant risk factors for PT injury. The risk for QT injuries appeared to be significantly greater in offensive and defensive linemen compared with skill players, while the risk for PT injury seemed to be significantly greater for offensive linemen compared with other position groups. Both PT and QT injuries were significantly more likely to occur in games compared with practice and in the regular season compared with the preseason and postseason. QT injuries, but not PT injuries, were significantly more likely to occur during the first half of the regular season than during the second half of the regular season.
Overall, 77 of 80 (96.3%) of extensor tendon injuries included in this study were season ending. The rate of RTP for QT injuries was slightly greater (58.3%) than the rate of RTP for PT injuries (55.4%). While the percentages of players with QT and PT injuries who were able to return to playing in and starting in as many games as before injury were comparably low, a greater percentage of players with QT tears were able to return to prior performance level. Furthermore, players with QT who returned to prior performance were more likely than players with PT tears to do so during the next season. Regarding QT injuries, there were no significant correlations between RTP and return to performance metrics based on player and injury characteristics. Players with PT injuries were more likely to RTP if they had >4 years of NFL experience. Players with PT injuries were more likely to RTP as many games as before injury if they were at least 26 years of age, had >4 years of NFL experience at the time of their injury, and were defensive players. Defensive linemen were more likely to return to playing as many games as before PT injury compared with offensive linemen.
The present study showed similar but higher rates of QT and PT injury compared with that reported in prior literature. Boublik et al4,5 reported 14 QT injuries (1.4 per year) and 24 PT injuries (2.4 per year) in the NFL during 10 years between 1994 and 2004. They also reported that the mean age of players with QT injuries was 27.1 years and the mean age of players with PT injuries was 26.2 years.4,5 These mean ages were similar to those reported in this study, with the mean age at the time of QT injury being higher in our study (28.4 years) and the mean age at the time of PT injury being slightly lower in our study (25.9 years).
The present study showed similar RTP rates for QT injuries but significantly lower RTP rates for PT injuries compared with prior literature by Boublik et al4,5, who reported that 50% (7/14) of players with QT injuries returned to play and 79% (19/24) of players with PT injuries returned to play.4,5 Nguyen and Hsu 23 reported a high RTP rate of 88.9% after PT repair for athletes as a whole. However, among professional athletes, the RTP rate dropped to 77.7%, with RTP rates being the lowest among professional American football players at 57.7%. The reported RTP rate by Nguyen and Hsu 23 in professional American football players is comparable to the RTP rate of 55.4% that was found in our current study. These findings highlight the negative impact that extensor tendon injuries can potentially have on the career of professional athletes, particularly American football players.
Similar studies have looked at the incidence and impact of extensor tendon injuries in the National Basketball Association (NBA). Nguyen et al 24 identified 13 PT tears (10 complete tears, 3 partial tears) in the NBA between the 1999-2000 and 2014-2015 seasons. There was a 75% RTP rate among these NBA players with no significant difference in performance before versus after injury. There were significant decreases, however, in total minutes played, games played, and minutes per game. Morikawa et al 20 identified 9 QT tears (3 complete tears, 6 partial tears) in the NBA between the 1990-1991 and 2021-2022 seasons. There was a 78% RTP rate in these NBA players, with players returning to their preinjury performance within 2 seasons but with a significant decline in games played and minutes per game.
The findings of this study build off prior literature regarding extensor tendon injuries in the NFL. The rates of QT and PT injury were greater in this study compared with those found in previous studies that reported injuries between 1994 and 2004, which suggests that extensor tendon injuries may be more prevalent in recent decades than they were previously. RTP rates for QT and PT injuries were both fairly low in this study, around 55%. While similar to the previously reported 50% RTP rate after QT injury in NFL players, our findings showed a significantly lower RTP rate than the previously reported 79% RTP rate after PT injury.4,5 These results suggest that while QT injury remains potentially devastating for players in the NFL, PT injuries may be even more devastating for a player’s career than previously reported. This study also suggests that extensor tendon injuries in the NFL are greater than recently published rates in the NBA, with injury in NFL players having a more significant impact on RTP and return to performance compared with NBA players. Future research from this group may investigate potential causes for the rising incidence and increasingly negative impact of extensor tendon injuries in the NFL.
Limitations
There are limitations of this study. Most limitations of this study stem from using public databases to capture and characterize extensor tendon injuries. This opened the possibility of missing extensor tendon injuries in the NFL over the seasons of interest. Using public databases also limited the information we could acquire about the injuries, including the degree of tear and side of injury and limited the information we could gather about specific treatment modalities. The use of several player databases, the regimented release of NFL injury reports, and the wide amount of information reported on NFL players and teams allowed us to capture all reported QT and PT injuries possible. Furthermore, the QT and PT injury rates, proportions of tears by degree, and RTP rates in our study are similar to those reported previously in the literature.4,5
Conclusion
While both are relatively rare, PT injuries were more common than QT injuries in the NFL between the 2009-2010 and 2022-2023 seasons. Risk factors for QT injury included BMI ≥31, age ≥26 years, and ≥4 years of NFL experience. Overall, 96.3% of extensor tendon injuries included in this study were season ending. The RTP rate for QT injuries was slightly greater (58.3%) than the rate of RTP for PT injuries (55.4%), with most athletes failing to return to their prior performance or number of games played. The rates of QT and PT injuries were greater in this study compared with those found in prior NFL studies, suggesting that extensor tendon injuries may be more prevalent in recent decades than they were previously. While our findings showed similar RTP rates after QT injury compared to previous literature in NFL players, they also showed a significantly lower RTP rate than the previously reported rate after PT injury. This research highlights the significant, devastating, and increasing impact that extensor tendon injuries have on players in the NFL.
Footnotes
Final revision submitted May 21, 2024; accepted June 25, 2024.
One or more of the authors has declared the following potential conflict of interest or source of funding: Research support was received from the Barry J. Gainor Resident Research and Scholarship Endowment Fund and the University of Missouri Orthopaedic Association Research Fund. J.L.C. has received research support from the Arthroscopy Association of North America, AO Trauma, Arthrex, Collagen Matrix, GE Healthcare, MTF Biologics, OREF, Orthopaedic Trauma Association, PCORI, Regenosine, SITES Medical, Thieme, and US Department of Defense; consulting fees from Arthrex, Bioventus, Boehringer Ingelheim, Collagen Matrix, and Trupanion; and royalties from Arthrex, MTF Biologics, and Thieme. S.F.D. has received grant payments from Arthrex; education payments from Elite Orthopedics, Arthrex, Smith+Nephew, Medwest Associates, and Medical Device Business Services; consulting fees from Stryker; nonconsulting fees from Synthes GmbH; royalties from Elsevier; honoraria from Encore Medical; and hospitality payments from Stryker. AOSSM checks author disclosures against the Open Payments Database (OPD). AOSSM has not conducted an independent investigation on the OPD and disclaims any liability or responsibility relating thereto.
Ethical approval was not sought for the present study.