
Abstract
Background:
Patients who undergo hip arthroscopy for femoroacetabular impingement (FAI) require lower extremity immobilization for an extended period of time. Periods of immobilization combined with surgery have been associated with decreased muscle mass and bone mineral density (BMD).
Purpose/Hypothesis:
The purpose of this study was to characterize postoperative body composition and BMD changes after arthroscopy for FAI. It was hypothesized that both lean mass and BMD would decrease postoperatively and then normalize over time.
Study Design:
Case series; Level of evidence, 4.
Methods:
This was a retrospective review of 23 National Collegiate Athletic Association Division I athletes who underwent hip arthroscopy between 2017 and 2019 and had a dual-energy x-ray absorptiometry scan preoperatively and at 3, 6, 12, or 24 months postoperatively. Linear mixed-effects models were used to compare pre- with postoperative lean and fat mass values for the total body and total leg (both operative and nonoperative sides) as well as trunk, pelvic, and spinal BMD. For total-leg, femur, and femoral BMD, linear mixed-effects models were used to evaluate the influence of time, side (operative vs nonoperative), and their interaction on each outcome measure.
Results:
Regarding pelvic BMD, compared with baseline (mean, 1.41 g/cm2 [95% CI, 1.33-1.49]), significant decreases were seen at postoperative 3 months (mean, 1.36 g/cm2 [95% CI, 1.28-1.45 g/cm2]; P < .001) and 6 months (mean, 1.39 g/cm2 [95% CI, 1.27-1.52 g/cm2]; P < .01) but not at 12 months (mean, 1.42 g/cm2 [95% CI, 1.33-1.51 g/cm2]; P = .319). Total-leg BMD for the operative side increased significantly from baseline (mean, 1.52 g/cm2 [95% CI, 1.43-1.61 g/cm2]) to ≥2 years postoperatively (mean, 1.56 g/cm2 [95% CI, 1.47-1.65 g/cm2]) (P = .005). Combined leg fat mass was increased from baseline (mean, 6427 g [95% CI, 4855-7999 g]) to ≥2 years (mean, 11645 g [95% CI, 7845-15,446 g]) (P < .01). There were no significant differences in total-body fat or lean mass or combined-leg lean mass.
Conclusion:
In this patient population, a postoperative decrease in pelvic BMD that resolved by 12 months and an increase in total-leg BMD on the operative side at ≥2 years were observed. While hip arthroscopy for FAI may have significant benefits for long-term body composition and bone mass, clinicians should be aware of the potential implications of decreased bone mass for up to 12 months postoperatively.
Symptomatic femoroacetabular impingement (FAI) in the competitive athlete is particularly important, as exposure to repetitive traumatic activities can result in labral injury, precipitous articular cartilage damage, disabling pain, and alteration in athletic performance.17,32 Although previous data suggest improvement in clinical outcome scores after hip arthroscopy,22,38,41 there is a paucity of evidence on how this surgical intervention affects biometric outcomes such as bone mineral density (BMD) and body composition.
Although there are no clear evidence-based guidelines regarding weightbearing and rehabilitation after hip arthroscopy for FAI,11,14,37 these patients often require weightbearing restrictions and lower extremity immobilization for an extended period of time postoperatively.11,39,43 These restrictions may decrease muscle mass and worsen the BMD changes associated with injury. BMD changes have been previously described after trauma and other surgical interventions,6,29 but there are limited data on these changes after hip arthroscopy for FAI. When examining the impact of arthroscopy for FAI in athletes, it should be considered that this population is accustomed to high levels of training and expectations of the body's resilience. A reduction of BMD at the resumption of intense training may put athletes at risk for bone stress injuries after surgery. 33 For this population in particular, understanding the impact of arthroscopy for FAI on fat mass and lean mass is important, as these changes may affect athletic performance. Further knowledge could help guide patient expectations and return to sports.
In this study, we aimed to characterize postoperative body composition and BMD both at the hip and throughout the body, as well as the duration of these changes through the postoperative period, in collegiate athletes. We hypothesized that both lean mass and BMD would decrease postoperatively and then normalize over time.
Methods
We retrospectively reviewed the dual-energy x-ray absorptiometry (DXA) images of National Collegiate Athletic Association (NCAA) Division I athletes who underwent unilateral hip arthroscopy for FAI with both labral repair and cam femoral osteoplasty. Athletes were included if they had undergone hip arthroscopy surgery between January 1, 2017, and May 1, 2019, and had also undergone DXA scans before surgery and at least once during postoperative intervals at 3 months, 6 months, 12 months, or ≥2 years. DXA imaging is standard practice for all University of Wisconsin athletes, and the postoperative intervals are standard of care at our institution. Preoperative DXA scan intervals ranged between 1 week and 24 months, and the preoperative DXA scan nearest the surgical date was included in our analysis. Exclusion criteria were open hip surgery, concomitant sports hernia surgery, other lower extremity surgery during the postoperative period, and failure to complete preoperative testing. The protocol for this study received institutional review board approval.
Dual-Energy X-Ray Absorptiometry
A GE Healthcare Lunar DXA densitometer was used to acquire all total-body images, which included fat mass, lean mass, and bone as bone mineral content (BMC). All of these direct measures were reported as a percentage of total body mass. BMD was calculated as the ratio of BMC/area. 7 Scans were acquired and analyzed in a routine clinical manner, following standard operating procedures based on published recommendations.26,36 Athletes were scanned in their usual hydration state; no fasting or other limitations on their usual activities were implemented. All scans were acquired and analyzed on enCORE software (Version 14.1; GE Healthcare) up to October 1, 2019, and enCORE software (Version 17.1) for subsequent images; all scans were analyzed using the software's auto analysis feature. When necessary, one of the authors performed manual correction of analysis markers using previously published techniques 23 to ensure appropriate identification of the trunk, arms, and legs. Athletes were fit to the scan field; no estimations were obtained using the hemiscan software (enCORE) feature for total-body scans. Athletes who exceeded the length of the scan field were positioned such that a portion of their head was excluded from measurement. Percentage coefficient of variation for total-body DXA results from this performance center have been published elsewhere 3 and range between 0.07% and 1.46% for measurement of total-body fat and lean mass, which falls within the International Society for Clinical Densitometry recommended range. 36
BMD values were extracted for spine and pelvis as well as for each leg separately (Figure 1A). Lean and fat mass values were extracted for total-body and total-leg regions of interest (Figure 1B). A subset of patients also had dual femoral scans performed at 3, 6, and 12 months; these included the femoral neck, shaft, upper neck, lower neck, trochanter, and Ward triangle (Figure 1C). For bilateral limb measurements, each limb was coded as operative or nonoperative.

(A) Bone mineral density values were extracted for spine and pelvis, as well as each leg separately. (B) Lean and fat mass values were extracted for total-body and total-leg regions of interest. (C) The dual-femoral scan included the femoral neck, shaft, upper neck, lower neck, greater trochanter, and Ward triangle. Yellow outline indicates the border of the bone included in the analysis. Blue outline indicates the ROIs measured.
Statistical Analysis
Descriptive characteristics were reported as mean ± SD for continuous variables and count and proportion for categorical variables. For total-body and total-leg lean and fat mass, as well as trunk, pelvic, and spinal BMD, least squares means from linear mixed-effects models were used to compare values at each follow-up time point with preoperative values, with individuals modeled as a random effect. For BMD of the leg, femur, and femoral regions, linear mixed-effects models were used to evaluate the influence of time, side (operative, nonoperative) and the time × side interaction on each outcome measures. Least squares means with 95% CIs were then used to compare the differences preoperatively with each follow-up time point within each limb separately. Tukey-adjusted P values were used to account for multiple comparisons. Significance was determined a priori at the .05 level. All tests were 2-tailed, and all statistical analyses were performed in R (Version 4.4.0; The R Foundation).
Results
Patient Characteristics
A total of 23 athletes were identified for inclusion in the final data set. There were 13 male and 10 female patients and 12 left-sided and 11 right-sided surgeries. The sample comprised athletes from multiple sports including football (n = 9), soccer (n = 3), rowing (n = 3), volleyball (n = 2), track and field (n = 2), wrestling (n = 2), and ice hockey (n = 2). The number of athletes who underwent DXA and bilateral femoral scans at each time point is shown in Table 1.
Athletes Who Underwent DXA Scans at Each Time Point a
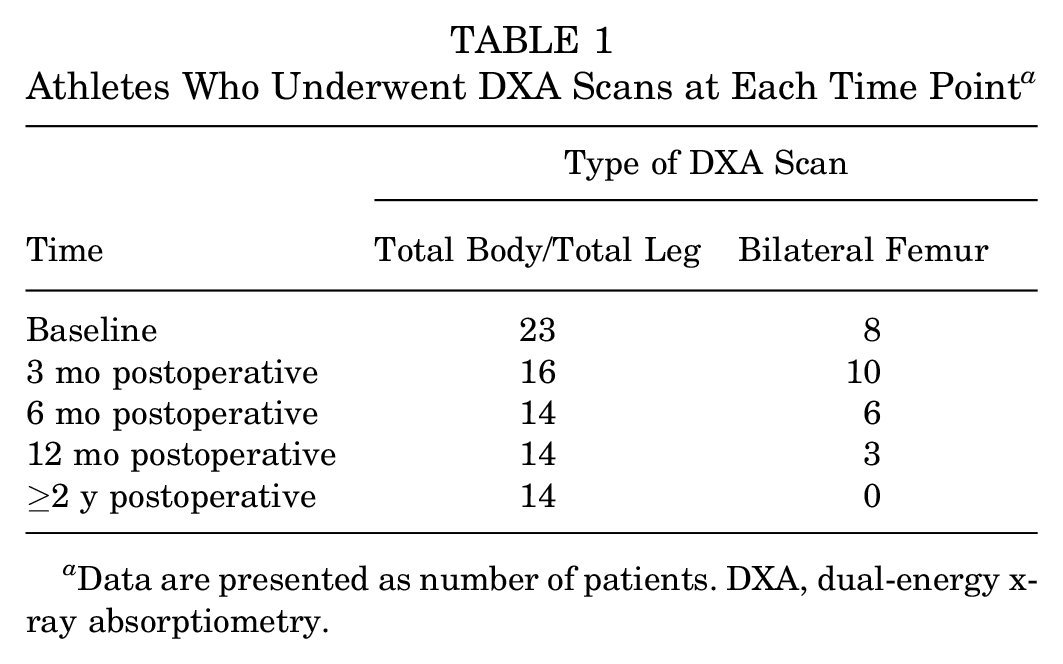
Data are presented as number of patients. DXA, dual-energy x-ray absorptiometry.
Within-Participant Comparison of BMD and Body Composition
Pelvic BMD was significantly decreased from baseline at postoperative 3 months (P < .001) and 6 months (P < .001), but this difference was no longer significant at 12 months (P < .1) (Figure 2A). Spinal BMD decreased from baseline at 3 and 6 months postoperatively, but these changes were not statistically significant (P = .80 and .39, respectively) (Figure 2B). Values for BMD at each time point are presented in Supplemental Table S1 (available separately).

Least squares mean values of bone mineral density (BMD) values at the (A) pelvis and (B) spine from preoperatively to 24 months postoperatively. Error bars depict 95% CIs. Statistically significant difference compared with baseline: *P < .05, ***P < .001.
There was a statistically significant increase in combined-leg fat mass at ≥2 years postoperatively (P = .004) and an increase in total-body fat mass that approached significance (P = .06) (Figure 3, A and B). When examining total-body and combined-leg lean mass, we observed a trend toward increasing lean mass compared with baseline at 12 months and ≥2 years, but this was not statistically significant (P = .97 and .80, respectively). (Figure 3, C and D). Values for lean and fat mass at each time point are presented in Supplemental Table S2.

Least squares mean values for (A) combined-leg fat mass, (B) total-body fat mass, (C) combined-leg lean mass, and (D) total-body lean mass. Error bars depict 95% CIs. **Statistically significant difference compared with baseline (P < .01).
Between-Limb Comparison of BMD by Time From Surgery
When examining femoral BMD, we found that within the upper neck region, the operative side demonstrated a trend in decreasing BMD relative to the nonoperative side at 3 months (P = .17) that nearly met significance by 6 months (P = .06). This was no longer statistically significant at 12 months (P = .22) (Figure 4B). We found that total-leg BMD was significantly increased from baseline at ≥2 years (P = .005) for the operative leg but did not identify any difference in BMD in the nonoperative leg (Figure 4A). We did not identify any differences in BMD when comparing operative and nonoperative sides with respect to the greater trochanter, Ward triangle, lower femoral neck, or femoral shaft (Figure 4, C-F). Complete BMD values are presented in Supplemental Table S3.

Least squares mean values of bone mineral density (BMD) values from preoperatively up to ≥2 years postoperatively. (A) Total-leg BMD for operative side. (B) Upper femoral neck BMD. (C) Lower femoral neck BMD. (D) Ward triangle BMD. (E) Femoral greater trochanter BMD. (F) Femoral shaft BMD. Error bars depict 95% CIs. **Statistically significant difference versus baseline (P < .01).
We did not identify any significant side × time interactions with respect to Ward triangle, upper and lower femoral neck, greater trochanter, or femoral shaft. However, there was a significant side × time interaction for total-leg BMD (estimate [SE] = 0.066 [0.018]; P < .0001). The complete regression analysis is shown in Supplemental Table S4.
Discussion
In this study, we evaluated changes in body composition and BMD from baseline to 24 months after hip arthroscopy for FAI in NCAA Division I athletes. Our primary finding was that patients developed significantly decreased BMD in the pelvis at 3 and 6 months after hip arthroscopy that was no longer significantly different by 1 year after surgery.
Spinal and Pelvic BMD
Our findings demonstrating decreased BMD within the pelvis are consistent with previous literature demonstrating central BMD changes after immobilization4,9,18 and the negative effects of surgery and local inflammation on BMD.10,19,23 However, the total-spinal BMD did not show any significant changes throughout the postoperative period in this study. It is unclear why we did not also observe decreased BMD within the spine. It may be that the pelvis is closer to the surgical site and BMD in that region may be more responsive to local inflammation or that the pelvis is a greater weightbearing structure that experiences greater changes in BMD after immobilization.8,16 Additionally, weightbearing on the nonoperative leg may put enough stress through the spine to counteract BMD changes. It may also be that because our total-spine measurements include the thoracic and cervical spine, they may not represent changes in the lumbar spine, which is considerably more weightbearing and in closer proximity to the pelvis and surgical site.
Body Composition
Although lean mass was increased from baseline at ≥2 years postoperatively, this increase was not statistically significant. However, this may be a product of our population size, and our data still may suggest that hip arthroscopic surgery for FAI contributed to the restoration of these patients’ ability to engage in physical training, contributing to increased lean mass in particular. Additional factors such as maturity and time likely play a role as well. The observed increase in fat mass by ≥2 years after surgery may be a function of the time and physical maturity among athletes in the study. Previous research has demonstrated increases in fat mass in collegiate athletes during their collegiate careers. 20
Proximal Femoral BMD
We did not identify statistically significant changes in the BMD within the proximal femur. The decrease in upper femoral neck BMD approached, but did not reach, statistical significance at 6 months postoperatively (P = .06). However, these findings are still clinically relevant, as upper neck is resected during a cam osteoplasty; which likely explains the changes seen in upper neck BMD and why this region may respond differently than other regions of the proximal femur. All of the proximal femoral sites did have a decrease in BMD at 3 months that seemed to stabilize by 6 to 12 months postoperatively, but these were not statistically significant. Our ability to identify statistically significant relationships is likely limited by our smaller sample size with the proximal femoral analysis compared with other areas. Bone loss within these regions is likely multifactorial including tissue trauma from the surgical procedure, local inflammation, post-operative period of immobilization, and disuse of the operative leg.
A significant time × limb interaction was detected, with a greater increase in BMD from baseline at 2 years in the operative limb compared with the nonoperative limb. This may be due to differences in baseline BMD values secondary to uneven distribution of forces on the lower extremities as a result of favoring the uninjured hip preoperatively. 31 It may also be due to a change in loading forces of the pelvis after hip surgery27,40 or rehabilitation protocols and increased resistance training in the operative leg.21,44
Clinical Implications
This is the first study to evaluate BMD changes after hip arthroscopy for FAI, and although our conclusions were limited by the study sample size (N = 23), there is some suggestion that BMD decreases after hip arthroscopy and may not return to baseline by 6 months postoperatively. Although there are no clear, evidence-based protocols regarding postoperative rehabilitation after hip arthroscopy, a gradual increase in weightbearing over roughly 3 to 6 weeks with progression to ambulation without crutches by 6 to 8 weeks postoperative has been described.11,39,43 The current literature has indicated a broad time range for returning to activity after hip arthroscopy,2,5,24,35 with Parvaresh et al 35 reporting a mean time to return to sports after hip arthroscopy for FAI of 7 months (range, 3.1-14.5 months) in a recent comprehensive review. Therefore, many patients may not have returned to their baseline levels of BMD by the time they return to activity. This may put patients at increased risk for injury including femoral neck fractures. Biomechanical studies have demonstrated that cam osteoplasty reduces the load-bearing capacity of the femoral neck and peak load to fracture.27,28,34 This complication is rare, with several systematic reviews reporting rates of femoral neck fracture after hip arthroscopy of <1%.13,15,30,42 Zingg et al 45 found a rate of femoral neck insufficiency fractures of 1.9% in a series of 376 patients. Nonetheless, given the significance of such complication, steps to mitigate this risk are necessary. Additionally, several authors have suggested that early, aggressive postoperative weightbearing also increases the risk of fracture-related complications.1,12,30 This is especially concerning in NCAA Division I athletes, who are likely putting a much greater force through their hip than the general population. Taken together, our findings indicate a need to monitor BMD after hip arthroscopy when returning to activity, especially in our high-level athlete population.
Athletic participation has been associated with improved outcomes after hip arthroscopy, 25 and our patient population consisted of athletes with frequent and unrestricted access to sports medicine facilities and rehabilitation as well as significant exposure to both high frequencies and magnitudes of loading as part of training and competition. This may have allowed for a greater return of BMD when compared with the general population, further demonstrating a need to be aware of potential injury risks. These biometric changes, especially BMD, should be taken into consideration postoperatively, and mobilization and cautious lower extremity loading to improve BMD could be considered during rehabilitation.
Limitations
This study has several limitations. The size and demographics of our study population make generalizable statistical conclusions difficult, although there are currently very limited data on this patient population in the literature. Furthermore, the activity level of the athletes, which contributes to body composition changes, was not accounted for. Not all athletes underwent testing at all time points, though our statistical models accounted for missing data. There are limitations associated with DXA specifically. In this study, BMD values were obtained using full-body DXA scans, which may not be an exact estimate of BMD within the site-specific scans.
Conclusion
In this population of NCAA Division I collegiate athletes who underwent hip arthroscopy for FAI, a decrease in pelvic BMD that resolved by 12 months was observed. We also identified an increase in total-leg BMD compared with baseline at 2 years postoperatively in the operative side. The study findings suggest that while hip arthroscopy may have significant benefits for long-term body composition and bone mass, clinicians should be aware of the potential implications of decreased bone mass up to 12 months out from surgery.
Supplemental Material
sj-pdf-1-ojs-10.1177_23259671241284642 – Supplemental material for Biometric Changes Up to 2 Years After Hip Arthroscopy in National Collegiate Athletic Association Division I Athletes
Supplemental material, sj-pdf-1-ojs-10.1177_23259671241284642 for Biometric Changes Up to 2 Years After Hip Arthroscopy in National Collegiate Athletic Association Division I Athletes by Quinn Steiner, Brian E. Walczak, Jennifer Sanfilippo, Mikel R. Joachim, Kristin Haraldsdottir and Andrew M. Watson in Orthopaedic Journal of Sports Medicine
Footnotes
Final revision submitted March 21, 2024; accepted April 16, 2024.
One or more of the authors has declared the following potential conflict of interest or source of funding: B.E.W. has received hospitality payments from Smith+Nephew and Styker. AOSSM checks author disclosures against the Open Payments Database (OPD). AOSSM has not conducted an independent investigation on the OPD and disclaims any liability or responsibility relating thereto.
Ethical approval for this study was obtained from University of Wisconsin–Madison (ref No. 2018-0049).
References
Supplementary Material
Please find the following supplemental material available below.
For Open Access articles published under a Creative Commons License, all supplemental material carries the same license as the article it is associated with.
For non-Open Access articles published, all supplemental material carries a non-exclusive license, and permission requests for re-use of supplemental material or any part of supplemental material shall be sent directly to the copyright owner as specified in the copyright notice associated with the article.