
Abstract
Background:
Osteochondral defects (OCDs) in the knee joint have significant clinical implications, particularly regarding contact pressures and pressure distribution. Understanding how these factors are influenced by defect size and location is crucial for developing effective therapeutic strategies.
Purpose/Hypothesis:
The purpose of this study was to investigate the impact of defect size and location on contact pressures and pressure distribution in the knee joint. It was hypothesized that an increase in defect size would result in elevated contact pressures and alterations in pressure distribution, with specific variations related to defect location.
Study Design:
Descriptive laboratory study.
Methods:
The study utilized 6 cadaveric knees, including the patella and fibula, subjected to controlled compressive loading for measuring contact pressures. Simultaneously, computed tomography-based models were created for finite-element analysis (FEA) to investigate the impact of varying defect sizes and locations on contact pressures and pressure distribution in the knee joint, excluding the patellofemoral joint. The study employed analysis of variance to assess contact pressure and defect size association. Comparison between medial and lateral femoral condyles at full extension and 30° flexion angle was performed, followed by post hoc testing. Fisher exact test analyzed peak pressure point location and defect size, categorizing them into medial and lateral.
Results:
An increase in defect size corresponded with heightened contact pressures on both medial and lateral femoral condyles at full extension (P = .013 for medial and P = .024 for lateral). However, this correlation did not yield significant differences at 30° of flexion (P = .674 for medial and P = .333 for lateral). During mechanical testing, the highest pressures occurred near 5 mm defect dimensions. FEAs showed a significant increase in pressure and circumferential-edge stress with 7-mm defects. Peak contact pressure points shifted laterally with more significant defects.
Conclusion:
Our study demonstrated the impact of defect size, location, and alignment on knee joint contact pressures. Intervening promptly with defects exceeding 3 mm is crucial, as significant stress levels manifest beyond this threshold. Significant increases in contact pressures were noted with larger defect sizes, particularly between 3 and 10 mm at full extension. Peak pressure points shifted with defect size increments, and alignment variations showed minimal stress variation at 30° compared with 0°. FEA validated increasing contact pressures up to 7 mm defect size, beyond which pressures stabilized or slightly decreased. A concentrated pressure distribution on the medial side was observed. These findings inform our understanding of the biomechanical implications of OCDs.
Clinical Relevance:
In the field of sports medicine, this research offers valuable insights to clinicians and researchers, elucidating key factors influencing knee joint health and the potential consequences of OCDs.
Keywords
Osteochondral defects (OCDs) of the knee are lesions that involve damage to both the articular cartilage and the underlying subchondral bone. 5 OCDs can arise from multiple origins, including acute bony or ligamentous injury, the collapse of subchondral bone, and osteochondritis dissecans, and cause various symptoms, including pain, swelling, stiffness, and decreased mobility.4,12,31 These symptoms can significantly impact the quality of life and limit the ability to perform daily activities, such as walking, running, and climbing stairs. In addition, if left untreated, OCDs may progress to osteoarthritis: a degenerative joint disease that can lead to chronic pain, disability, and joint replacement surgery.6,13 Therefore, early detection and treatment of OCDs is critically important to prevent long-term joint damage and improve patient outcomes.
The treatment for OCDs depends on the severity and size of the lesion. For example, a significant or severe OCD may require surgical intervention to prevent further joint damage and reduce pain. In contrast, a more minor or less severe lesion may be treated with nonoperative management or less invasive methods such as marrow stimulation treatments.2,4,27 The choice between surgical intervention and nonoperative management is influenced by the lesion stability, size and location of the lesion, patient age and activity level, and other medical conditions.
The relationship between lesion size and joint biomechanics is essential when making treatment decisions for OCDs. For instance, some studies have suggested that larger OCDs can lead to greater contact pressures in the joint, which can further damage the surrounding tissue and compromise treatment outcomes.15,24 Biomechanical studies have also shown that defects of the same size but located in different joint areas can experience different amounts of peak pressure, subchondral bone contact, and stress at the chondral defect rim. 24 In addition, some studies have investigated the effect of OCD orientation on biomechanical forces in the joint.8,11,15 These studies have shown that the angle at which the defect is oriented can affect the stress and pressure distribution in the joint.11,15
Although there has been progress in understanding the relationship between lesion size, location, orientation, and joint biomechanics, it still needs to be addressed. One such limitation is the need for more standardization in study design and reporting, making comparing results across studies difficult. To overcome this limitation, computational tools such as finite-element analysis (FEA) can be used to estimate contact pressures in the joint and validate experimental testing results. FEA models can simulate the complex biomechanics of the joint, considering factors such as joint geometry, tissue properties, and loading conditions. By inputting data from experimental studies, such as joint kinematics and cartilage properties, FEA models can estimate contact pressures and stress distribution in the joint. In addition, FEA can be used to validate experimental testing results, as it provides a means to test hypotheses and evaluate the effects of different variables on joint function. Combining experimental testing and computational modeling can provide a more comprehensive understanding of the biomechanical factors contributing to OCD development and progression, ultimately leading to improved treatment outcomes.
To further advance our understanding of the biomechanical factors contributing to OCD development and progression, the purpose of our study was to investigate the effects of increasing OCD size on maximum pressure both on the medial and lateral sides of the femoral condyles. It was hypothesized that pressure at the defect rim would increase with escalating defect size. Variations in peak pressures between the medial (MFC) and lateral femoral condyles (LFC) were anticipated for any given range of motion. Moreover, it was conjectured that disparities in peak pressures would be observed between defects created at 0° and 30° in the same femoral condyle. In addition, we hypothesized that a size threshold would exist to suggest early surgical intervention. Consequently, a linear increase in defect edge size was expected to coincide with a notable elevation in maximum contact pressure surrounding the defect, aligning with the patterns of peak pressure distribution identified through FEA.
Methods
Specimen Preparation
A total of 6 knees (3 cadavers) were used for this study. All knees had no findings of arthritis or ligament damage. There were 3 right knees and 3 left knees. The mean age of the donors was 69.3 years, with a standard deviation of 20.1 years, and the sex distribution consisted of 2 male donors (33%) and 4 female donors (67%). An orthopaedic surgeon (J.K.), with over 15 years of experience specializing in knee surgery, carefully evaluated each specimen before inclusion.
All specimens were procured by a donating organization (Science Care) and prepared by removing the skin and muscle attachments while preserving the patella, quadriceps tendon, and patellar tendon for specimen mounting. The menisci, collateral ligaments, and cruciate ligaments were also maintained to ensure that the specimens were anatomically stable. As a result, full-thickness, square OCDs were created in each knee's MFC and LFC. The testing was conducted at full extension (0°) and flexion (30°) for each knee. The full-thickness, square OCDs were created with varying sizes ranging from 0.09 to 1.0 cm2, corresponding to 3, 5, 7, and 10 mm of side defect length (Figure 1). The intact knee was mounted onto an apparatus for testing, and the OCDs were created using a scalpel.

Osteochondral defects of varying sizes (3, 5, 7, and 10 mm) are depicted on the cartilage, with dimensions labeled, of the medial (M) and lateral (L) sides.
Mechanical Testing
The study used a custom-built testing apparatus to fix the tibia and femur via cylindrical clamps rigidly. The femur and tibia were positioned at a 0° angle for extension and a 30° angle for flexion. Custom fixtures were used to secure the tibia and femur with 8 bolts (M8; 1.25 mm × 80 mm) to prevent any sliding under load. The femur was connected to a load frame, allowing axial loading from 0 N to 600 N at full extension. To gauge the pressure between the femoral and tibial condyles, the study utilized pliable digital pressure sensors placed carefully in the medial and lateral compartments of the knee joint. The sensors were positioned carefully to avoid bending, calibrated in the proper position, and loaded from 0 to 600 N at a speed of 0.05 mm/s (Figure 2). The examination was conducted for each progressing defect size found on the MFC and LFC. A standard saline solution was sprayed throughout the testing procedure to keep the samples hydrated. The pressure measurements (in MPa) were obtained from load-sensing regions using digital sensors. Postprocessing analysis determined the peak contact pressure as the highest pressure within 3 mm of the defect edge. The Tekscan user interface (Tekscan, Inc) was used to identify the location of the peak pressure point relative to the defect center by analyzing pressure maps.

Testing setup and pressure sensor placement. (A) The specimen is clamped rigidly for complete extension testing and connected to a load cell. (B) The pressure sensor is positioned between the femur and tibia at the defect site.
FEA Validation
A 3-dimensional (3-D) finite-element model of the knee joint was generated using Ansys (Version 2022, Ansys Inc). A micro-computed tomography system scanned a cadaveric knee joint. The resulting stack of images was imported into the software to create a 3-D geometry of the knee joint. The bone surfaces were segmented using Mimics software (Version 24.0, Materialise) and converted into a surface mesh. The cartilage surfaces were created using SpaceClaim software (Version 2022, ANSYS Inc) by extruding a layer from the bone surface using the skin surface feature. The resulting cartilage layer was then meshed and added to the model. The mesh was refined to achieve a high-quality mesh with reasonable element aspect ratios and sizes. The final mesh contained approximately 88,000 elements and was validated through convergence testing (Figure 3).
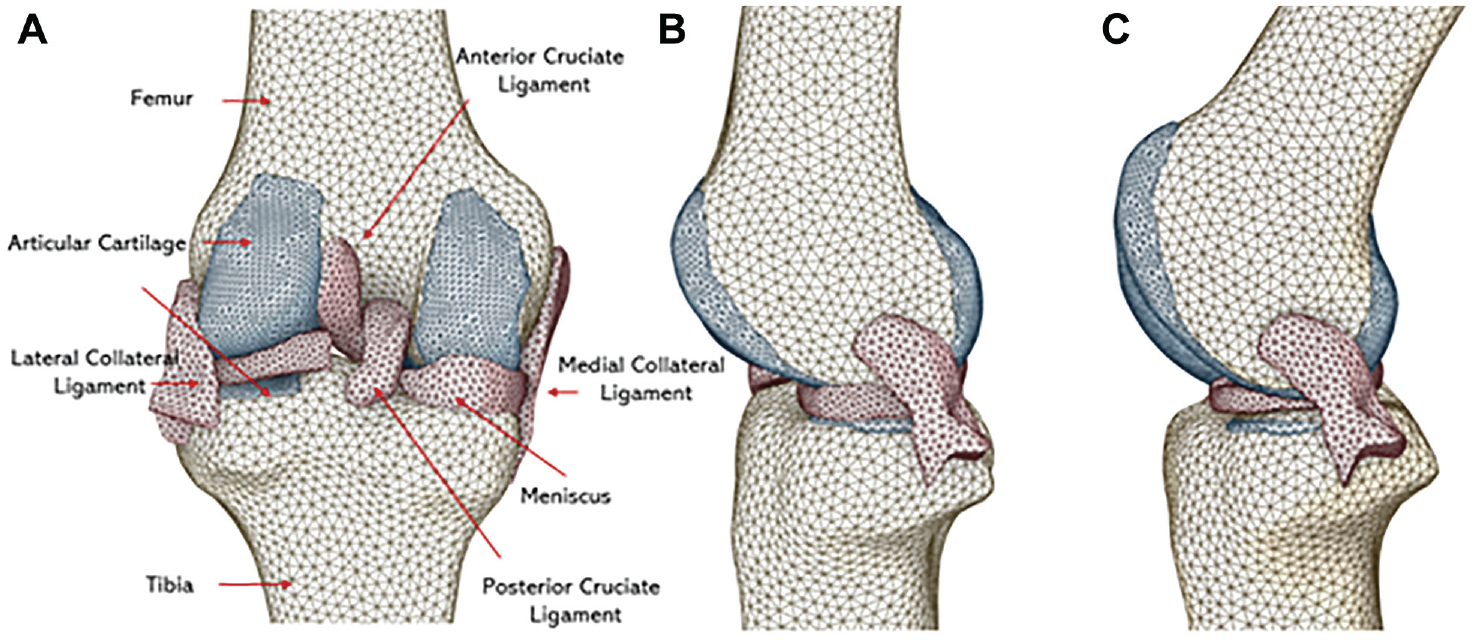
Finite-element analysis model: posterior and side view with cartilage, meniscus, ligaments, anterior cruciate ligament, and posterior cruciate ligament at full extension and flexion. (A) Posterior view of finite-element analysis mode, including cartilage, meniscus, ligaments, posterior cruciate ligament, and anterior cruciate ligament. Each component is color-coded for clarity; (B) Side view at full extension. (C) Side view at 30° of flexion.
A 3-D cylindrical defect in shape depicting the experimental size used was created for the cartilage layer using SpaceClaim software to introduce the proposed defects in the model. The sizes included 3, 5, 7, and 10 mm in diameter, respectively. The circular defects represent actual defects in the knee joint and are also more commonly observed in clinical practice. In addition, the approximate area of the circular defects was similar to that of previous rectangular defects used in previous studies and consisted of <5% of area defect sizes.
The location of the defect was determined based on the anatomic and functional considerations of the knee joint, which indicate that the anterior region of the cartilage experiences higher contact pressure during knee extension. Therefore, the defect was placed in the anterior part of the cartilage layer avoiding any disruption to proper knee kinematics, such as the weightbearing areas of the tibial plateau.
The joint was modeled with a fixed tibia, while the femur was constrained in the x and y rotational directions. The model did not include the patella consistent with the experimental tests performed on the cadaveric knees. Isotropic material properties were assigned for the bones, ligament, and cartilage in accordance with existing literature values (Table 1).
Material Properties of the Knee Model

The contact between the femoral and tibial cartilage surfaces was modeled using a penalty-based contact algorithm, with frictional force applied between the meniscal and cartilage surfaces. A sensitivity analysis assessed the accuracy of the model by varying the material properties of the bones, ligament, and cartilage. A loading condition of 600 N was applied to the femoral component during full extension and at 30° of flexion, which is consistent with the experimental data. Comparison was made between the control value and values reported in the literature obtained using a similar testing method. This enabled us to ensure consistency and relevance in our control value selection. 23
Statistical Analysis
A 1-way repeated-measures analysis of variance was performed after conducting a Shapiro-Wilk normality test to investigate the association between maximum contact pressures and defect size on both femoral condyles. Similarly, a comparative analysis was carried out to compare peak contact pressures between defects at full extension in the MFC and LFC. Finally, post hoc analysis was conducted using the Tukey honestly significant difference test.
The relationship between the location of the peak pressure points and size was evaluated using the Fisher exact test. The position of maximum pressure was categorized into medial and lateral. The MFC and LFC were compared concerning the maximum pressure location at full extension. The maximum pressure point site at full extension was also compared between the MFC or LFC. The statistical software used was IBM SPSS Statistics; Version 27.
Results
Mechanical Testing: Contact Pressures and Pressure Distribution at Full Extension
The study investigated the mean maximum contact pressures on the MFC and LFC in knee joints with different defect sizes. The mean maximum contact pressures in the MFC around the defect were 4.30 ± 1.82, 5.61 ± 1.41, 5.91 ± 1.50, and 6.91 ± 1.45 MPa at 3, 5, 7, and 10 mm, respectively. On the LFC, the mean maximum contact pressures around the defect were 3.63 ± 0.54, 4.60 ± 1.10, 5.28 ± 1.36, and 5.81 ± 1.72 MPa at 3, 5, 7, and 10 mm, respectively (Figure 4A). The findings revealed that the mean maximum contact pressures on both condyles increased with an increase in defect size. However, the increase was only significant (P = .013 for medial and P = .024 for lateral) between the smallest and largest defect sizes studied (3 and 10 mm, respectively).

Maximum contact pressure box plots for medial and lateral femoral condyles with different defect sizes. (A) Medial and lateral femoral condyles at 0° of full extension and (B) 30° of full flexion with different defect sizes (3, 5, 7, and 10 mm). The box plot displays the 25th and 75th percentiles (box), mean (horizontal line inside the box), maximum and minimum values (whiskers), and outliers (points outside the whiskers). The asterisk bar and mark indicate a significant difference between groups (P < .05).
The location of the peak contact pressure points in the MFC and LFC also shifted with an increase in defect size (Figure 5). For example, the peak contact pressure on the MFC was located posteromedially for defects between 3 and 5 mm but shifted anterolaterally for defects between 7 and 10 mm. Similarly, the peak contact pressure on the LFC turned from anterolateral to posterolateral with increased defect size.
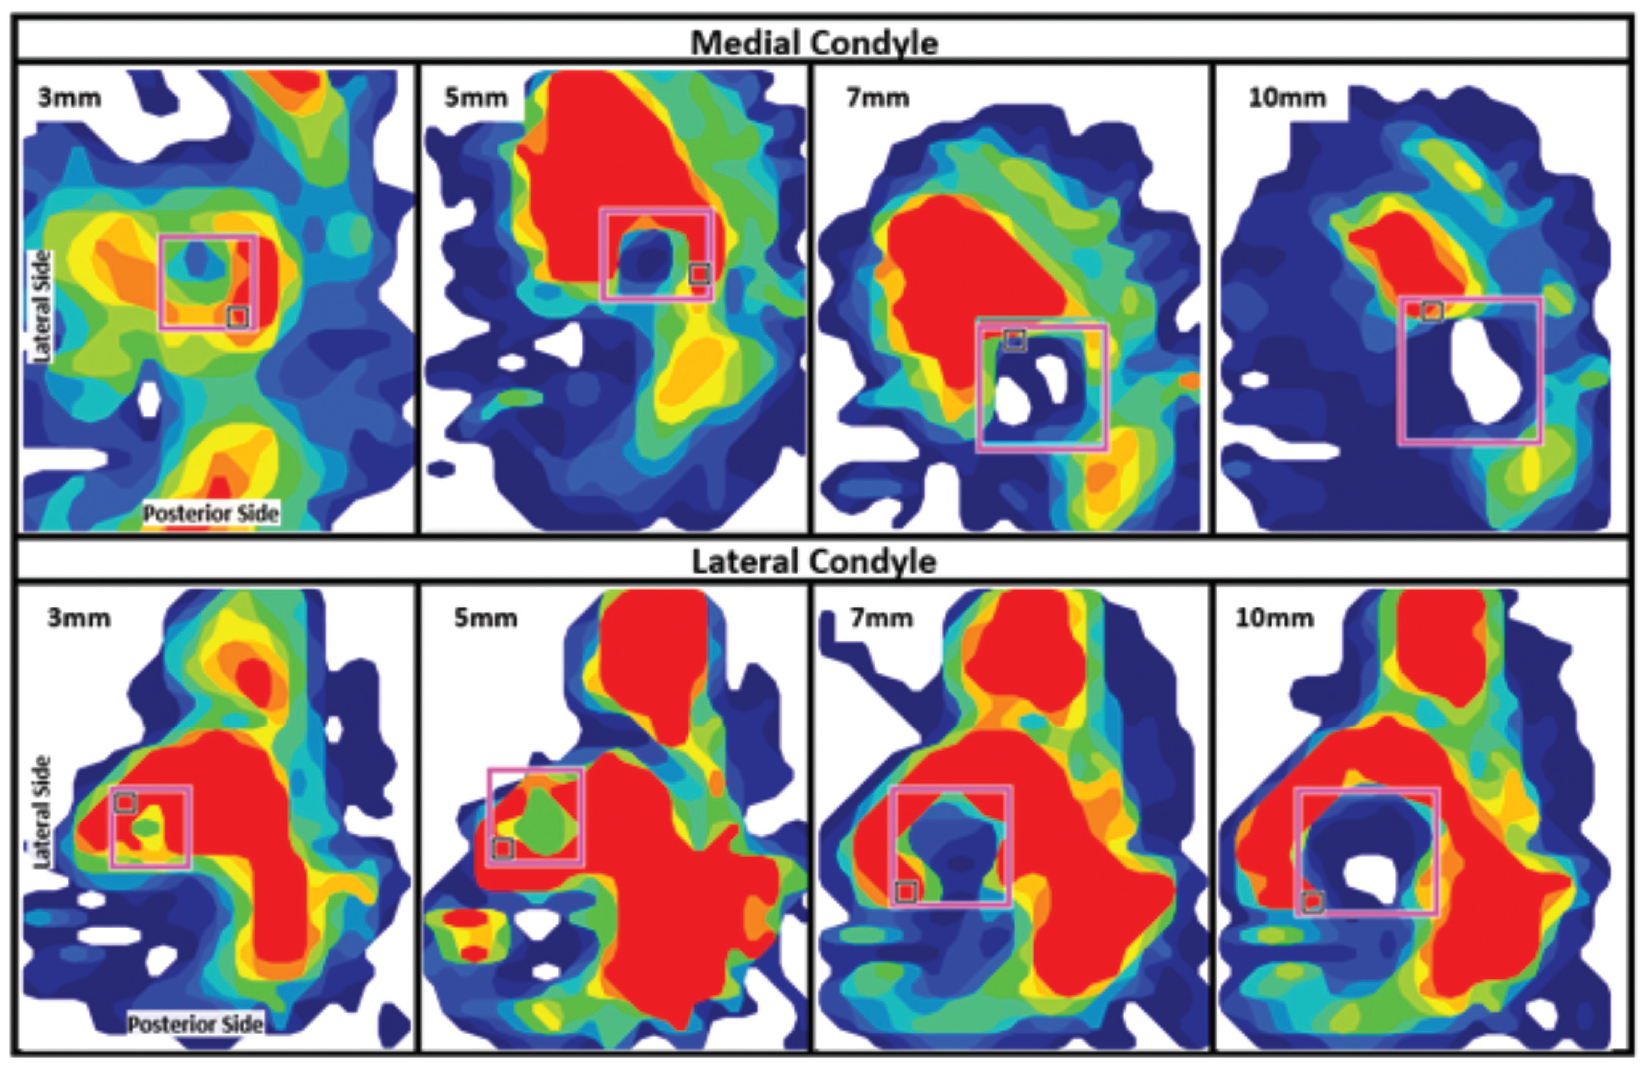
Contact pressure distribution of the knee joint measured using Tekscan sensors on the medial and lateral condyles for varying hole sizes. Pressure maps are for holes measuring 3, 5, 7, and 10 mm, with red indicating higher pressure levels. The pink box highlights the location of the drilled hole.
Despite the differences in peak contact pressure location, there were no significant differences in peak contact pressures between the MFC and LFC for any of the defect sizes studied. However, there were substantial differences in the location of the peak contact pressure points between the 2 condyles for some defective measures of 5 mm.
Mechanical Testing: Contact Pressures and Pressure Distribution at 30° of Flexion
The mean contact pressure and pressure distribution in knee joints with OCDs of varying sizes tested at 30° of flexion were examined. The results showed that the mean maximum contact pressures on the LFC increased from 4.86 ± 0.64 to 5.71 ± 0.82 MPa, and on the MFC, the pressures increased from 5.26 ± 3.27 to 5.88 ± 2.54 MPa as the defect size increased. However, there were no statistically significant differences in mean maximum contact pressures for either condyle (P = .674 for medial and P = .333 for lateral) (Figure 4B).
Furthermore, the location of the peak contact pressure point on the MFC varied with the size of the OCD and knee flexion angle. Specifically, the peak contact pressure point on the MFC was found to be posteromedial for a defect size of 3 mm and posterolateral for a defect size of 5 mm. In addition, the stress point shifted anteromedially for defect sizes between 7 and 10 mm.
FEA Validation: Contact Pressures and Pressure Distribution at Full Extension
This study evaluated the maximum contact pressure on the MFC and LFC in the presence of OCDs at full extension. The control values, representing no defects, were 1.23 MPa for MFC and 0.91 MPa for LFC. The results indicated that the maximum contact pressures on the MFC were 1.51, 1.37, 5.85, and 3.73 MPa at defect sizes of 3, 5, 7, and 10 mm, respectively. Similarly, the maximum contact pressures on the LFC were 1.24, 1.32, 1.31, and 4.06 MPa at 3, 5, 7, and 10 mm, respectively. Notably, the maximum contact pressure increased dramatically after 7 mm and remained constant with a slight decrease for both MFC and LFC (Figure 6 A and B).

A finite-element analysis contact pressure analysis for the (A) medial and (B) lateral cartilage of the femoral condyles with osteochondral defects of varying sizes (3, 5, 7, and 10 mm) at 0° and 30° of full extension and flexion, respectively of the knee joint. The pressure distribution and contact pressure magnitudes (in MPa) for each defect size and knee angle are displayed, highlighting the differences in peak contact pressure and pressure distribution patterns between the medial and lateral condyles.
Further analysis of the pressure distribution revealed that the pressure was more concentrated on the medial than the lateral side for the 5 mm defect size, resulting in higher contact pressure than the 3- and 7-mm sizes. However, the pressure distribution showed a contour map above 7 mm in defect size as the 3- and 5-mm sizes. The contact pressure varied significantly over the entire cartilage per each node, with a significant variation between 0 and 1.5 MPa, occupying approximately 20% of the total contact nodal surface (Figure 7A). Notably, the contact pressure for the intact knee, 3 mm, and 5 mm OCD defects were similar. However, the 7 mm defect size showed the highest contact pressure with the highest percentage rate of nodes affected.

Contact pressure distribution curves are shown for intact and osteochondral-defect knees at (A) 0° and (B) 30° of knee joint flexion. The x-axis indicates the contact pressure in MPa, and the y-axis indicates the percentage of femoral cartilage nodes. The curves represent different defect sizes, including 3, 5, 7, and 10 mm, and illustrate the distribution of contact pressure over the femoral cartilage.
FEA: Contact Pressures and Pressure Distribution at 30° of Flexion
The control values, representing no defects, were 1.57 MPa for MFC and 2.17 MPa for LFC. The maximum contact pressure on the MFC was 1.95, 3.13, 5.60, and 4.51 MPa for defect sizes of 3, 5, 7, and 10 mm, respectively. The maximum contact pressure on the LFC was 3.23, 4.29, 6.33, and 3.60 MPa for the same defect sizes (Figure 6). The distribution of contact pressure on the lateral side increased with increasing defect size until the 7-mm defect, after which the pressure dropped suddenly. The peak contact pressure point on the lateral side was found to be anterolateral for all defect sizes. On the medial side, the contact pressure distribution increased until the 7-mm defect and remained relatively constant for the 10-mm defect. The peak contact pressure point on the medial side was found to be anteromedial for defect sizes between 3 and 7 mm and shifted slightly posteriorly for the 10 mm defect size.
Regardless of the notable change observed at the 7 mm defect size, the overall trend showed increased contact pressure with increasing defect size, with the highest pressure observed at the 5 mm defect size. This trend is also reflected in the pressure distribution plot in Figure 7B, where the 7 mm defect size curve occupies most nodes in the 0 to 1.5 MPa range. This suggests that the 7 mm defect size may be the most critical in affecting overall contact pressure distribution on the femoral cartilage despite the highest contact pressure being observed near the hole for the 5 mm defect size.
Discussion
The significant findings of our study demonstrated the effect of different OCD sizes on the contact pressures and pressure distribution across the MFC and LFC of human knee joints, particularly at full extension. A significant change in contact pressure was observed between 3 and 10 mm for both the medial and lateral sides, with no significant changes noted at 30° of flexion angle. The results of this study may have important clinical implications for treating articular cartilage lesions in the knee joint. The findings suggest that the size and location of the OCD can significantly affect the contact pressures and pressure distribution on the MFC and LFC. More significant OCDs were associated with higher contact pressures, which can further damage cartilage and ultimately result in joint degeneration.19,30 The raised edge or lip that often accompanies OCDs can also create an uneven distribution of forces, increasing stress on the rim of the fault. This concentration of forces on the edge of the defect is due to the smaller contact area between the defect and the opposing cartilage surface, which can further exacerbate cartilage damage.
In addition, our study found that the peak contact pressure points on both the MFC and LFC shifted with an increase in defect size. For defects between 3 and 5 mm, the peak contact pressure on the MFC was located posteromedially, but it shifted anterolaterally for defects between 7 and 10 mm in a normally aligned knee. Meanwhile, the peak contact pressure on the LFC shifted from anterolateral to posterolateral with increased defect size. These results highlight the importance of considering the location of the peak contact pressure points when planning surgical interventions to repair cartilage defects. The optimal placement of implants or grafts may depend on the size and location of the defect, and careful consideration of these factors can help to optimize outcomes for patients.7,21
Controlled tests were conducted at 2 specific knee angles: 0° (representing full extension) and 30° (corresponding to partial flexion). The findings did not disclose any statistically significant disparities in pressure levels concerning varying defect sizes for the medial and lateral aspects of the knee joint at the 30° flexion angle. This intriguing observation suggests that, during partial flexion, pressure tends to concentrate in specific localized areas, resulting in a plateau effect in pressure increase across a confined surface region at particular pressure thresholds and angles. This outcome substantiates the proposition that the mechanical impact of defect size on joint pressure distribution is subject to variation contingent on the flexion angle of the knee. Although the significance of defect size may become evident in specific knee positions, such as full extension, it may attenuate or become less pronounced as the joint undergoes flexion.
Furthermore, finite-element model predictions for peak pressure values in the medial and lateral compartments ranged from 0 to 6.33 MPa with 600 N axial force. This aligns with other experimental and finite-element studies, in which corresponding contact pressures between 2.4 and 34 MPa have been reported for higher axial loads of 700 to 2000 N on simulated intact and injured or reconstructed knee joints.1,10,18,20 It is worth noting that the maximum contact pressures found in this study is in a lower range than the pressures reported in some previous studies. These findings suggest that, whereas the magnitude of the contact pressures may vary depending on the loading conditions and model parameters used in different studies, the trend of increased pressure with increasing defect size is consistent across various studies. The pressure distribution analysis in the FEA validation also revealed that the pressure was concentrated at the 5 mm defect size, resulting in higher contact pressure than the 3- and 7-mm sizes. The pressure was also concentrated more on the medial than the lateral side. However, after the 7 mm defect size, the pressure distribution showed a similar contour map as the 3- and 5-mm sizes. This result suggests that the 7 mm defect size may be the most critical in affecting overall contact pressure distribution on the femoral cartilage despite the highest contact pressure being observed near the hole for the 5-mm defect.
In terms of clinical interpretation, the findings of this study have important implications for the treatment of cartilage defects in the knee joint. The results suggest that more significant cartilage defects are associated with higher contact pressures, which can lead to further cartilage damage and joint degeneration. Therefore, early intervention is essential to prevent the progression of cartilage defects and subsequent joint degeneration. Surgical interventions such as microfracture, autologous chondrocyte implantation, and osteochondral grafting may be considered to restore the structural integrity of the cartilage and improve joint function.9,26,29 However, the optimal intervention strategy should consider the defect's size, location, alignment angle, and overall contact pressure distribution on the femoral cartilage.
Limitations
It is important to note that this study had some limitations. First, the testing was performed under static loading conditions, which may not fully represent the dynamic loading that occurs during activities of daily living. Second, utilizing cadaveric knee joints in the study, it is important to acknowledge that these specimens do not fully mimic the dynamic conditions of a living patient's knee. The constant physiological processes present in living knees, such as joint lubrication, synovial fluid production, and muscle activation, significantly influence joint mechanics in response to loading.3,17 Finally, the study focused on the effect of defect size, location, and alignment angle on contact pressures. Therefore, it did not investigate the impact of other variables that may be relevant for clinical decision-making, such as patient age, activity level, or overall joint health.
Conclusion
Our study demonstrated the influence of OCD size and location on contact pressures and pressure distribution of the femoral cartilage. The study used mechanical testing and FEA to simulate knee joint conditions under full extension and flexion. Contact pressures on the MFC and LFC increased with increasing defect size, with the increase being significant only between the smallest and largest defect sizes studied at full extension (3 and 10 mm, respectively). Furthermore, the peak contact pressure points on both condyles shifted with an increase in defect size, with the location of the peak contact pressure on the MFC shifting from posteromedial to anterolateral and the location of the peak contact pressure on the LFC moving from anterolateral to posterolateral. Alignment variations influence stress distribution based on flexion angle; notably, 30° exhibits minimal stress variation in defect size compared with 0°. Also, FEA validation results showed that the maximum contact pressures on the MFC and LFC increased with increasing defect size up to 7 mm defect size, after which the pressure either remained constant or decreased slightly. The pressure distribution from FEA was also concentrated more on the medial side than the lateral side, with a considerable variation in contact pressure between 0 and 1.5 MPa, occupying approximately 20% of the total node. Overall, the study provides valuable insights into the behavior of OCDs in the knee joint and can inform the development of more effective treatment strategies for patients with cartilage defects. Future studies could build on the findings of this study by investigating the effect of additional variables that should have been explored in this research, such as patient age, activity level, and overall joint health.
Footnotes
Final revision submitted March 23, 2024; accepted April 3, 2024.
One or more of the authors has declared the following potential conflict of interest or source of funding: J.K. has received consulting fees from Smith & Nephew, Pfizer, and Flexion Therapeutics and nonconsulting fees from Smith & Nephew. A.B. has received nonconsulting fees from Arthrex and Synthes GmbH; consulting fees from Arthrex; royalties from Arthrex; and hospitality payments from GE Healthcare. AOSSM checks author disclosures against the Open Payments Database (OPD). AOSSM has not conducted an independent investigation on the OPD and disclaims any liability or responsibility relating thereto.
Ethical approval was not sought for the present study.