
Abstract
Background:
The relationship between self-reported symptoms and the severity of patellar tendon abnormality (PTA) as seen on magnetic resonance imaging and ultrasound is unclear, but biomechanical testing may resolve this.
Purpose:
To (1) compare land-jump limb biomechanics between pre- and postseason timepoints, (2) assess whether seasonal changes in biomechanics are associated with seasonal changes in PTA and symptom severity, and (3) explore models that identify seasonal changes in PTA and symptoms with seasonal changes in biomechanics in collegiate basketball players.
Study Design:
Cohort study; Level of evidence, 2.
Methods:
Victorian Institute of Sport Assessment Scale – Patellar Tendon (VISA-P) scores and bilateral measurements from 18 National Collegiate Athletic Association Division I and II male basketball players (n = 36 limbs) at the preseason (visit 1) and postseason (visit 2) timepoints were collected. PTA was graded with ultrasound and magnetic resonance imaging morphology measurements proximally and distally, and 3-dimensional lower extremity sagittal kinematics and kinetics were measured during a land-jump test. Multivariate and chi-square analyses assessed timepoint differences. The association of seasonal (Δ = visit 2 - visit 1) biomechanics with seasonal morphology (ΔPTA: no change/worsened) and symptoms (ΔVISA-P: improved/no change/worsened) was tested with multivariate models. Logistic regressions modeled the accuracy of seasonal biomechanics to classify seasonal PTA and symptoms.
Results:
Three athletes (6 limbs) at visit 1 and 2 athletes (4 limbs) at visit 2 were symptomatic. VISA-P scores were not significantly different between preseason and postseason. Regarding PTA, multivariate analyses found differences among grouped ground-reaction force variables (P < .05); univariate analyses found that worsened PTA was associated with seasonal decreases in peak vertical jumping force and with seasonal increases in knee flexion velocity at contact and maximum knee flexion velocity (P < .05 for all). Regarding VISA-P scores, multivariate analyses found differences among grouped hip (P < .01) and ankle (P < .05) kinematic variables; univariate analyses found that worsened VISA-P was associated with seasonal increases in hip (P < .01) and knee (P < .01) flexion velocity at contact and seasonal increases in ankle range of motion (P < .05).
Conclusion:
The findings demonstrated an association between seasonal changes in dynamic lower extremity biomechanics and seasonal changes in patellar tendon imaging signals as well as self-reported symptoms.
Jumping athletes are prone to the development of patellar tendinopathy (PT). The physical demands of high-level competitive basketball are considerable, and they place high demand on the knee extensors, specifically the patellar tendon. The condition is twice as prevalent in male as compared with female athletes and can cause significant disability.4,13 Decreased athletic performance has been reported with PT, and 30% of affected athletes spend up to 6 months recovering before returning to play. 21 Between 24% and 39% of collegiate and professional players are reported to have had patellar tendinosis,14,29 and it is the top reason for games missed—up to 18%—during a professional season. 4 Collegiate athletes are expected to be similarly affected, but research to link structural and functional measurements is lacking in this population.
Components of basketball play such as shooting, rebounding, and other offensive and defensive maneuvers require repetitive jumping and landing. High tensile quadriceps loads are borne by the patellar tendon to transfer force and torque across the knee joint as well as dissipate kinetic energy. 2 Large forces are focused through the patellar tendon, and thus, the tendon bears high repetitive stress. Chronic overloading of the patellar tendon leads to tissue microdamage, and without adequate recovery time, damage can accumulate, leading to PT.
Early diagnosis of PT is important for effective treatment. 3 However, it can be difficult to identify at-risk players using subjective metrics alone. Published findings have reported that symptomatology and pathophysiology patterns are not associated accurately with clinical imaging techniques like ultrasound and magnetic resonance imaging (MRI), and subjective tools like the Victorian Institute of Sport Assessment – Patellar Tendon (VISA-P). 27 PT is common in the preseason, and its severity is known to increase over a season of play, 17 even in asymptomatic knees.
Dynamic biomechanical variables may also prove to help guide management of PT. Development of PT is widely thought to be linked with dynamic functional movements that challenge the lower extremity stabilizers and patellar knee extensors—jumping and landing. During both motions, the entire quadriceps load is focused into the patellar tendon to counteract the knee flexion ground-reaction force. Over the past 2 decades, scientific efforts have aimed to identify functional 3-dimensional (3D) biomechanical variables that are associated with PT in jumping sports. Two recent systematic reviews by Harris et al 9 and Tayfur et al 25 reviewed relevant cross-sectional and prospective studies. Generally, these 2 reviews did not examine the same studies nor did they discuss the same associated factors; they thus reached dissimilar conclusions and recommendations to identify variables for future study. In summary, both reviews found no strong evidence for any single variable and its association with PT.9,25
The underlying structural changes in PT and related symptoms are believed to be linked to changes in dynamic function and vice versa; however, evidence of this structure-function link is lacking. This limits early diagnosis, which is important for effective treatment. Ultimately, we seek prognostic models that target PT because they have the potential to improve intervention efficacy, better inform individual prognoses, guide decisions on returntoplay, and ultimately reduce lost playing time and improve player health. Subsequently, these data could serve as tools to identify at-risk athletes for early targeted intervention and new insights into interventional movement strategies modifiable through treatment and training regimens, benefiting jumping athletes. To date, there are no longitudinal studies that measure and associate both dynamic movement variables with structural patellar tendon changes.
Our overarching goal for this study was a better understanding of PT by discovering prognostic functional quantitative metrics for longitudinal evaluation of disease progression. We focused on changes in lower extremity biomechanical metrics across a season of play in male collegiate basketball players and concomitant changes in patellar tendon abnormality (PTA) confirmed on imaging and clinical symptoms through VISA-P. Our primary research aims were as follows:
Aim 1: To compare land-jump biomechanics, symptoms, and PTA variables between preseason and postseason timepoints. We hypothesized that most biomechanical variables would not be different between timepoints.
Aim 2: To test the association of seasonal change in PTA and symptoms with seasonal change in biomechanical measurements. We hypothesized there would be a significant association between seasonal changes in PTA, symptoms, and biomechanics.
Aim 3: To explore regression models that classify seasonal change in patellar tendon morphology on imaging and symptoms with land-jump biomechanical measurements. No hypothesis was made.
Methods
This was a prospective cohort study carried out at preseason and postseason timepoints. The target sample size was 40 participants. We employed MRI and ultrasound measurements to identify PTA and VISA-P to identify symptoms. We then quantified function with lower extremity kinematics and kinetics during a land-jump test with a focus on the sagittal plane of movement and vertical forces.
Participant Recruitment
This study received ethical approval from our institutional review board. Local-area National Collegiate Athletic Association (NCAA) Division I and II collegiate healthy male basketball players were recruited through their team coaches or athletic medical staff. Players were excluded if they had previous surgery involving the knee, previous injection of the knee extensor mechanism, history of diabetes, history of a connective tissue disorder, or current pathology affecting the ability to jump or land. Athletes provided written informed consent. Participant data were collected at preseason (visit 1) and postseason (visit 2) timepoints.
Clinical Assessment: VISA-P and Exposure
VISA-P questionnaires were administered by study staff at the time of each visit. Exposure, defined as playing time during the season, was collected from each team's institution website. Demographic information was collected at the time of visit.
Clinical Imaging Measurements
A fellowship-trained, expert board-certified musculoskeletal radiologist (O.K.N.) with >9 years of clinical experience performed all MRI and ultrasound measurements.
Magnetic Resonance Imaging
Bilateral 2-dimensional multiplanar fast-spin echo MRI sequences were utilized for clinical morphologic MRI evaluation of the tendon using a 3.0-T MRI scanner (DV 750, GE Healthcare) and an 8-channel phased array knee coil (echo time, 25 ms; repetition time, 4000 ms; number of excitations, 2; receiver bandwidth, ±62.5 kHz; field of view, 14-16 cm; slice thickness, 3.5 mm; matrix, 512 × 384 mm). The imaging physician reviewing the MRI data, who was an independent experienced attending radiologist, was blinded to the ultrasound evaluation.
Ultrasound
Bilateral morphologic ultrasound measurements were obtained. Each subject was placed in a supine position with a wedge immobilizer under the evaluated knee to maintain a constant 20° of knee flexion (Figure 1A) as per the American Institute of Ultrasound in Medicine and the American College of Radiology recommendations. ultrasound evaluations used a 9-MHz transducer on a LOGIQ E9 ultrasound system (GE Healthcare). The imaging physician (O.K.N.) reviewing the ultrasound data was blinded to the MRI evaluation.

Imaging measurements. (A) Illustration of subject in supine position for magnetic resonance imaging (MRI) and ultrasound (shown) measurements. (B) Sagittal MRI scans of knees representing each morphology grades 0 to 3 in the proximal tendon region. (C) Ultrasound images of knees representing each morphology grades 0 to 3 in the proximal tendon region. Arrows indicate area of patellar tendon degeneration. Tendon is inside the areas outlined by red dashes. (D) Illustration of the knee joint showing major structures and proximal (PROX), middle (MID), and distal (DIST) regions of the patellar tendon.
Imaging Variables
Morphologic PTA measurements were taken in a region-specific manner and graded using a 4-point qualitative scale: 0 (normal), 1 (<33%; mild), 2 (33%-67%; moderate), and 3 (>67%; severe). Proximal and distal regions were assessed (Figure 1B). For ultrasound, grading was based was on the percentage of abnormal tendon echogenicity and morphology (including fissuring, thickening, and tearing). For MRI, the radiologist graded PT based on the percentage volume of abnormal signal on axial moderate echo-time acquisitions.
Dynamic Land-Jump Measurements
Testing Protocol and Environment
A box-to-ground-to-box jump (land-jump) task was performed in an instrumented motion analysis laboratory. The land-jump task consisted of jumping forward and down from a wooden box, landing on force plates, and then immediately jumping up to a platform in front (Figure 2). Two 40 × 60 cm force plates (Bertec) were aligned in parallel 60 cm apart with respect to each plate's long axis. An 18-inch (45.7 cm) tall × 12-inch wide (30.5 cm) × 18-inch (45.7 cm) long wooden exercise box was aligned centrally with the force plates, and its closest edge was positioned 20 inches (50.8 cm) from the middle short axes of the plates. An 18-inch (45.7 cm) tall × 36-inch (91.4 cm) long × 36-inch (91.4 cm) wide platform was aligned centrally; its closest edge was positioned 20 inches (50.8 cm) horizontally from the middle short axes of the plates.

Physical dimensions and arrangement of the land-jump test. (A) Illustration of the dynamic land-jump task at initial contact, midlanding, and final contact, with platform and force plate objects drawn to scale. The platform h was 18 inches (45.7 cm). The red arrow depicts a ground-reaction force vector. (B) A diagram from a top-down perspective of the physical arrangement for the wooden box, force plates, and staging platform; the foot placement depicted as dashed lines is approximate. (C) A frame from the 3-dimensional motion reconstruction program (Visual3D, Version 6; C-Motion) showing the virtual world and rigid-body model near the ML event along with blue ground-reaction force vector arrows. Note: the 2 adjacent force platforms in the immediate background were not used. IC, initial contact; ML, midlanding; FC, final contact; h, height.
Double-sided adhesive tape was used to affix 10-mm-diameter retroreflective motion capture markers to the skin over bony landmarks, based on International Society of Biomechanics anatomic coordinate frame recommendations. 33 In addition, 4-marker clusters with a rigid plastic base were attached over skin to thigh and shank segments distally with elastic wrap (Coban, 3M).
Subjects were instructed to perform the land-jump in a continuous motion without pausing during the landing and while trying to maintain their foot position within the bounds of the respective force plates. Each athlete was allowed several practice repetitions to familiarize himself with the task and ensure all concerns were addressed. Before the first jump, athletes were asked to carefully mount and stand on the wooden box and wait for a verbal cue to proceed. A short static trial was recorded with the subject standing in a T-pose with arms extended and abducted to 90° and feet hip-width apart. After that, 10 land-jumps per athlete were recorded for analysis.
A 12-camera optical motion capture system (Motion Analysis) calibrated with 0.4-mm residual errors was used to record each test. Marker positions were recorded at 200 frames per second, and limb ground-reaction loads were synchronized and recorded at 1000 frames per second.
Motion Data Processing
Marker identification and tracking was performed with commercial software (Cortex Version 7, Motion Analysis). Signal processing, model building, and 3D motion reconstruction were performed with commercial software (Visual3D Version 6, C-Motion). Marker trajectories were low-pass filtered with a fourth-order zero-lag Butterworth algorithm at a 15.0-Hz cutoff. Subject-scaled rigid-body models were built from static trial marker data with assumed prismatic joints at the hip (ball-and-socket), knee (saddle), and ankle (ball-and-socket). Default segment tracking weight factors for the pelvis, thighs, shanks, and feet were 5.0, 2.0, 3.0, and 5.0, respectively. Inverse kinematics employed a quasi-Newton optimization with simulated annealing to solve a least-squares global model pose at each frame. Then, additional low-pass Butterworth filters smoothed noise introduced by the pose optimization: pelvis (8.0 Hz), thighs (8.0 Hz), shank (8.0 Hz), and feet (10.0 Hz). Mean pose tracking residual error was kept <3.0 cm, and segment weight factors were adjusted occasionally to meet this criterion. Body mass was measured with force plates and kinetic signals were normalized to either body mass (kg) or body weight (%BW). The first and last trials were excluded, as well as any outliers based on visual analysis of the vertical ground-reaction forces (VGRFs). Excluded trials were those where 1 or both of the athlete's feet landed off a force plate seen as a grossly underestimated or misaligned force signal, or the investigator suspected a pause seen as a clear “double-hump” pattern in the vertical force signal. Between 5 and 8 trials were averaged for analysis.
A total of 31 variables (26 biomechanical, 4 MRI scans and ultrasound images, and VISA-P) were considered and are listed in Appendix Table A1. All biomechanical variables were calculated during ground contact, defined as the point at which the total (whole body) VGRF exceeded 10 N. The land-jump was split into 2 phases: landing and jumping. Landing was defined as the time from initial contact (IC) to the moment of lowest pelvis vertical height, and jumping was defined as rest of the time to final contact. The initial peak VGRF (IP-VGRF) event was defined as the largest local maxima during the landing phase and was calculated per limb.
Statistical Analysis
Biomechanical variables were averaged across trials to represent each participant; each participant had 2 limb observations per variable; all limbs were treated as independent observations.
Aim 1: Comparison of Imaging, Symptoms, and Biomechanics Between Visits 1 and 2
Demographics including age, height, weight, and body mass index (BMI) were presented descriptively, including a breakdown of participants by year in college and playing position. Multivariate analysis of variance (MANOVA) models assessed the effects of time and dominance on biomechanical variables. The data were structured as a 2 within-subjects factors repeated-measures analysis fit to 3 terms: time, dominance, and the interaction of time × dominance. Hotelling T2 test was used to test the differences of each effect.
The ultrasound and MRI grade values were condensed into 2 categories: absence of PTA (grade 0) and presence of PTA (grade ≥1). Counts of PTA per timepoint were entered into 2 × 2 contingency tables and assessed with chi-square tests for independence; separately, dependency of PTA on limb dominance was assessed at each timepoint. Timepoint differences in VISA-P and BMI were assessed with 2-tailed paired t tests.
Aim 2: Association of ΔPTA and ΔVISA-P With ΔBiomechanics
The seasonal change (Δ[Visit 2 - Visit 1]) of all variables was analyzed. MANOVA models were used to test the effect of ΔPTA and ΔVISA-P on grouped dependent seasonal biomechanical variables. The ΔVISA-P categories were duplicated for corresponding bilateral measurements. Separate 1-way MANOVA models were fit using separate groups of dependent variables from the hip, knee, and ankle: flexion range of motion (ROM), flexion at IC, flexion velocity at IC, maximum flexion velocity, and flexion velocity at peak VGRF. In addition, knee flexion kinetics and ground-reaction kinetics were tested.
Aim 3: Classifying ΔPTA and ΔVISA-P With ΔBiomechanics
Logistic regression with proportional odds classified ΔPTA and ΔVISA-P categories with seasonal biomechanical variables and quantified each variable's associated risk. Odds ratios were expressed with respect to the healthier category and interpreted in the direction of worsened PTA and VISA-P. Not including the intercept term, which was always present, the maximum number of independent variables fit was 10 per observation. 18 All combinations of regression models with k variables from the pool of 31 biomechanical variables were fit. Classification accuracy (%) and modified Akaike Information Criterion (AICc) were recorded for each. 24 The best model considered high overall accuracy, high worsened accuracy, and parsimony with low AICc values. Classification accuracy was judged as poor (0%-40%), moderate (41%-65%), good (66%-85%), or excellent (86%-100%).
The robustness of the regression models was assessed with a bootstrap procedure. Bootstrapping was performed by resampling the regression coefficients with an iterative leave-N-subjects-out procedure. Per iteration, approximately 20% of limb observations were excluded where both of a subject's limbs were removed (no single-limb removal per subject). This sampling procedure produced estimates for each predictor's median odds ratio and 95% percentile-based confidence intervals as well as overall accuracy.
The aim 1 and aim 2 MANOVAs were implemented with the Real Statistics Resource Pack software for Microsoft Excel, 34 and aim 3 regressions were performed in MATLAB with the Statistics and Machine Learning Toolbox (version 2023a, MathWorks). Statistical significance was set at P < .05 without adjustment for multiple comparisons.
Results
A total of 26 male NCAA collegiate basketball players were recruited and enrolled from 3 different northeast coast collegiate teams from 2016 to 2019. Players were consented and tested during visit 1, which ranged from August to October, and visit 2, which ranged from March to April. The length of follow-up was 179 ± 26 days. During visit 1, after completing the land-jump protocol, 1 athlete declined further testing. At visit 2, data collection planned for 7 athletes from a single team in spring 2020 was cancelled in the wake of the COVID-19 pandemic. Thus, data from 18 male collegiate basketball players were measured prospectively, as shown in the flowchart in Figure 3; 7 players were from NCAA Division I and 11 from Division II. A total of 36 bilateral limb observations were used in the analyses, with a mean of 5 to 8 trials for each athlete.

STROBE flowchart of the patient-inclusion process.
Timepoint Comparisons
Table 1 shows the characteristics of the study cohort according to timepoint (visits 1 and 2). Mean VISA-P scores (N = 18) increased from visit 1 (90.3 ± 10.4) to visit 2 (92.5 ± 10.3) by 1.9 ± 8.1 points; this change was not statistically significant. At visit 1, 3 players were considered symptomatic (scores: 72, 72, and 76) based on a threshold score of 805,8,15,32; 2 of these players remained symptomatic at visit 2 with worse VISA-P scores, and 1 became asymptomatic with an improved VISA-P (scores: 84, 70, and 65, respectively). BMI was not significantly different between timepoints (P = .310). Limb severity grade was distributed unevenly at both timepoints, see Table 2, the ensemble grade distribution being: 0 (178 limbs; 61.0%), 1 (70 limbs; 24.0%), 2 (30 limbs; 10.3%), and 3 (14 limbs; 4.8%). We found that UltrasoundDist had the largest proportion of limbs with PTA at visit 2 compared with visit 1, but this was not statistically significant; the other PTA outcome odds ratios were also not significant (Table 3). Chi-square tests found no evidence of dependency between limb dominance and PTA (Table 4).
Characteristics of the Study Cohort at Visit 1 and Visit 2, Stratified by Presence of PTA a

Data are presented as mean ± SD or No. of participants unless otherwise indicated. BMI, body mass index; PTA, patellar tendon abnormality; VISA-P, Victorian Institute of Sport Assessment – Patellar Tendon.
PTA was defined as the mean morphology grade across magnetic resonance imaging and ultrasound imaging variables using a 4-point qualitative scale: 0 (normal), 1 (<33%; mild), 2 (33%-67%; moderate), and 3 (>67%; severe), rounded to the nearest whole number. No PTA was indicated by grade of 0, PTA was indicated by a grade of ≥1.
Data are presented as mean ± SD (median; range) for VISA-P and exposure.
PTA Grades Stratified by Limb Dominance for Each Ultrasound and MRI Region at Visits 1 and 2 a

Data are presented as No. of limbs. D, dominant; Dist, distal; MRI, magnetic resonance imaging; ND, nondominant; Prox, proximal; PTA, patellar tendon abnormality.
Contingency Table of Limb Counts for PTA and Timepoint a

Data are presented as No. of limbs unless otherwise indicated. No PTA was indicated by grade of 0, PTA was indicated by a grade of ≥1. CI, confidence interval; Dist, distal; MRI, magnetic resonance imaging; OR, odds ratio; Prox, proximal; PTA, patellar tendon abnormality.
Contingency Table of Limb Counts for PTA and Limb Dominance a

Data are presented as No. of limbs unless otherwise indicated. No PTA was indicated by grade of 0, PTA was indicated by a grade of ≥1. CI, confidence interval; D, dominant; Dist, distal; MRI, magnetic resonance imaging; ND, nondominant; OR, odds ratio; Prox, proximal; PTA, patellar tendon abnormality.
Table 5 shows the repeated-measures results. No biomechanical variables were significantly different with respect to time. Limb dominance had a significant effect on 4 kinetic and 2 kinematic variables. Maximum landing VGRF was decreased in dominant limbs (P < .05) as was knee flexion impulse (P < .05), peak knee extension torque (P < .01), and maximum eccentric knee power (P < .01). Hip flexion at IC and hip flexion at IP-VGRF were decreased in nondominant limbs (P < .05). A significant interaction was observed for ankle flexion at IC (P < .05) and maximum ankle flexion (P < .05).
Biomechanical Measurements Compared According to Timepoint and Limb Dominance a
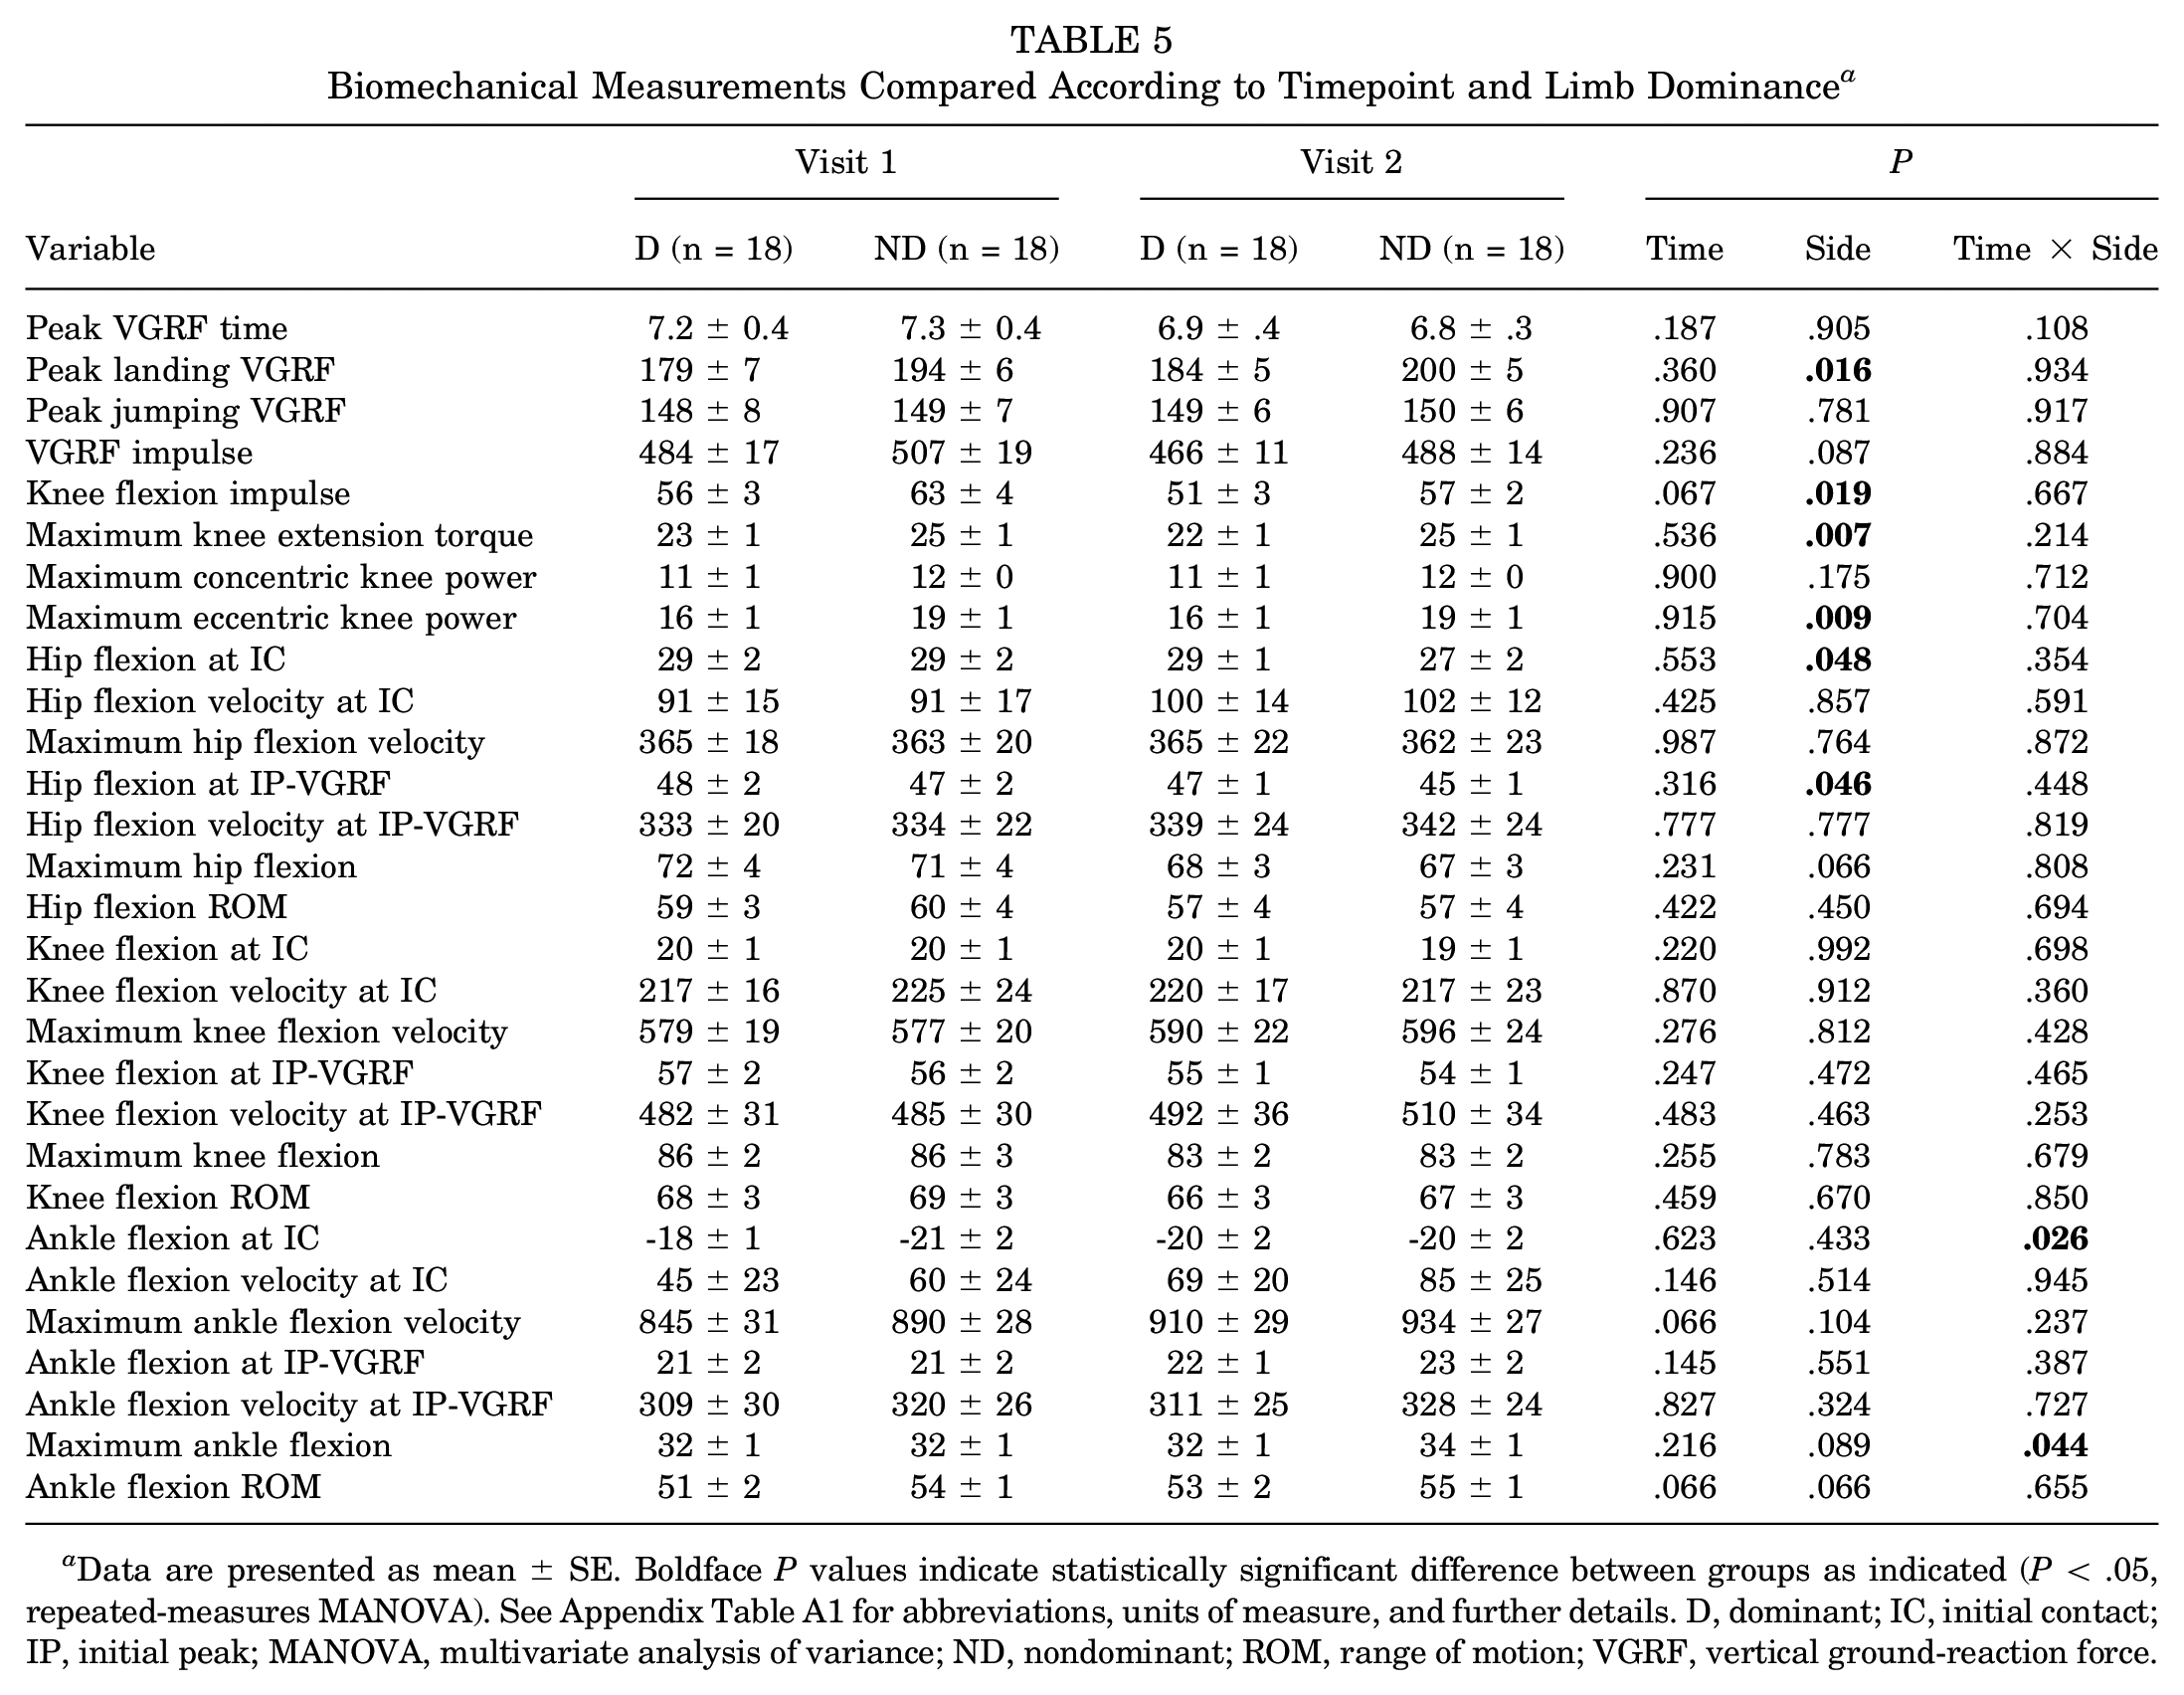
Data are presented as mean ± SE. Boldface P values indicate statistically significant difference between groups as indicated (P < .05, repeated-measures MANOVA). See Appendix Table A1 for abbreviations, units of measure, and further details. D, dominant; IC, initial contact; IP, initial peak; MANOVA, multivariate analysis of variance; ND, nondominant; ROM, range of motion; VGRF, vertical ground-reaction force.
Association Between ΔPTA, ΔVISA-P, and ΔBiomechanics
Regarding VISA-P, scores decreased for 5 players (visit 1: 89 ± 12 [median, 95; range, 76-100]; visit 2: 82 ± 13 [median, 90; range, 65-94]; Δ: -8 ± 3 [median, -6; range, -5 to -11]), 8 increased (visit 1: 88 ± 7 [median, 88.5; range, 3-18]; visit 2: 97 ± 6 [median, 100; range, 84-100]; Δ: 9 ± 6 [median, 10; range, 1-18]), and 5 did not change (visit 1 = visit 2: 96 ± 5 [median, 100; range, 90-100]). The ΔVISA-P scores were transformed into an ordered categorical variable: worsened (10 limbs), no change (10 limbs), and improved (16 limbs).
Seasonal change in MRI scans and ultrasound grade was such that players exhibited either no change or worsened grade across the season. The following codes (eg, “8D”) indicate a specific player number and limb (dominant [D], nondominant [ND]): MRIProx worsened by +1 in 2 limbs (8D, 18ND); MRIDist worsened by +2 in 2 limbs (8D, 8ND); ultrasoundProx worsened by +1 in 4 limbs (8D, 8ND, 12ND, 18ND); ultrasoundDist worsened by +1 in 8 limbs (2ND, 5ND, 6D, 6ND, 8D, 13ND, 14D, 15D) and by +2 in 1 limb (8ND); the ensemble seasonal grade distribution was 0 (88.2%), +1 (9.7%), +2 (2.1%), and +3 (0.0%). Worsened group sizes were considered too small for ΔMRI(Prox), ΔMRI(Dist), and Δultrasound(Prox), and these variables were excluded from further analysis. Therefore, seasonal PTA was based on Δultrasound(Dist) grade measurements and condensed into 2 categories: no change (Δultrasound(Dist) = 0) and worsened (Δultrasound(Dist)≥1). MANOVA models assessed the association of seasonal biomechanics on Δultrasound(Dist) and ΔVISA-P variables. Limb dominance was initially included as a factor, but the effect was not significant (P ≥ .8) across all models so it was excluded. See Table 6 for main findings and Appendix Tables A2 and A3 for extended results.
Results of Significant Associations Between Seasonal Biomechanics, PTA, and Symptoms a
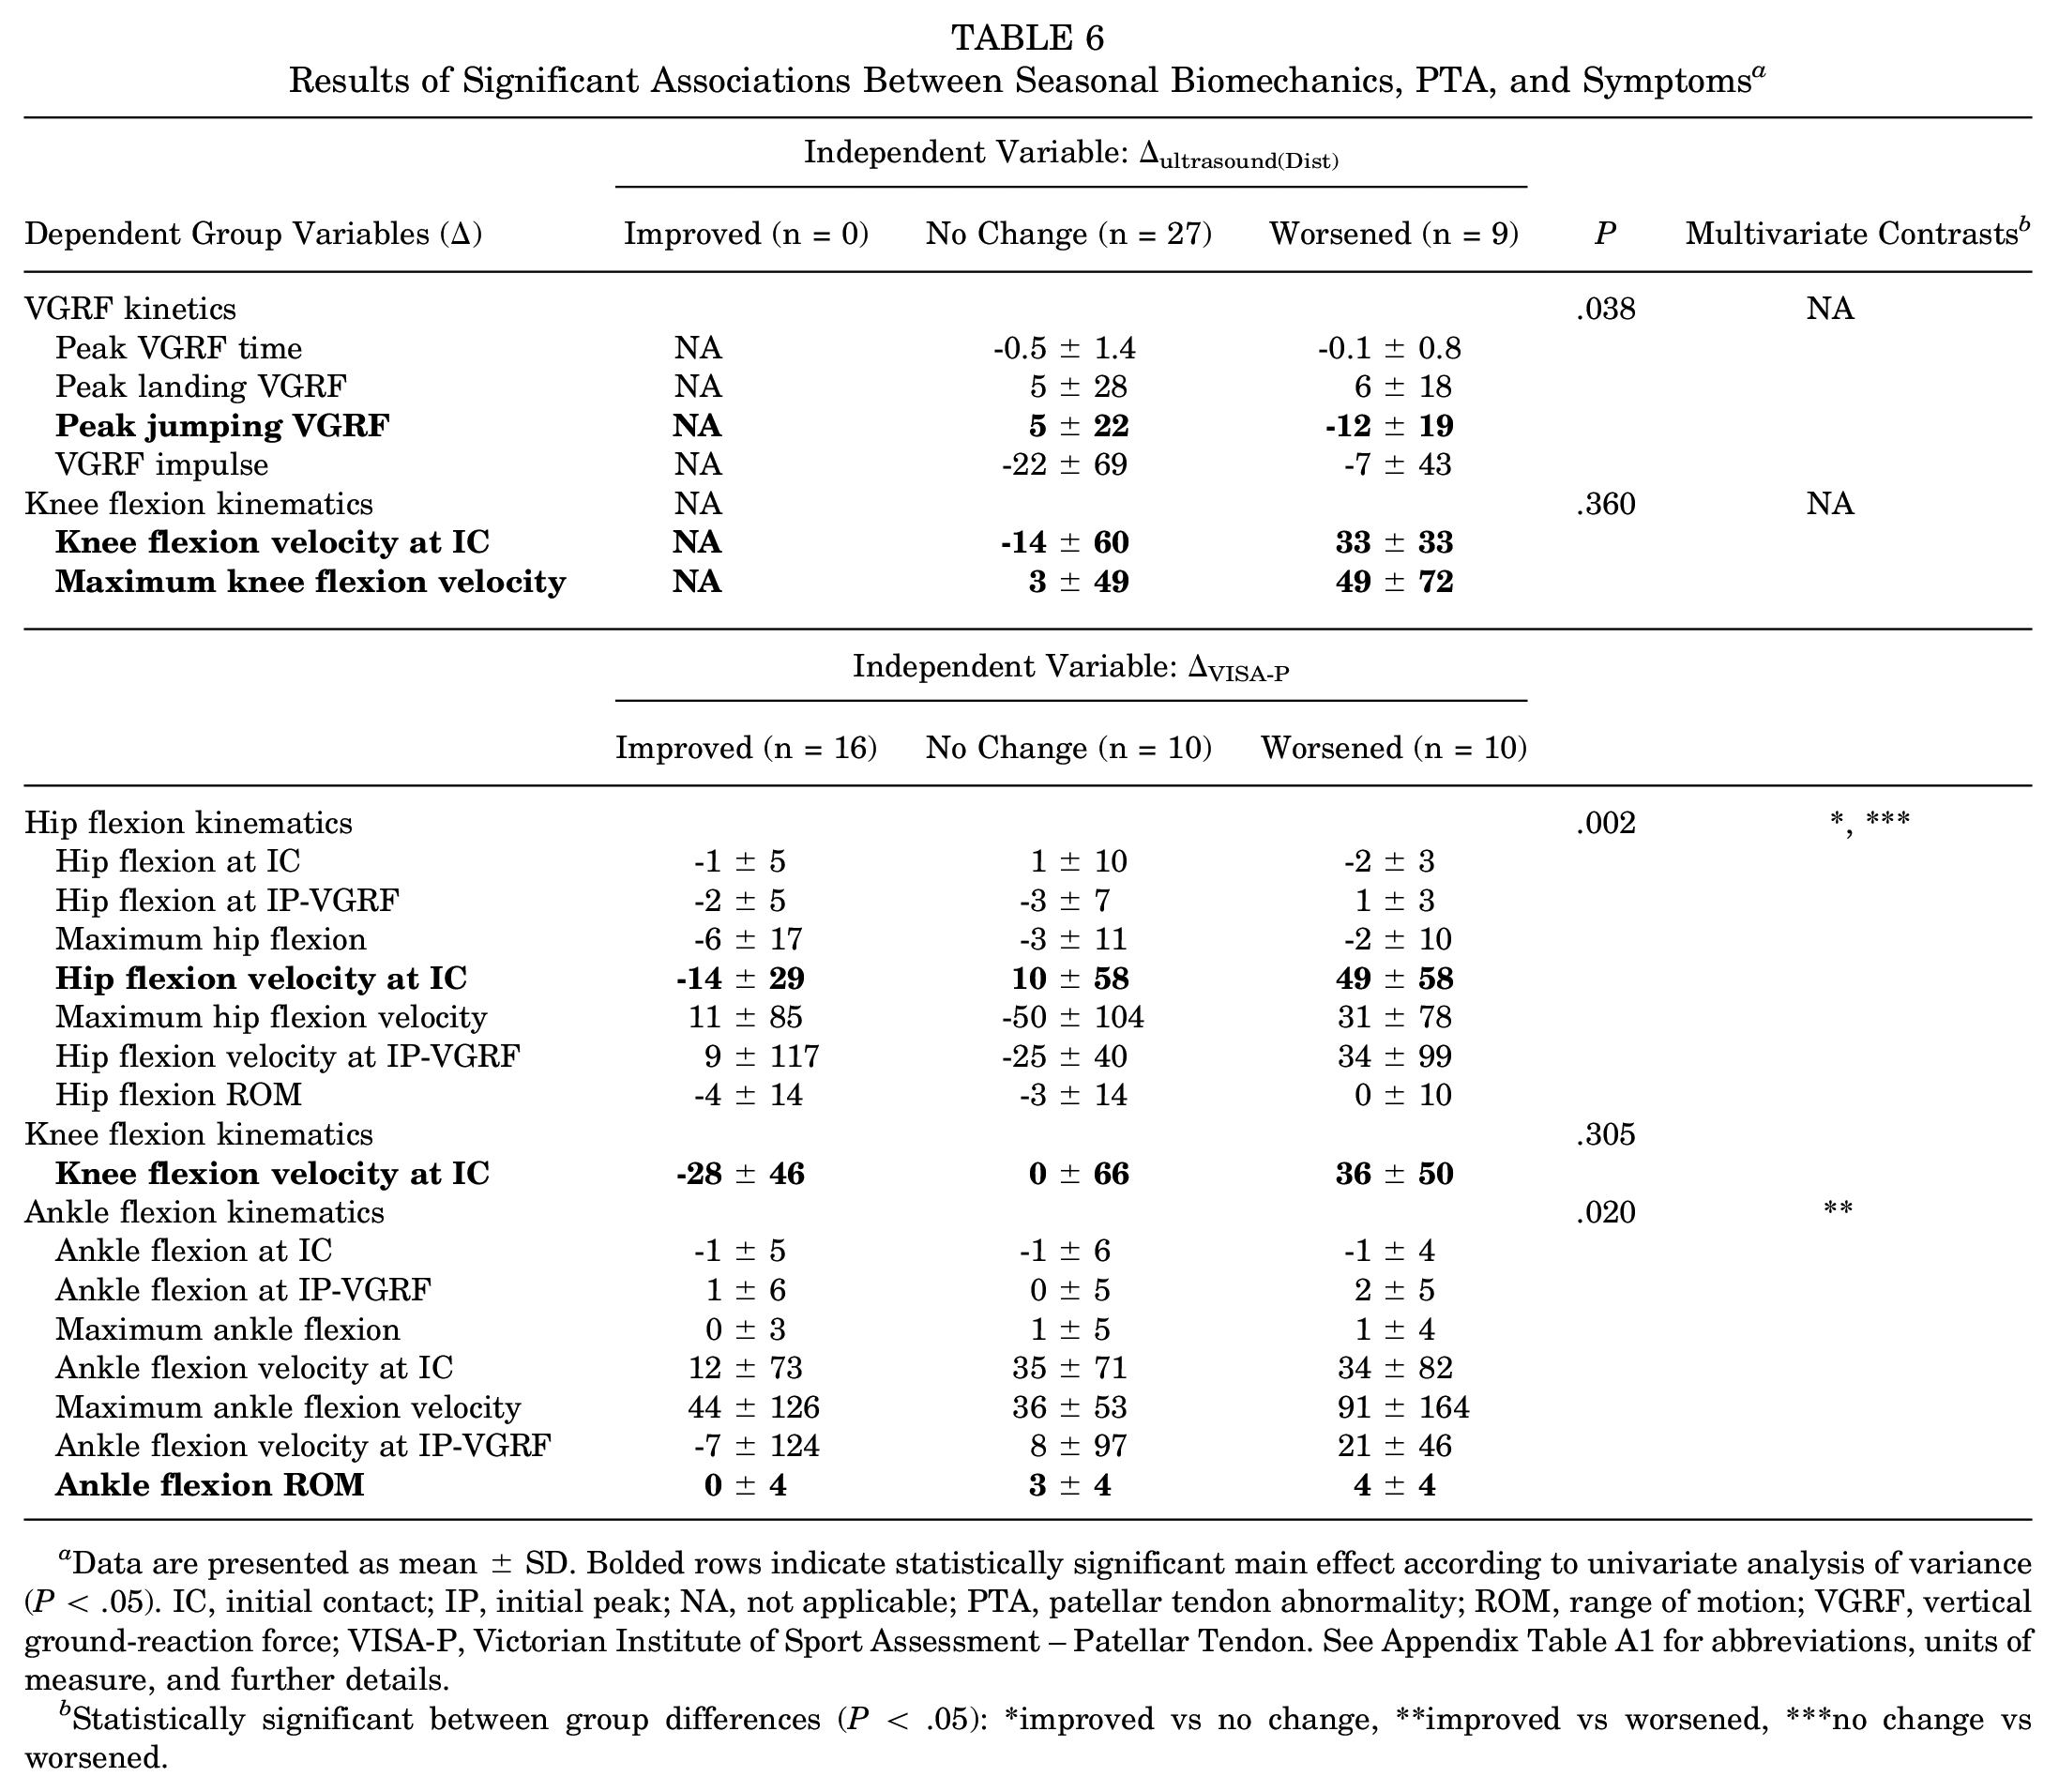
Data are presented as mean ± SD. Bolded rows indicate statistically significant main effect according to univariate analysis of variance (P < .05). IC, initial contact; IP, initial peak; NA, not applicable; PTA, patellar tendon abnormality; ROM, range of motion; VGRF, vertical ground-reaction force; VISA-P, Victorian Institute of Sport Assessment – Patellar Tendon. See Appendix Table A1 for abbreviations, units of measure, and further details.
Statistically significant between group differences (P < .05): *improved vs no change, **improved vs worsened, ***no change vs worsened.
We observed a significant main effect of Δultrasound(Dist) on seasonal kinetics variables (P < .05, MANOVA), where maximum jumping VGRF decreased seasonally in worsened limbs compared with improved limbs (P < .05, analysis of variance [ANOVA]), which increased. In addition, seasonal changes in knee flexion velocity at IC (P < .05, ANOVA) and maximum knee flexion velocity (P < .05, ANOVA) were significantly greater in worsened limbs. The multivariate test of the seasonal knee flexion kinematics group was not significant.
We observed a significant main effect of ΔVISA-P on seasonal hip flexion kinematics variables (P < .01, MANOVA); significant multivariate contrasts were observed between improved limbs and limbs with no change (P < .05) and between worsened limbs and limbs with no change (P < .01); ΔHip Flexion Velocity at IC was significantly different (P < .01, ANOVA) among groups, specifically, improved limbs showed a mean seasonal change of -14° deg/s compared with worsened limbs (P < .01), which showed a seasonal change of 49 deg/s. Seasonal knee flexion velocity at IC was significantly different among ΔVISA-P categories (P < .05, ANOVA); we found a significant difference (P < .01) between improved and worsened limbs that on average seasonally decreased and increased, respectively; the multivariate test of the seasonal knee flexion kinematics group was not significant. We observed a significant main effect of ΔVISA-P on seasonal ankle flexion kinematics variables (P < .05, MANOVA); significant multivariate contrasts were observed between improved limbs and limbs with no change (P < .01); ΔAnkle Flexion ROM was significantly different (P < .05, ANOVA), specifically improved limbs showed no mean seasonal change compared with worsened limbs (P < .05) which increased seasonally by 4°.
Classifying ΔPTA and ΔSymptoms With ΔBiomechanics
The Δultrasound(Dist) variable was treated as a binomial nominal dependent (no change, worsened) and the ΔVISA-P variable was treated as a multinomial ordinal dependent (improved, no change, worsened). A sample size of 36 indicated a maximum of 3 predictors, and, of 29 biomechanical variables, a total of 3654 different models were fit to Δultrasound(Dist) and ΔVISA-P separately. Models were bootstrapped by resampling 3060 times (Table 7). For a given variable, regression parameters were calculated as the odds of observing worsened PTA or worsened VISA-P with respect to an increase in that variable.
Results of Logistic Regressions a

Both 3-variable models were selected based on both low AICc and high accuracy. AICc, modified Akaike information criterion; Dist, distal; IC, initial contact; NA, not applicable; OR, odds ratio; PTA, patellar tendon abnormality; ROM, range of motion; VGRF, vertical ground-reaction force; VISA-P, Victorian Institute of Sport Assessment – Patellar Tendon. See Appendix Table A1 for abbreviations, units of measure, and further details.
Bootstrapped with leave-N-out-cross-validation (n = 8 limb observations), sampled 3060 times.
OR: per unit increase in the biomechanical variable, the relative change in odds of moving between outcome levels in the direction of worsened PTA or symptoms.
95% CI based on bootstrapped sample 2.5% and 97.5% percentiles.
P value for multinomial regression compares against a saturated model (ie, a model with as many variables as observations).
Data are presented as median (95% CI).
The best model classified Δultrasound(Dist) with 83.3% overall accuracy (no change: 96.3%, worsened: 66.7%) and was statistically significant (P < .01); all 3 variables were significant and confirmed through bootstrapping; increased ΔHip Flexion ROM was associated with increased odds of worsened PTA by 1.27 times; ΔHip Flexion Velocity at IC was associated with increased odds of worsened PTA by 1.02 times; increased ΔVGRF impulse was associated with decreased odds of worsened PTA by 0.96 times.
The best ΔVISA-P model classified limb observations with 72.2% overall accuracy (improved: 80.0%, no change: 50.0%, worsened: 81.3%) and was statistically significant (P < .01). All 3 variables were significant and confirmed with bootstrapping; increased ΔMaximum Knee Flexion Velocity was associated with increased odds of worsened PTA by 1.39 times, increased ΔAnkle Flexion at IC was associated with increased odds of worsened PTA by 1.02 times, and increased ΔAnkle Flexion ROM was associated with increased odds of worsened PTA by 1.69 times. Appendix Figures A1 and A2 visualize the how the probability changes for Δultrasound(Dist) and ΔVISA-P with respect to their variables.
The most frequent biomechanical variables were examined among 90th percentile models in terms of overall accuracy and AICc criteria (Figure 4). Of 215 total models, 81 were represented by ultrasoundDist and 134 by VISA-P. The highest overall contributors across outcomes were seasonal changes in knee flexion velocity at IC and maximum jumping VGRF, which had similar highest total counts, followed by hip flexion velocity at IC, and then ankle flexion ROM. The most frequent variables were different between outcomes; the 4 most frequent VISA-P biomechanical variables matched the 4 overall; the most frequent variables among ultrasoundDist were maximum jumping VGRF, maximum hip flexion, hip flexion ROM, peak knee extension torque (not shown), and knee flexion velocity at IC. The mean odds ratios showed mixed agreement between models in terms of direction, and odds ratio magnitudes showed general agreement but with exceptions like ankle flexion ROM. A Spearman rank correlation found a moderate relationship (rho = -0.27), which was not statistically significant (P = .46).

Details of 90th percentile regression model variables. (A) Stacked bar chart showing the individual and cumulative count of biomechanical variables per outcome. (B) List of the cumulative top 10 variables and corresponding median OR per outcome. The presented values are partial ORs from 3-variable regressions. See Appendix Table A1 for abbreviations, units of measure, and further details. Dist, distal; IC, initial contact; max, maximum; OR, odds ratio; ROM, range of motion; US, ultrasound; VGRF, vertical ground-reaction force; VISA-P, Victorian Institute of Sport Assessment – Patellar Tendon.
Discussion
Aim 1: Timepoint Differences in Biomechanics, PTA, and VISA-P
We found no differences in biomechanical variables between timepoints, which may be related partly to our limited sample size and variability. Still, little reference data exist on the seasonal progression of lower extremity kinematics in the elite collegiate male basketball population. We found evidence that limb dominance affected kinetics, finding that peak landing force was reduced by 15% bodyweight in dominant limbs. This most likely impacted other kinetic variables specific to the landing phase such as knee flexion impulse, peak extension torque, and peak eccentric power. Why this should be is not understood as we found few statistically significant kinematic differences associated with limb dominance other than decreased hip flexion of about 2°. Side dominance has been reported to associate with increased impact peak force in dominant limbs during a drop vertical jump, 31 irrespective of step-off technique or drop height. This disagrees with our findings but given that dominance was not an important factor in our subsequent analyses may simply be a due to sample size. Drop technique was something we did not control for and should be considered in future work. A significant time-side interaction was noted for ankle flexion, but the magnitude was small, about 2°.
PTA severity changed very little for MRIProx, MRIDist, and ultrasoundProx measurements, whereas ultrasoundDist stood out. We speculate that PTA could manifest differently depending on tendon proximal-to-distal inhomogeneity. Young healthy patellar tendons are not structurally uniform in the lateral direction, 11 yet basic tendon properties are not available in proximal-to-distal regions as well as in the jumping athlete population. Imaging modality could also play a role as ultrasound has been found to be more sensitive that MRI in detecting clinically relevant PT. 30 Although the ultrasoundDist PTA change was statistically insignificant, we believed it was still appropriate to pursue in subsequent analyses.
We found no statistically significant evidence that VISA-P changed between visit 1 and visit 2. Interestingly, the mean score improved over time, and, after stratification (Table 1), observed changes in the median and mean values were somewhat mixed compared with what was expected. While decreased VISA-P scores are expected after a season of competitive play, improved scores are still possible since some players may undergo treatment or modify training behavior for PT during the season and recover.
Aim 2: Association of Seasonal PTA and Symptoms With Biomechanics
We found seasonal changes in VGRF kinetics, and hip, knee, and ankle kinematics were associated with worsened seasonal PTA and symptoms. Decreased postseason maximum jumping VGRF in limbs with worsened PTA was an expected compensation strategy, we assumed to protect and minimize further damage to the patellar tendon. This was somewhat contrary to expectations that maximum landing VGRF was both increased seasonally and similar between seasonal PTA categories and VGRF impulse was decreased less on average in worsened PTA limbs. Also, seasonal knee flexion kinetics variables were not significantly affected. It is possible actively competing athletes may not adopt limb unloading strategies even with worsened knee pathology. Some practical reasons could be a desire to support the team and to maintain playing performance for career prospects. Next, a pattern of increased hip and knee flexion velocity during landing appeared connected to worsened PTA and symptoms. From a mechanical perspective, faster flexing joints take more energy to brake and stop the body's descent to prepare for jumping. Time taken to brake may be a factor but we did not explore this in detail. The etiology of this phenomenon requires further study.
The analysis of seasonal VISA-P offered an opportunity to explore how biomechanical behavior differed with “improved” health—something not possible with our seasonal PTA observations. Transforming seasonal VISA-P scores into a categorical outcome was unconventional. Commonly, to vet presence of PT a VISA-P threshold is specified—typically ≤80—and combined with patellar tendon imaging or painful symptoms. A challenge is that athletes with morphologically abnormal patellar tendons can be asymptomatic. This may have been the case in the current study as most players’ scores would be considered healthy. Also, most seasonal VISA-P decreases were below a reported minimal clinically important threshold of 13 points or relative change of 15% to 27% and so may be harder to interpret. 10 Still, the multivariate analyses provided some evidence to associate subtle VISA-P changes with hip flexion variables and ankle kinematic variables, and univariate analyses with individual hip, knee, and ankle variables.
Limited comparisons can be made between the current study and available research because PT studies combining biomechanics, imaging, and symptoms measurements are rare. Most relevant biomechanical research is of cross-sectional or case-control design, includes cohorts representing numerous athletic disciplines (eg, dancing, basketball, volleyball, handball), and studies are methodologically heterogeneous. With this in mind, the current study's significant associations with worsened limbs were compared briefly with findings in recent systematic reviews by Harris et al 9 and Tayfur et al. 25 General agreement with significant or nonsignificant results meant the current study's seasonal change difference was in the direction of the difference in the injury group reported by the referenced study: decreased peak jump VGRF was compatible with Kulig et al 12 and Sorenson et al 8 studying volleyballers but incompatible with Richards et al 5 studying volleyballers; increased hip flexion velocity at IC was compatible with Edwards et al 22 studying team sports athletes; increased knee flexion velocity at IC and at IP-VGRF was compatible with Edwards et al 23 and Sorenson et al 1 but not Bisseling et al 23 studying volleyballers; increased ankle flexion ROM was incompatible with a small decrease reported by Harris et al 8 studying basketballers.
Among relevant longitudinal studies, a recent prospective study by Feng et al 6 measured knee joint behavior in male collegiate basketball players who performed horizontal stop-jumps. During the postjump landing phase, they found knee flexion at IC was on average decreased over 8° in limbs that developed a PT injury. We observed smaller decreases of 1° and 2°, which were not significant. One must consider that Feng et al 6 defined PT as both pain in the tendon and a VISA-P score of <67. Since our study did not record pain or strictly defined injury, the severity of PT is difficult to compare and may involve specific movement patterns. Still, the current study and the study of Feng et al 6 found lower extremity movement patterns were related to clinically pertinent PT. Next, a study by van der Worp et al 26 prospectively tested male and female jumping athletes performing a jump-landing-rebound task. They found increased leg stiffness (ratio of peak landing force to hip-forefoot excursion) in 3 athletes who developed jumper's knee. Leg stiffness was not calculated in our work, but stiffer lower extremities would correlate reasonably with higher landing VGRF, shorter time to IP-VGRF, and decreased joint ROM. The current study found worsened limbs had similar landing forces, negligible changes in time, and seasonal increases in ROM, which might suggest decreased mechanical stiffness.
Aim 3: Classifying Seasonal Change in PTA and VISA-P With Biomechanical Variables
The regression models accurately quantified longitudinal relationships between measurements of lower extremity biomechanics and clinically pertinent PT. The selected models served as examples that functional motion capture assessment can estimate risk of worsening PT over time. Each select model had different specific biomechanical variables yet shared knee flexion velocity. In addition, agreement was observed between Δultrasound(Dist) and ΔVISA-P outcomes among the top regression models. But, per variable, the count was generally biased and not even, partly because by chance more ΔVISA-P models were represented. Also, the medians were calculated from only a few or single values. Between the 2 selected models, a notable difference was that the Δultrasound(Dist) regression outperformed ΔVISA-P in classifying limbs with no seasonal change, which was likely influenced by relative group sample size. Other considerations are that each model fit different outcome variables and made different assumptions: ultrasoundDist bilateral measurements could span both categories whereas VISA-P scores did not distinguish a player's limbs, and Δultrasound(Dist) was a binomial variable whereas ΔVISA-P was multinomial. In multivariable regression, the contribution of each variable must be interpreted with the other in mind and, in general, the magnitude and fit of a variable differs with other variable combinations as well as with fewer or more variables. Bootstrapping confirmed that regression coefficients were stable within the study sample, but independent datasets are needed to properly validate this. This latter fact contributed significantly, which warrants a variety of inputs that span kinematic and kinetic measurements.
Few studies have used biomechanical metrics to classify or assign risk to clinically pertinent PT. Richards et al 19 reported positive predictors were increased knee flexion and increased peak VGRF, which has mixed agreement with the current study. Visnes et al 28 found that greater countermovement jump height was a significant predictor of developing symptomatic PT in volleyball players (OR, 2.09 [95% CI, 1.03-4.25]), but no other biomechanical measurements were reported.
Interpretation and Future Work
Beyond early detection, jumping athletes may face different risks of developing clinically pertinent PT during a competitive season. Our findings argue for the introduction of a functional layer into multimodal PT screening and identifying strategic variables for prognostic injury management. Management through biofeedback has been implemented successfully with gait retraining in osteoarthritis patients to decrease medial compartment loading and pain. Also, injury prevention programs such as the Fédération Internationale de Football Association 11+ program are proving effective, and in professional handball and soccer athletes, it has been shown to decrease the incidence of all lower extremity injuries by almost 80%. 16
Future studies need to increase statistical power by recruiting a large number of subjects including controls, possibly through multicenter collaborations. Standardized methodological guidelines are needed for results to be meaningfully compared and interpreted. Measurements spanning clinical and biomechanical modalities should be made at multiple timepoints throughout midseason. Female athletes and athletes at different levels of training are needed for better generalizability. Clinical data such as symptomatology and pain mapping should be included. 7 In addition, other measurements must be explored in parallel with function, for example, electromyographic measurements and quantitative imaging can enhance identification and support validation of musculoskeletal models.
Our findings must be interpreted with the following points in mind. A small sample size limited the power of the statistical analyses and generalizability of results to other populations. This study was exploratory in nature, and our analysis did not control for multiple comparisons, which increased the chance of a type I error. We did not record knee pain, which is a routine clinical metric when determining presence of PT. Our PTA variables were defined using imaging, and therefore, we cannot directly link morphology findings to symptomatology. In addition, PTA observations included predominantly mild grades of tendon degeneration with fewer more severe grades. Next, VISA-P scores were not specific to an individual limb, and seasonal categories included differences below reported meaningful thresholds. Furthermore, the decision to assign both limbs a single status potentially mixed healthy and symptomatic limbs in the analyses. The analyses did not adjust for potential nontrivial dependencies between limbs within a subject and instead assumed independence. Playing exposure was a potential confounder not considered in the analyses, the reasons being it did not include nongame practice time and relied on unconfirmed online sources. Given the prevalence of injuries in the sport, the exclusion of players who have had previous therapeutic modalities, surgical treatment, or hindered jumping or landing ability were possible uncontrolled confounding factors.
Finally, we acknowledge limitations with the land-jump task. To our knowledge, the current study's dynamic testing protocol was unique compared with most previous work. Others have reported predominantly drop landings, various kinds of vertical jumps, and horizontal stop-jumps, but no single task has been studied consistently. A closely matched protocol was used by Rosen et al 20 was a drop jump landing immediately followed by a 50% effort vertical jump. The current study's task combined landing and jumping, yet the latter phase did not have a purely vertical component, which is common. Still, a strength was that both landing and jumping heights were fixed as opposed to tasks achieving perceived maximal or submaximal jumping efforts, which may introduce additional variability. The 18-inch task height may not have been challenging enough or representative of actual play because the mean standing vertical jump height of Division I NCAA athletes is about 27 inches (68.6 cm) to 30 inches (76.2 cm), which does not consider tucking the legs; also, different controlled land-jump heights may evoke different biomechanical patterns between healthy and injured limbs. As with any task involving impacts, standard filtering methods were employed consistently to reduce signal noise, but skin motion artifact can never be completely removed and remains a source of error.
Conclusion
Our study prospectively examined patellar tendon morphological structure, dynamic land-jump biomechanics, and VISA-P in male collegiate basketball players. We found evidence that hip, knee, ankle, and VGRF variables were associated with changes in PTA severity and changes in symptoms across a season of play. Biomechanics were good at identifying limbs with worsened seasonal PTA and better at identifying limbs with improved and worsened symptoms. A common variable associated with seasonally worsened PTA and symptoms was seasonally increased knee flexion velocity.
Footnotes
Appendix
Results From 1-Way MANOVAs Fitting Seasonal Biomechanics to ΔVISA-P a

| Dependent Variables (Δ) | Improved n = 16 | No Change n = 10 | Worsened n = 10 | Multivariate Contrasts b | Partial η2 | P | Power (1 - β) |
|---|---|---|---|---|---|---|---|
| Hip flexion kinematics | (P< .05)* |
0.43 | .002 | 0.99 | |||
| Hip flexion at IC | -1 ± 5 | 1 ± 10 | -2 ± 3 | ||||
| Hip flexion at VGRF | -2 ± 5 | -3 ± 7 | 1 ± 3 | ||||
| Maximum hip flexion | -6 ± 17 | -3 ± 11 | -2 ± 10 | ||||
| Hip flexion velocity at IC c | -14 ± 29 | 10 ± 58 | 49 ± 58 | ||||
| Maximum hip flexion velocity | 11 ± 85 | -50 ± 104 | 31 ± 78 | ||||
| Hip flexion velocity at IP-VGRF | 9 ± 117 | -25 ± 40 | 34 ± 99 | ||||
| Hip flexion ROM | -4 ± 14 | -3 ± 14 | 0 ± 10 | ||||
| Knee flexion kinematics | 0.24 | .305 | 0.81 | ||||
| Knee flexion at IC | -1 ± 3 | 0 ± 4 | -2 ± 2 | ||||
| Knee flexion at VGRF | -2 ± 6 | -2 ± 10 | -1 ± 4 | ||||
| Maximum knee flexion | -3 ± 13 | -3 ± 7 | -1 ± 7 | ||||
| Knee flexion velocity at IC d | -28 ± 46 | 0 ± 66 | 36 ± 50 | ||||
| Maximum Knee flexion velocity | -1 ± 42 | 11 ± 68 | 43 ± 65 | ||||
| Knee flexion velocity at VGRF | 8 ± 121 | 21 ± 84 | 27 ± 100 | ||||
| Knee flexion ROM | -3 ± 11 | -3 ± 10 | 2 ± 8 | ||||
| Ankle flexion kinematics | (P < 0.01)** | 0.36 | .020 | 0.98 | |||
| Ankle dorsiflexion at IC | -1 ± 5 | -1 ± 6 | -1 ± 4 | ||||
| Ankle flexion at IP-VGRF | 1 ± 6 | 0 ± 5 | 2 ± 5 | ||||
| Maximum ankle dorsiflexion | 0 ± 3 | 1 ± 5 | 1 ± 4 | ||||
| Ankle flexion velocity at IC | 12 ± 73 | 35 ± 71 | 34 ± 82 | ||||
| Maximum ankle flexion velocity | 44 ± 126 | 36 ± 53 | 91 ± 164 | ||||
| Ankle flexion velocity at IP-VGRF | -7 ± 124 | 8 ± 97 | 21 ± 46 | ||||
| Ankle flexion ROM e | 0 ± 4 | 3 ± 4 | 4 ± 4 | ||||
| Knee flexion kinetics | 0.12 | .457 | 0.49 | ||||
| Knee flexion impulse | -7 ± 15 | -3 ± 7 | -5 ± 10 | ||||
| Peak knee extension torque | -0.4 ± 2.5 | 0.5 ± 2.8 | -1.2 ± 3.2 | ||||
| Peak concentric knee power | 0.7 ± 2.0 | 0.2 ± 2.0 | -1.2 ± 1.9 | ||||
| Peak eccentric knee power | -0.3 ± 3.5 | 0.3 ± 3.2 | 0.5 ± 3 | ||||
| VGRF kinetics | 0.12 | .420 | 0.52 | ||||
| Peak VGRF time | -0.4 ± 1.4 | -0.5 ± 1.5 | -0.3 ± 0.7 | ||||
| Maximum landing VGRF | 1 ± 33 | 12 ± 22 | 2 ± 12 | ||||
| Maximum jumping VGRF | 4 ± 24 | 3 ± 11 | -12 ± 23 | ||||
| VGRF impulse | -40 ± 71 | -10 ± 50 | -2 ± 54 |
Data are presented as mean ± SD. ANOVA, analysis of variance IC, initial contact; IP, initial peak; MANOVA, multivariate ANOVA; ROM, range of motion; VISA-P, Victorian Institute of Sport Assessment – Patellar Tendon; VGRF, vertical ground-reaction force. See Appendix Table A1 for abbreviation expansions, units of measure, and further details.
Statistically significant between-group differences (P < .05): *improved vs no change; **improved vs worsened; ***no change vs worsened.
P < .01 (**P < .01); statistically significant main effect according to univariate ANOVA (P < .05).
P < .05 (**P < .01) ; statistically significant main effect according to univariate ANOVA (P < .05).
P < .05 (*,***P < .05 for both) ; statistically significant main effect according to univariate ANOVA (P < .05).
Acknowledgements
The authors acknowledge Mandi Gibbons, Mehnaz Shahid, Bin Lin, Lydia Ko, and Emily Casaletto for their contributions to this study.
Final revision submitted December 3, 2023; accepted January 10, 2024.
One or more of the authors has declared the following potential conflict of interest or source of funding: M.D. has received education payments from Gotham Surgical, consulting fees from DePuy Synthes and Extremity Medical, nonconsulting fees from Arthrex, and royalties from Extremity Medical. A.A. has received education payments and consulting fees from Arthrex. O.K.N. has received consulting fees from Canon Medical Systems. AOSSM checks author disclosures against the Open Payments Database (OPD). AOSSM has not conducted an independent investigation on the OPD and disclaims any liability or responsibility relating thereto.
Ethical approval for this study was obtained from the Hospital for Special Surgery (ref No. 2016-627).