
Abstract
Background:
Glenoid bone loss (GBL) is common in patients with shoulder instability and plays a major role in surgical decision-making. While a plethora of GBL estimation methods exist, all of which present specific challenges, recent studies have developed simple linear formulas estimating GBL based on glenoid height.
Purpose:
To assess the correlation between glenoid height and width, and to develop specific formulas based on age and sex to calculate the native glenoid width in the Lebanese population.
Study Design:
Cross-sectional study; Level of evidence, 3.
Methods:
Computed tomography scans for 202 normal shoulders were extracted from our database. The glenoids were reconstructed in 3 dimensions and their width and height were measured. Glenoid width and height were compared between male and female groups. Correlation analysis was also performed on the width, height, age, and body mass index. Formulas estimating glenoid width were developed using regression analysis including all variables significantly influencing the model. Results were then compared with the values calculated using previously published formulas to determine the external validity when using linear formulas to estimate GBL.
Results:
Significant differences were found between men and women. Regression analysis found that glenoid height and width strongly influenced the model, and that age showed a weak but significant correlation; therefore, the following 2 sex-specific formulas were developed: width (mm) = 6.1 + 0.51 ×height+ 0.03 ×age, and width (mm) = 4.55 + 0.51 ×height+ 0.03 ×age, in men and women, respectively. The values yielded from the formulas developed in this study and the true width significantly differed from those calculated from previous reports.
Conclusion:
A strong correlation was found between glenoid height and width in a the Lebanese population and demonstrated that glenoid width can be accurately calculated based on the glenoid height and patient's age and sex using the following simplified formulas: width (mm) = 6 + 0.5 ×height+ 0.03 ×age, and width (mm) = 4.5 + 0.5 ×height+ 0.03 ×age, in men and women, respectively.
Bony Bankart lesions are common after glenohumeral dislocations and can be found in up to 90% of patients with recurrent shoulder instability. 24 Determination of the amount of glenoid bone loss (GBL) is crucial for surgical decision-making.1,7 While 20% to 25% GBL has traditionally been used as a cutoff for glenoid bony reconstructions due to high failure rates after soft tissue stabilization, recent studies have suggested that this number may, in fact, be as low as 13.5%.10,20 Thus, accurate determination of native glenoid width, and therefore GBL, is essential in preoperative planning.
Different methods for the determination of GBL have been described, such as the surface area method, 22 the glenoid arc angle, 3 the ratio method, 2 the anteroposterior distance from the bare area, 17 and the Pico method. 8 However, these methods present their own challenges, such as difficulty in measurement, the inconsistency of certain anatomic landmarks relied upon by most techniques, and unnecessary exposure to irradiation when contralateral shoulder imaging is required.4,10,11,13
More recently, it has been suggested that a relationship exists between glenoid height and width.5,6,9,15,16,19 The height has been used for reference because it is usually not affected in shoulder instability.6,9 Although some authors have developed formulas to calculate the glenoid width based on its height, the formulas have differed, suggesting that certain ethnicities may have different correlations due to differences in glenoid morphology and size.9,16,19 It is also still inconclusive whether age and sex should play a role in these formulas. Indeed, while some authors have developed distinct formulas for male and female patients, others have developed a single formula regardless of sex. In addition, while most studies have found no relationship between glenoid width and age, Contreras et al 6 and Knapik et al 12 reported that older patients had significantly larger glenoid width. The aim of this study was to assess the correlation between glenoid height and width in a Lebanese population and to develop specific formulas based on significant variables (age and/or sex) to calculate the native glenoid width to estimate GBL in patients with shoulder instability. The secondary aim was to compare all previously published formulas worldwide to determine whether these formulas should be used only among their specific populations. We hypothesized that a strong correlation would also exist between the height and width among our population and that each formula is specific to its study sample—that is, it should only be generalized to the targeted population.
Methods
Study Population
The study received institutional research board approval (CEHDF 2145). Data were retrospectively collected from patients who had been evaluated in the emergency department of our institution between 2020 and 2021 for any motive unrelated to shoulder pain and underwent a chest computed tomography (CT) scan that included both glenohumeral joints.
Chest CT scans using a 64-slice scanner (LightSpeed; General Electric) were evaluated. All CT scans had used the following parameters during acquisition: adaptive tube current, 1.25-mm section thickness, 1.25-mm interval, and 120 kVp. The inclusion criterion was a CT scan that showed the entire glenohumeral joint on both sides. Exclusion criteria were patients with preexisting shoulder pathology, patients who were previously operated at the level of the shoulder, skeletally immature patients, glenohumeral joints with degenerative changes (including glenohumeral osteophytes, joint space narrowing, posterior humeral head subluxation, and posterior glenoid wear), 21 patients with incomplete medical records, and unacceptable quality of the CT scans that precluded the proper reconstruction and assessment of the glenoid. Patient medical records were reviewed, and demographic data, including age, sex, and body mass index (BMI), were collected.
Data Processing
Each glenoid was manually segmented and reconstructed to a 3-dimensional (3D) model after subtraction of the humeral head using the Virtual Reality reformat module of the GE Advantage workstation (Windows Version 4.X; General Electric). All reconstructions were anonymized. Reconstructions and measurements were undergone by a single senior radiology resident (E.E.H.). Intra- or interrater reliability analysis was not performed in the current paper since previous studies have reported high reliability values using measurements based on 3D CT models.5,6,9,19
A strict en face view of the glenoid was used to measure glenoid height and width (Figure 1). The 3D en face view is typically obtained by aligning the glenoid surface with the scapular axis. However, to reduce measurement bias related to abnormal glenoid version, a strict 3D en face view was used instead by adjusting the axial orientation where the glenoid surface was viewed, in which the largest horizontal and vertical planes were recorded. 14 The height was defined as the maximal distance from the proximal superior extremity of the glenoid (12-o’clock position) to the maximal inferior extremity (6-o’clock position). The width was defined as being the maximal orthogonal distance to the previously measured height.
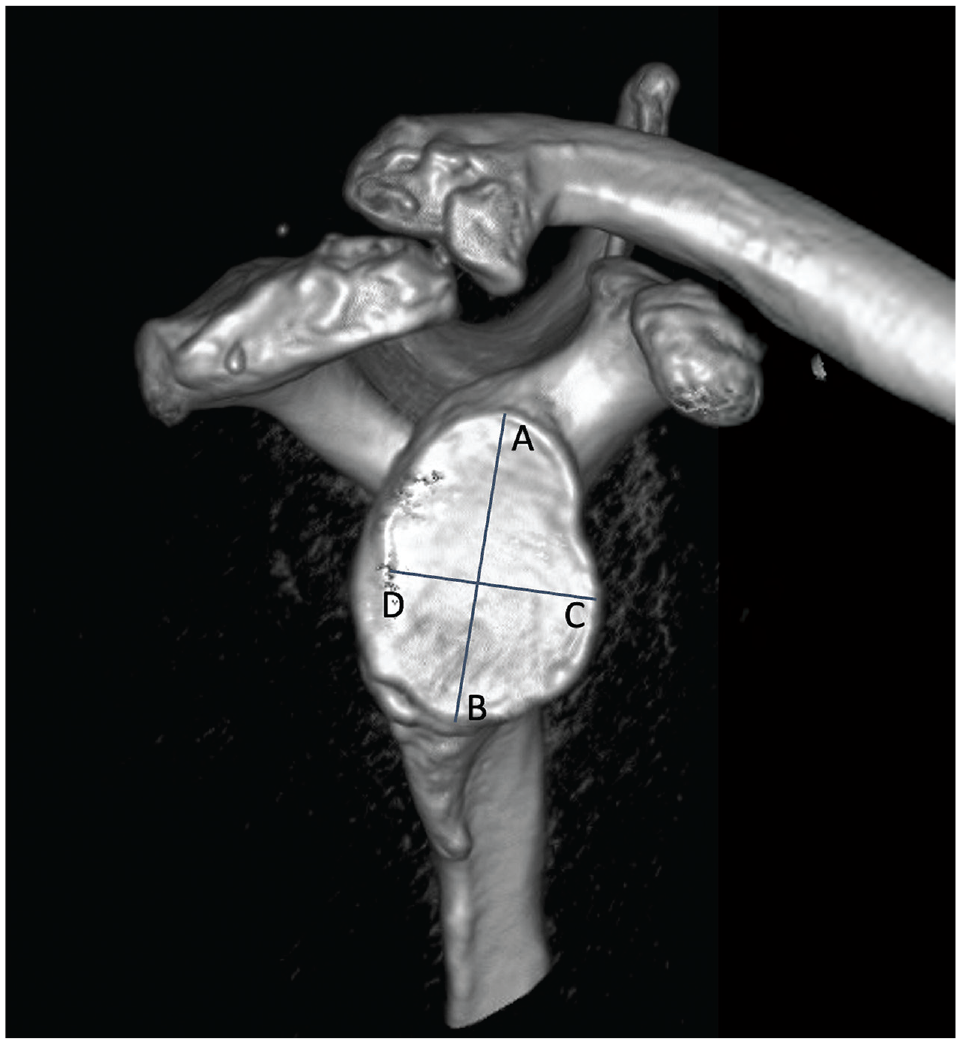
A strict en face view of a 3-dimensional reconstruction of the glenoid. The glenoid height is measured as the line from A to B. The glenoid width is measured as the line from C to D.
The theoretical width was then calculated using previously published equations as per Giles et al, 9 Ohl et al, 15 Owens et al, 16 Chen et al, 5 Rayes et al, 19 and Contreras et al. 6 This was performed to compare how formulas generated by different authors worldwide would affect glenoid width estimation within the same population.
Statistical Analysis
In order to assess significant differences between glenoid parameters between the male and female groups, mean values of height and width were compared using either a Student t test or a Mann-Whitney U test depending on the normality of the data (Shapiro-Wilk test). Then, correlations between the glenoid height, width, and age were evaluated using either a Pearson or a Spearman correlation analysis depending on the normality of the data. Finally, an equation to estimate the glenoid width was developed using a stepwise multiple linear regression model with the width as the dependent variable and height, age, and sex as independent variables. The theoretical width was then calculated using the newly developed formula.
To assess whether our newly developed formula was specific to the Lebanese population, the different theoretical width and the true width values were compared using either a repeated measures analysis of variance test with multiple pairwise comparisons or a Friedman test with multiple pairwise comparisons using the Nemenyi procedure, depending on the normality of the data. Normality of data was assessed using a Shapiro-Wilk test. All statistics were performed in XLSTAT (MacOS Version 2022.4.1; Addinsoft). The level of significance was set at P = .05.
Results
A total of 202 shoulders were included in the analysis with a male to female ratio of 100:102, a mean age of 35.6 ± 9 years (range, 18-59 years), and a mean BMI of 24.1 ± 11 kg/m2. The values for the measured glenoid height and width are presented in Table 1. Comparison studies between male and female groups showed significant differences in both height (mean ± SD, 35.9 ± 3 mm vs 31.4 ± 2.1 mm, respectively; P < .001) and width (mean ± SD, 25.6 ± 2.4 mm vs 21.8 ± 1.6 mm, respectively; P < .001).
Mean Measurement Results of Glenoid Height and Width a

Data are reported as mean ± SD.
Boldface P values indicate statistically significant difference between Male and Female groups (P < .05).
Correlation analysis showed a positive correlation between height, width, and age, although BMI did not show any significant correlations (Table 2). There was a strong correlation between the width and height (r = 0.83) and a weak but significant correlation between the age and width (r = 0.16). In addition, the linear regression analysis found that height (β = 0.66; P < .001), sex (female, β = −0.28; P < .001), and age (β = 0.12; P = .02) significantly influenced the model (Figure 2). The following formulas were thus presented according to sex (adjusted R2 [aR2] = 0.73; P < .001): in male patients, width (mm) = 6.1 + 0.51 ×height + 0.03 ×age (mm); and in female patients, width (mm) = 4.55 + 0.51 ×height 0.03 ×age (mm).
Correlation Matrix Showing the Correlation Coefficients (r) of the Different Variables a

Boldface values indicate statistically significant difference between groups. BMI, body mass index.
P < .001.

Regression analysis between glenoid height and width for both male (orange) and female (blue) patients.
The calculations of the theoretical glenoid width according to the different formulas found in the literature are presented in Table 3. In sum, significant differences were found between the true width and differentially calculated theoretical width values using different formulas (all, P < .001) and using the true width measured in our population. As was expected, no significant differences were found between the true width and theoretical width values calculated using our newly developed formula (23.7 ± 2.8 mm vs 23.5 ± 2.4 mm; P = .91, respectively). Theoretical width based on Chen et al 5 formulas led to lower values (23 ± 2.3 mm), while Owens et al, 16 Rayes et al, 19 and both (sex independent and sex specific) Giles et al 9 formulas led to higher theoretical width values (25.2 ± 2 mm, 26.1 ± 2.4 mm, 26.3 ± 2.7 mm, and 26.4 ± 3.1 mm, respectively). Pairwise comparison analysis showed significantly different groups when calculating the theoretical width obtained from different formulas using the height from this study's population.
Formulas, Mean Values, and SDs for the True Glenoid Width and the Theoretical Values Obtained From the Different Formulas

Variables in formulas are in millimeters. Values that were significantly different were represented in different alphabetical groups (all, P < .001) such that 2 values sharing the same letter were not significantly different. Formulas with fractions are copied as they were presented in the source articles. F, female; H, glenoid height; M, male; n/a, not applicable; W, glenoid width.
Sex-independent formula.
Discussion
The main finding of this paper was that glenoid width was strongly correlated with glenoid height (r = 0.83), with significant difference between sex groups (P < .001). As such, 2 formulas were generated (aR2 = 0.73; P < .001) using stepwise multiple linear regressions based on sex, while also including age, to estimate the GBL in patients with shoulder instability. To our knowledge, this is the first report to evaluate the relationship between the glenoid height and width in a Lebanese population.
Patients with shoulder instability often have bipolar bone loss. GBL is one of the most important factors for surgical decision-making when dealing with instability, and values as low as 13.5% have been reported to be critical when opting for soft tissue and/or bony stabilizing procedures. 18 As such, proper evaluation of GBL is of paramount importance. 24 While many methods for glenoid width determination exist, most recent endeavors have attempted to assess the relationship between glenoid height and width in order to develop a simple formula to calculate the glenoid width based on its height. This measurement technique has shown high observer reliability values; therefore, it is valid and reliable to determine GBL.5,6,9,19
The current study found a strong correlation between the 2 glenoid parameters, similar to previous reports published by Giles et al, 9 Chen et al, 5 Contreras et al, 6 and Rayes et al 19 (r = 0.83 vs 0.81, 0.82, 0.81, and 0.88, respectively). This could be related to the fact that all these studies were based on 3D CT reconstruction images to document their measurements. On the contrary, the correlation coefficient value presented by Owens et al, 16 who reported on 3D magnetic resonance imaging reconstruction images, was ≤0.56.16,23 While the use of magnetic resonance imaging could be appropriate, it was found to be less accurate than CT for properly measuring glenoid height and width. 9 This study supports CT scans as the gold standard imaging modality to evaluate GBL using linear formulas.
No consensus exists on whether sex should be included in the model, as different studies have found conflicting results. Owens et al, 16 Chen et al, 5 and Contreras et al 6 published different formulas according to the sex of the patients. Although Giles et al 9 published both a general formula unrelated to sex and different formulas specific to sex, they found that the latter approach yielded optimal predictions. Contrary to these studies, Rayes et al 19 published a general formula independent of sex, due to too low a number of female participants to produce a reliable sex-specific formula. 19 In the present study, the same number of male and female patients were included in the analysis. Additionally, glenoid width values were found to be significantly higher in the male compared with the female group (P < .001).5,9,16,19 As a result, sex was included in our regression model, yielding a robust analysis (aR2 = 0.73; P < .001) in which all 3 variables (glenoid height, age, and sex) significantly influenced the glenoid width. This led to the development of 2 formulas, which can be simplified to the following: width (mm) = 6 + 0.5 × height + 0.03 × age, and width (mm) = 4.5 + 0.5 × height + 0.03 × age, in men and women, respectively.
While many studies assessing the correlation between glenoid width and height have also found sex to play a significant role, age has not been so widely included. 6 In our study, significant correlation was found between age and width, although with a weak correlation coefficient (r = 0.16). Contreras et al 6 found results similar to ours, with a somewhat weak correlation coefficient as well (r = 0.2), that significantly influenced the regression model. As a result, age was also included in the calculation. Although the contribution of age in the formula may seem minimal at first glance (0.03 × age), removing it from the equation in an attempt to simplify it would potentially lead to an underestimation of the GBL, especially in patients with a small glenoid, since each millimeter of GBL counts in the surgical decision-making and preoperative planning. Furthermore, 2 reports, by Knapik et al 12 and Yamakado, 25 found that older patients had significantly larger glenoids. The latter argued that this may be due to remodeling of the glenoid fossa secondary to prolonged use of the shoulder. Further studies may be required to better delineate this relationship. As a result, similar to the Chilean population, the current study considered both sex and age in its linear formulas, and we feel this could yield a more accurate estimation of the native glenoid width. 6
The intra- and interobserver reliability for glenoid width and height measurements using 3D CT reconstruction en face views has already been reported. All measurements undertaken in our study followed the same measurement techniques used previously. All studies that reported on linear formulas for native width calculation showed good to excellent results with intraobserver intraclass correlation coefficient (ICC) values ranging from 0.76 to 0.97 for glenoid width and 0.76 to 0.95 for glenoid height, and interobserver ICC values ranging from 0.86 to 0.96 for glenoid width and 0.93 to 0.97 for glenoid height.5,6,9,19 Owing to the general agreement between the different studies on the high reliability of the measurement method, a reliability analysis was not undertaken in this paper.
Comparisons between the values of theoretical width obtained based on the previously published formulas showed significant differences (Table 3) (P < .001). Pairwise comparisons further showed that the theoretical width obtained from all formulas, except the one developed in this study, were significantly different from the true width. This supports our hypothesis and also shows the importance of developing population-specific formulas for the prediction of native glenoid width. In fact, the formula developed by Chen et al 5 would lead to an underestimation of the native glenoid width and thus an underestimation of the GBL, compared with the other formulas that contrarily overestimated the bone loss.5,6,9,15,16,19 Thus, applying these population-specific formulas to different populations or geographical areas could lead to errors in calculation, preventing surgeons from offering the optimal treatment to patients with shoulder instability. Although this finding was previously reported by Rayes et al, 19 this is the first report to demonstrate it statistically. It is therefore crucial to apply linear formulas only on their specific populations or to use a different method if no formula has yet been reported for the targeted population.
Limitations
The present study acknowledges some limitations. First, chest CT scans were used to obtain shoulder 3D imaging reconstructions. Although these reconstructions may be theoretically inferior to those obtained from dedicated shoulder CT scans, we believe that the use of high-resolution scans allowed an accurate reconstruction of the glenohumeral joint. Second, our cohort included patients covering a wide age range, particularly patients >40 years old, who were outside the standard age group typically affected by shoulder instability. However, patients showing signs of osteoarthritis were excluded; thus, glenoid morphology should not be biased. In addition, although age only slightly affected the calculation, it was added to the formula due to its significant correlation with the width. Furthermore, reliability of the measurements was not undertaken in this study. In fact, the intra- and interobserver reliability for glenoid width and height measurements, using 3D CT reconstruction en face views, has already been reported. All measurements undertaken in our study followed the same measurement techniques used previously, and all studies that reported on linear formulas for native width calculation showed good to excellent results with intraobserver ICC values ranging from 0.76 to 0.97 for glenoid width and 0.76 to 0.95 for glenoid height, and interobserver ICC values ranging from 0.86 to 0.96 for glenoid width and 0.93 to 0.97 for glenoid height.5,6,9,19 Owing to the general agreement between the different studies on the high reliability of the measurement method, a reliability analysis was not undertaken in this paper. Finally, similar to previous studies, the formulas generated in this paper are specific to the Lebanese population and should not be generalized to other populations. Future studies may attempt to validate the formula developed in this work on a different, wider audience among the Lebanese population.
Conclusion
The current study showed a strong correlation between glenoid height and width in the Lebanese population and demonstrated that glenoid width can be accurately calculated based on the glenoid height and patient's age and sex, using the following formulas: width (mm) = 6 + 0.5 ×height+ 0.03 ×age, and width (mm) = 4.5 + 0.5 ×height+ 0.03 ×age, in men and women, respectively.
Footnotes
Final revision submitted November 9, 2023; accepted November 16, 2023.
The authors declared that they have no conflicts of interest in the authorship and publication of this contribution. AOSSM checks author disclosures against the Open Payments Database (OPD). AOSSM has not conducted an independent investigation on the OPD and disclaims any liability or responsibility relating thereto.
Ethical approval for this study was obtained from the Hôtel-Dieu de France, Saint Joseph University of Beirut, Beirut, Lebanon (ref No. CEHDF 2145).