
Abstract
Background:
Bone stress injury (BSI) is a common overuse injury in active women. BSIs can be classified as high-risk (pelvis, sacrum, and femoral neck) or low-risk (tibia, fibula, and metatarsals). Risk factors for BSI include low energy availability, menstrual dysfunction, and poor bone health. Higher vertical load rates during running have been observed in women with a history of BSI.
Purpose/Hypothesis:
The purpose of this study was to characterize factors associated with BSI in a population of premenopausal women, comparing those with a history of high-risk or low-risk BSI with those with no history of BSI. It was hypothesized that women with a history of high-risk BSI would be more likely to exhibit lower bone mineral density (BMD) and related factors and less favorable bone microarchitecture compared with women with a history of low-risk BSI. In contrast, women with a history of low-risk BSI would have higher load rates.
Study Design:
Cross-sectional study; Level of evidence, 3.
Methods:
Enrolled were 15 women with a history of high-risk BSI, 15 with a history of low-risk BSI, and 15 with no history of BSI. BMD for the whole body, hip, and spine was standardized using z scores on dual-energy x-ray absorptiometry. High-resolution peripheral quantitative computed tomography was used to quantify bone microarchitecture at the radius and distal tibia. Participants completed surveys characterizing factors that influence bone health—including sleep, menstrual history, and eating behaviors—utilizing the Eating Disorder Examination Questionnaire (EDE-Q). Each participant completed a biomechanical assessment using an instrumented treadmill to measure load rates before and after a run to exertion.
Results:
Women with a history of high-risk BSI had lower spine z scores than those with low-risk BSI (–1.04 ± 0.76 vs –0.01 ± 1.15; P < .05). Women with a history of high-risk BSI, compared with low-risk BSI and no BSI, had the highest EDE-Q subscores for Shape Concern (1.46 ± 1.28 vs 0.76 ± 0.78 and 0.43 ± 0.43) and Eating Concern (0.55 ± 0.75 vs 0.16 ± 0.38 and 0.11 ± 0.21), as well as the greatest difference between minimum and maximum weight at current height (11.3 ± 5.4 vs 7.7 ± 2.9 and 7.6 ± 3.3 kg) (P < .05 for all). Women with a history of high-risk BSI were more likely than those with no history of BSI to sleep <7 hours on average per night during the week (80% vs 33.3%; P < .05). The mean and instantaneous vertical load rates were not different between groups.
Conclusion:
Women with a history of high-risk BSI were more likely to exhibit risk factors for poor bone health, including lower BMD, while load rates did not distinguish women with a history of BSI.
Bone stress injury (BSI) is an overuse injury that occurs in both athletes and military personnel and is more common in women. 39 Recovery from a BSI varies by anatomic location, and a full return to sports may take up to 6 months.16,28 A history of BSI is among the strongest risk factors for future BSI,5,18,34,38 highlighting the importance of understanding the risk factors contributing to injury with the ultimate goal of preventing future BSI.
Identifying risk factors associated with BSI is important to guide the management and prevention of future injury. 15 Among athletes, multiple studies suggest differences in risk factors by anatomic location of BSI. BSIs localized to the pelvis and femoral neck containing more trabecular bone are considered “high risk” as they take longer to heal and are at greater risk of progressing to an occult fracture. These high-risk BSIs are more strongly associated with risk factors contributing to lower bone mineral density (BMD) compared with injuries in sites such as the tibia, fibula, and metatarsal bones.17,22,35,36 In contrast, BSIs localized to the tibia, fibula, and metatarsals (excluding the 5th metatarsal) containing thicker cortices are considered “low-risk” BSIs and generally heal more quickly. These low-risk BSIs have been associated with other factors, such as gait biomechanics.21,24,34,40,42
Risk factors for BSI and poor bone health include nutritional deficits, low energy availability, menstrual dysfunction, and impaired sleep. The female athlete triad (Triad) and relative energy deficiency in sport (REDs) describe the influence of low energy availability and menstrual dysfunction on low BMD and BSI.7,26 Triad risk factors for BSI include elevated dietary restraint, low body mass index (BMI), oligomenorrhea/amenorrhea, and low BMD; these risk factors may be cumulative for BSI,5,9,18,34,38 including for high-risk BSI. 17 Athletes with estimated energy deficit and/or amenorrhea also have poorer bone microarchitecture and estimated bone strength1-3 as measured by high-resolution peripheral quantitative computed tomography (HR-pQCT) compared with energy-replete or eumenorrheic counterparts. Whether women with high-risk BSI exhibit poorer bone microarchitecture and estimated bone strength compared with those with low-risk BSI is unknown. Other potential risk factors for BSI include iron deficiency with or without anemia,11,23,25 lower calcium or vitamin D intake,18,20,33 and impaired sleep 6 Notably, these latter risk factors have not been explored in relation to high-risk and low-risk BSI.
Other work has identified components of running biomechanics as possible risk factors, particularly for low-risk BSI. Elevated load rates, particularly in the tibia, have been associated with BSI.21,24,41,42 Fewer studies have quantified changes in load rates between fresh (eg, early steady-state condition) and postexertion conditions when running.14,29,30 Runners with multiple BSIs displayed elevated load rates in fresh compared with postexertion state when instructed to run at a simulated 5000-m goal pace, in contrast to minimal changes in load rates measured in those without a history of BSI. 30 Whether exertion-related changes in biomechanics differ between those with low-risk and high-risk BSI is unknown.
This study aimed to characterize factors associated with BSI within a population of premenopausal women, comparing those with a history of high-risk or low-risk BSI with those with no history of BSI. We hypothesized that women with a history of high-risk BSI would be more likely to exhibit risk factors for poor bone health, lower BMD, and less favorable bone microarchitecture compared with those with a history of low-risk BSI or no previous BSI. In contrast, we expected women with a history of low-risk BSI to exhibit higher load rates during running, particularly after a run to exertion, compared with women with no previous BSI.
Methods
Participants
We enrolled women between the ages of 18 and 40 years. A convenience sample of 45 women was recruited for this study between May 2017 and January 2020, with a portion of the sample reported elsewhere.13,30,32 Participants included 15 women with a history of only low-risk BSI (tibia, fibula, or metatarsal) and 15 women with a history of at least 1 high-risk BSI (femoral neck, pelvis, or sacrum), using a previous definition for high-risk location of injury. 7 Women with a history of multiple BSIs that included at least 1 BSI in the femoral neck, pelvis, or sacrum were assigned to the high-risk BSI cohort. Healthy controls were 15 women without a history of BSI. All participants reported participating in at least 4 hours of weightbearing activity per week or running at least 15 miles per week for the past 6 months. Participants in the BSI groups were at least 12 months from their most recent BSI diagnosis. The exclusion criteria included sustaining any sport-related injuries in the previous 6 months. In addition, those with underlying medical conditions (including diagnosis of eating disorder) and the use of medications (eg, oral steroids, bisphosphonates, and lithium) known to affect bone health were also excluded. The protocol for this study received institutional review board approval, and written informed consent was obtained from each participant before beginning the study.
Health Factor Questionnaire
Each participant completed surveys regarding previous injuries and potential risk factors for BSI and poor bone health—including menstrual history, eating behaviors, weight changes at adult height, and sleep. Injury history included a previous diagnosis of BSI and such details as whether the injury occurred during sports participation, whether it was diagnosed by a medical provider, and whether it was radiographically confirmed. Each injury that met all 3 criteria was classified as a BSI.
Eating behaviors and associated health concerns were assessed via questionnaires. The Eating Disorder Examination Questionnaire (EDE-Q), which consists of 4 subscales (Shape Concern, Weight Concern, Restraint, and Eating Concern), was used to assess current disordered eating attitudes and behaviors. 8 Each participant was asked to report the highest and lowest weight for their adult height. Calcium and vitamin D intake from the diet and supplements was recorded to provide total daily intake. A history of anemia was answered with a yes/no response.
Menstrual history was obtained, including the age of menarche, number of menstrual periods each year, and fewest menstrual periods in the past 12 months. Previous and current use of hormonal therapy—including oral contraceptive pills, intramuscular contraceptives (progesterone), and use of intrauterine devices—were also characterized, including reason for use. A participant was characterized as having a history of amenorrhea if she reported an age of menarche >15 years or ever having gone ≥3 months without menses while not on hormonal therapy.
Information regarding sleep behavior included the mean hours of sleep during the weekday nights (Sunday through Thursday) and weekend nights (Friday and Saturday), with responses in 3 categories—>9 hours, between 7 to 9 hours, or between 5 to 7 hours per night.
Body Composition and BMD
Participants’ body mass was measured using an electronic scale, and height was measured via a wall-mounted stadiometer. Dual-energy x-ray absorptiometry (DXA) scans (QDR4500A; Hologic Inc) were performed on all participants to measure body composition and BMD. The BMD values were obtained for the femoral neck, total hip, lumbar spine, and total body. Scans were reviewed by a physician-investigator with experience interpreting DXA results (K.E.A.). Quality control scans were performed daily with a phantom. BMD values were standardized to z scores using age, sex, and race and ethnicity normative values.
Bone Geometry and Microarchitecture Measurements
We measured bone geometry and microarchitecture using HR-pQCT (XtremeCT II; Scanco Medical AG) for both the distal tibia and radius. The protocol included measures at the distal tibia (7% site), and site of distal radius (4% site) that included region of interest extending 9.02 mm proximally.13,32 The nondominant radius and tibia were scanned unless the participant reported a previous fracture in that limb, in which case the dominant limb was used for the scan. Leg dominance was determined by asking participants which leg they would use to kick a soccer ball. Arm dominance was determined by asking participants which hand they wrote with. At each site, measures included total bone cross-sectional area, cortical cross-sectional area, ratio of cortical cross-sectional area to total cross-sectional area, total density, cortical density, trabecular density, cortical porosity, and cortical thickness. A linear micro finite element analysis was performed using 3-dimensional HR-pQCT images to approximate the compressive stiffness and failure load of the tibia under axial compression. A hydroxyapatite phantom was scanned daily for quality control, and each scan was reviewed for motion artifact and repeated, if necessary.
Blood Tests
Each participant had blood drawn by a phlebotomy-trained research staff on the date of DXA and HR-pQCT acquisition. Laboratory tests included hemoglobin, hematocrit, mean corpuscular volume, ferritin, and 25-hydroxy vitamin D.
Running Biomechanical Assessment
Gait analyses were performed using an instrumented treadmill (AMTI) with a sampling rate of 1500 Hz using a protocol previously described. 30 Briefly, participants wore conventional, neutral, cushioned shoes during testing (Nike). Retroreflective markers were placed on a participant's anatomic landmarks and tracked with a 3-dimensional motion capture system (Vicon). To determine treadmill speed, participants self-reported their 5-km race pace in minutes per mile, and 15 seconds were added to the pace to adjust for the challenges of performing this pace on a treadmill indoors. A 5-minute warm-up was performed at a self-selected speed before the treadmill speed was adjusted to a 5-km race pace. Participants reported their rate of perceived exertion (RPE) once per minute during the trial, where a score of 1 is considered very easy, and a score of 20 is regarded as a maximal effort. Force data were collected during the first minute of an exertion run at the estimated 5-km race speed (defined as the fresh condition) and then again from the time participants reported an RPE of 17 until they reached an RPE of ≥18 and the trial was stopped (exerted condition). The foot strike pattern was determined visually using sagittal plane 2-dimensional video (125 Hz). A rearfoot strike pattern was defined with initial contact of the heel to the ground, midfoot strike if the shoe landed flat, and forefoot strike with initial contact of the ball of the foot.
The ground-reaction force (GRF) data were processed using a fourth-order, 50-Hz low-pass filter. GFR data were used to calculate vertical average load rate (VALR), vertical instantaneous load rate (VILR), and vertical stiffness at initial loading (VSIL) using criteria previously described. 37 A vertical GRF threshold of 40 N was used to determine the start and end of the stance phase. A point of interest (POI) was identified as the first point >75% of the participant's body weight (BW), where the slope of the vertical GRF was <15 BW/s. The VALR was then determined by calculating the mean slope of the vertical GRF in the largest continuous region in the 20% to 80% of the POI force region for which the slope was >15 BW/s. The VILR was calculated as the peak slope between 20% and 100% of the POI force. 37 The VSIL was calculated by dividing the change in vertical force by the change in vertical center of mass in the same region as the VALR calculation (20%-80% of the POI force region). The vertical center of mass displacement was determined through a double integration of the vertical GRF.
Statistical Analysis
Statistical analysis was performed using SPSS Version 25 (IBM Corp). Continuous variables were checked for normality using the Shapiro-Wilk test. An alpha level of .05 was used for all inferential statistics. For normally distributed data, a 1-way analysis of variance was used to determine significant differences among groups. When significance was detected, a Bonferroni post hoc test was used to examine between-group significance. The Kruskal-Wallis test was used for nonnormal data to determine significant group differences. The Mann-Whitney U test with Bonferroni correction was used to account for multiple comparisons and determine between-group differences. Chi-square tests were performed to assess the significance of categorical variables. Participants who had missing data for a variable were excluded from the analysis of that missing variable. Data were reported as mean ± SD or frequency and percentage.
At the time of the data analysis, several women were identified with a nonrearfoot strike pattern during the biomechanical assessment. Therefore, a subgroup analysis was performed on participants who ran with a rearfoot strike pattern, as this is the most common foot strike pattern in runners and is associated with the highest load rate values.4,12,31
Results
A total of 46 women enrolled in the study, and 45 women were included for analysis (1 participant was excluded for BSI not in an anatomic location defined as high-risk or low-risk) (Table 1). All were identified as non-Hispanic White except for 1 participant who identified as mixed race. Of the 45 participants, a total of 61 BSIs, as confirmed by plain radiographs or magnetic resonance imaging, were reported. Overall, participants had a normal BMI (21.6 ± 1.7 kg/m2), their primary sport was running (95.6%), and nearly two-thirds ran with a rearfoot strike pattern (n = 29 [64.4%]).
Characteristics and Biological Variables According to Study Group a

Data are reported as mean ± SD or n (%). BMI, body mass index; BSI, bone stress injury; DXA, dual-energy x-ray absorptiometry; EDE-Q, Eating Disorder Examination Questionnaire; max, maximum; min, minimum.
Significant difference between low-risk and no BSI history (P < .05).
Significant difference between high-risk and low-risk BSIs (P < .05).
Significant difference between high-risk and no BSI history (P < .05).
Data were missing from 4 participants in the high-risk group for indicated variables.
While the total EDE-Q scores were similar in each group, both the Shape Concern and Eating Concern subscales were significantly higher in the group with previous high-risk BSI versus the low-risk and no BSI groups. Furthermore, women with previous high-risk BSI had a significantly greater difference between their minimum and maximum weight at their current height (11.3 ± 5.4 kg vs 7.7 ± 2.9 kg) compared with participants in the other 2 groups (7.7 ± 2.9 kg [low-risk BSI history] and 7.6 ± 3.3 kg [no BSI history]; P < .05). The women with previous high-risk BSI had the highest rate of history of primary or secondary amenorrhea (66.7%), although this did not reach statistical significance among groups (Table 1). A higher proportion of women with a history of high-risk BSI reported averaging <7 hours of sleep a night during the week compared with those with no previous BSI (80% vs 33.3%; P < .05). No differences were detected in the mean hours per night of weekend sleep (data not shown).
Bone Health and Associated Factors
Lumbar spine z scores were significantly lower in those with previous high-risk versus low-risk BSI. In contrast, total body, total hip, and femoral neck BMD z scores did not differ among groups (Table 1). No group differences were found in bone morphology, density, or estimated strength at the distal radius or tibia as measured by HR-pQCT (Table 2).
Bone Geometry and Microarchitecture According to Study Group a
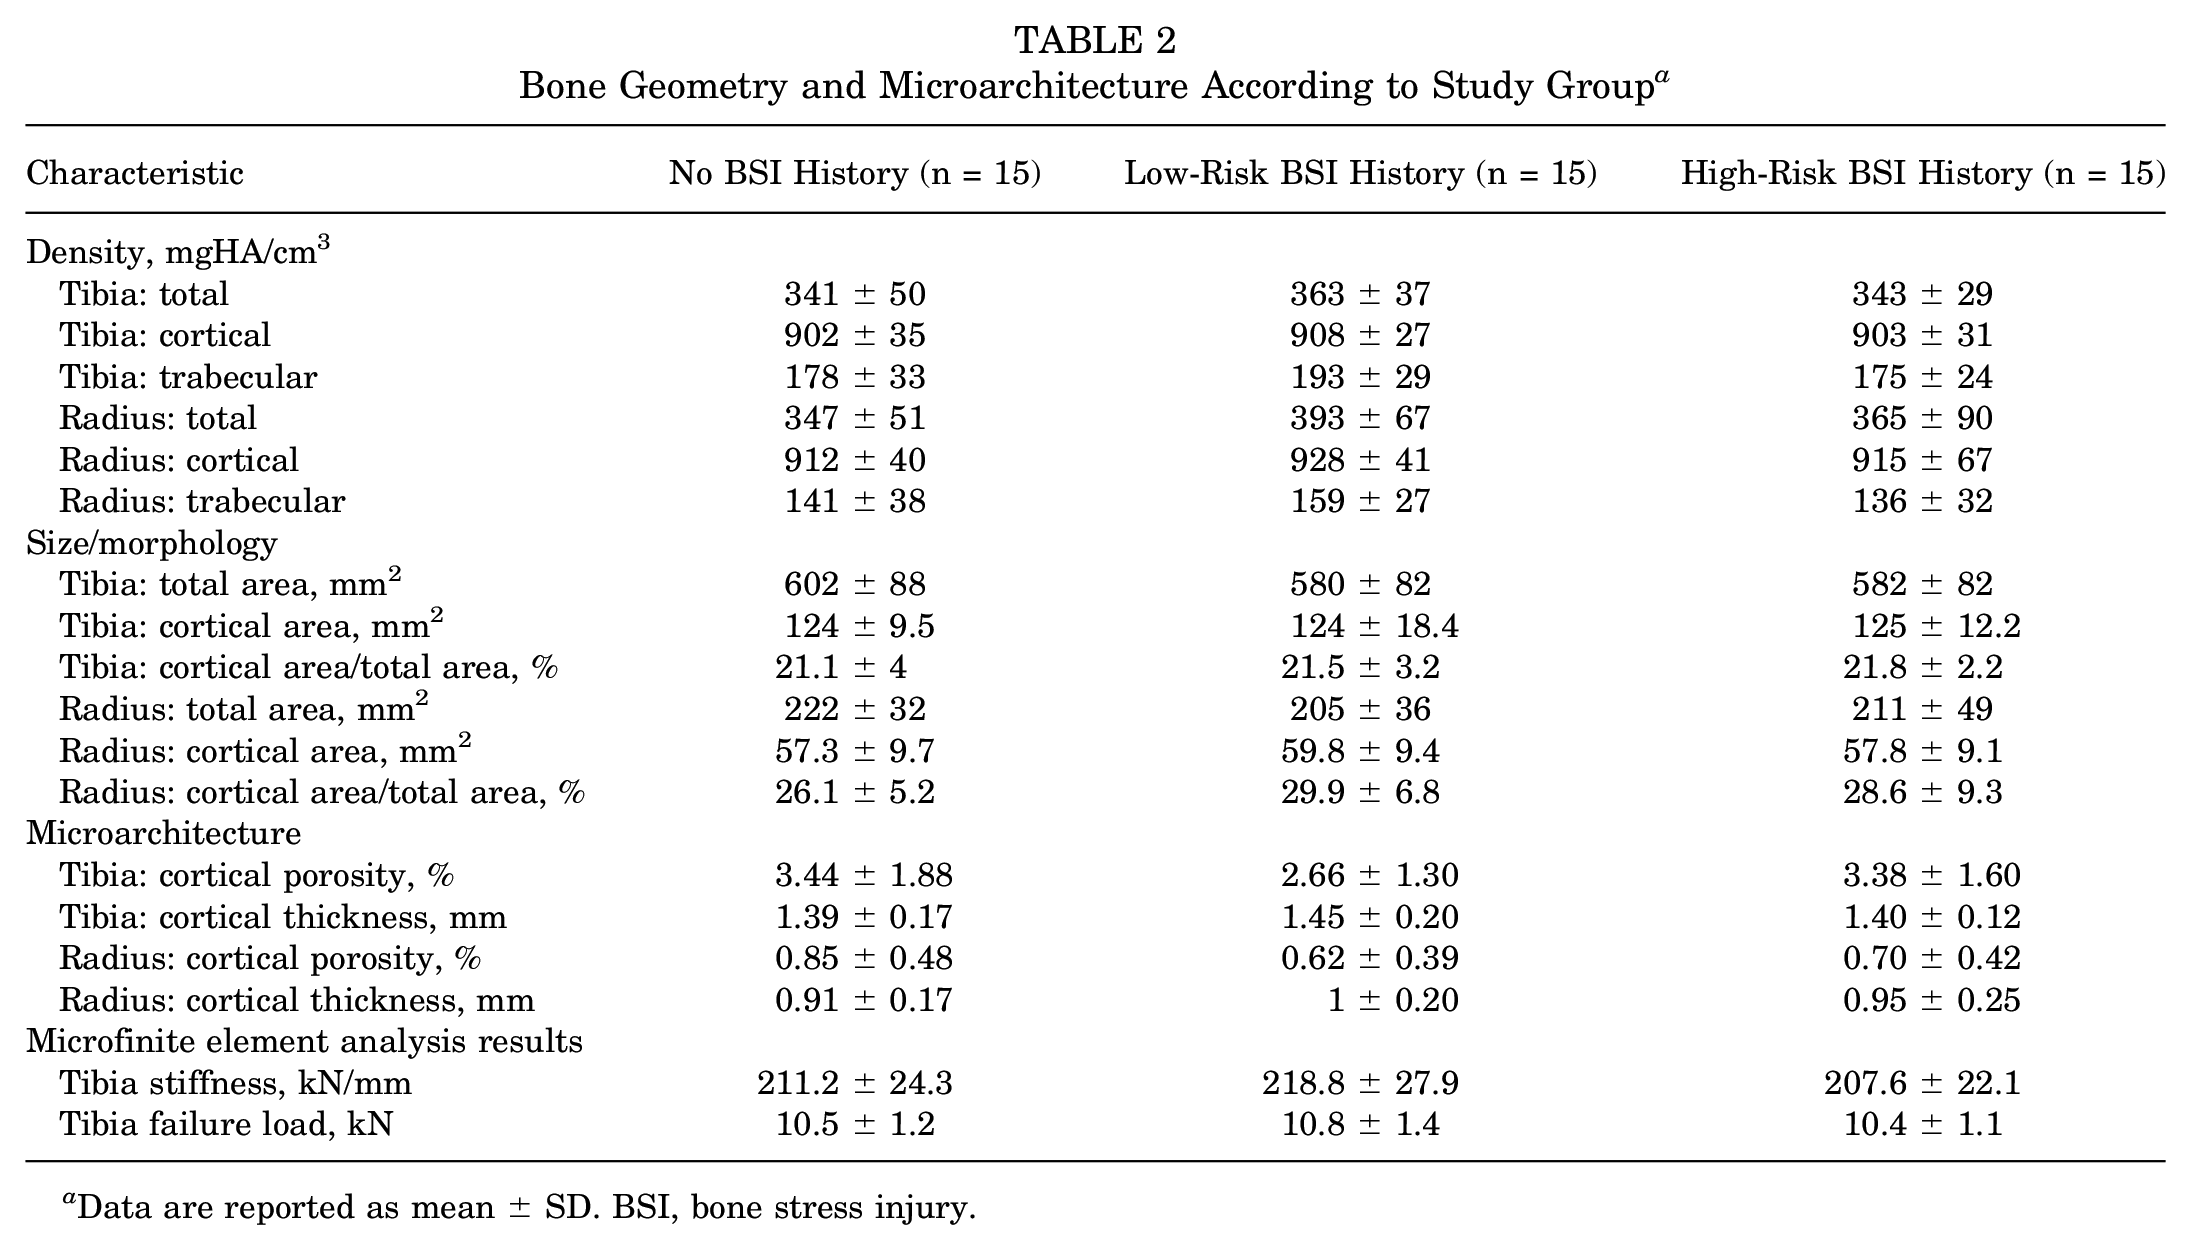
Data are reported as mean ± SD. BSI, bone stress injury.
Running Biomechanics
Participants ran for a mean time of 14.4 minutes at their adjusted 5-km race speed (7.6 ± 0.8 mph [12.2 ± 1.3 kph]) before reaching an RPE value of at least 18 out of 20. No differences in the mean VALR, VILR, or VSIL were observed among the 3 study groups in the fresh or exerted conditions when data were averaged across foot strike patterns (Table 3). The results of the subanalysis on participants who ran with a rearfoot strike pattern (n = 29) demonstrated similar pre-exertion and postexertion VALR and VILR; however, the greatest percentage change in load rates from fresh to exerted conditions was observed in women with previous low-risk BSI versus high-risk BSI and no BSI for both VALR (12.9% ± 12.7% vs 0.6% ± 7.6% and –1.3% ± 7.6%; P < .05) and VILR (11.8% ± 12.2% vs –0.3% ± 7.5% and –1.4% ± 6.6%; P < .05) (Table 4).
Biomechanical Variables According to Injury History a

Data are reported as mean ± SD. BSI, bone stress injury; BW, body weight.
Biomechanical Variables According to Injury History for Runners With a Rearfoot Strike Pattern (n = 29) a
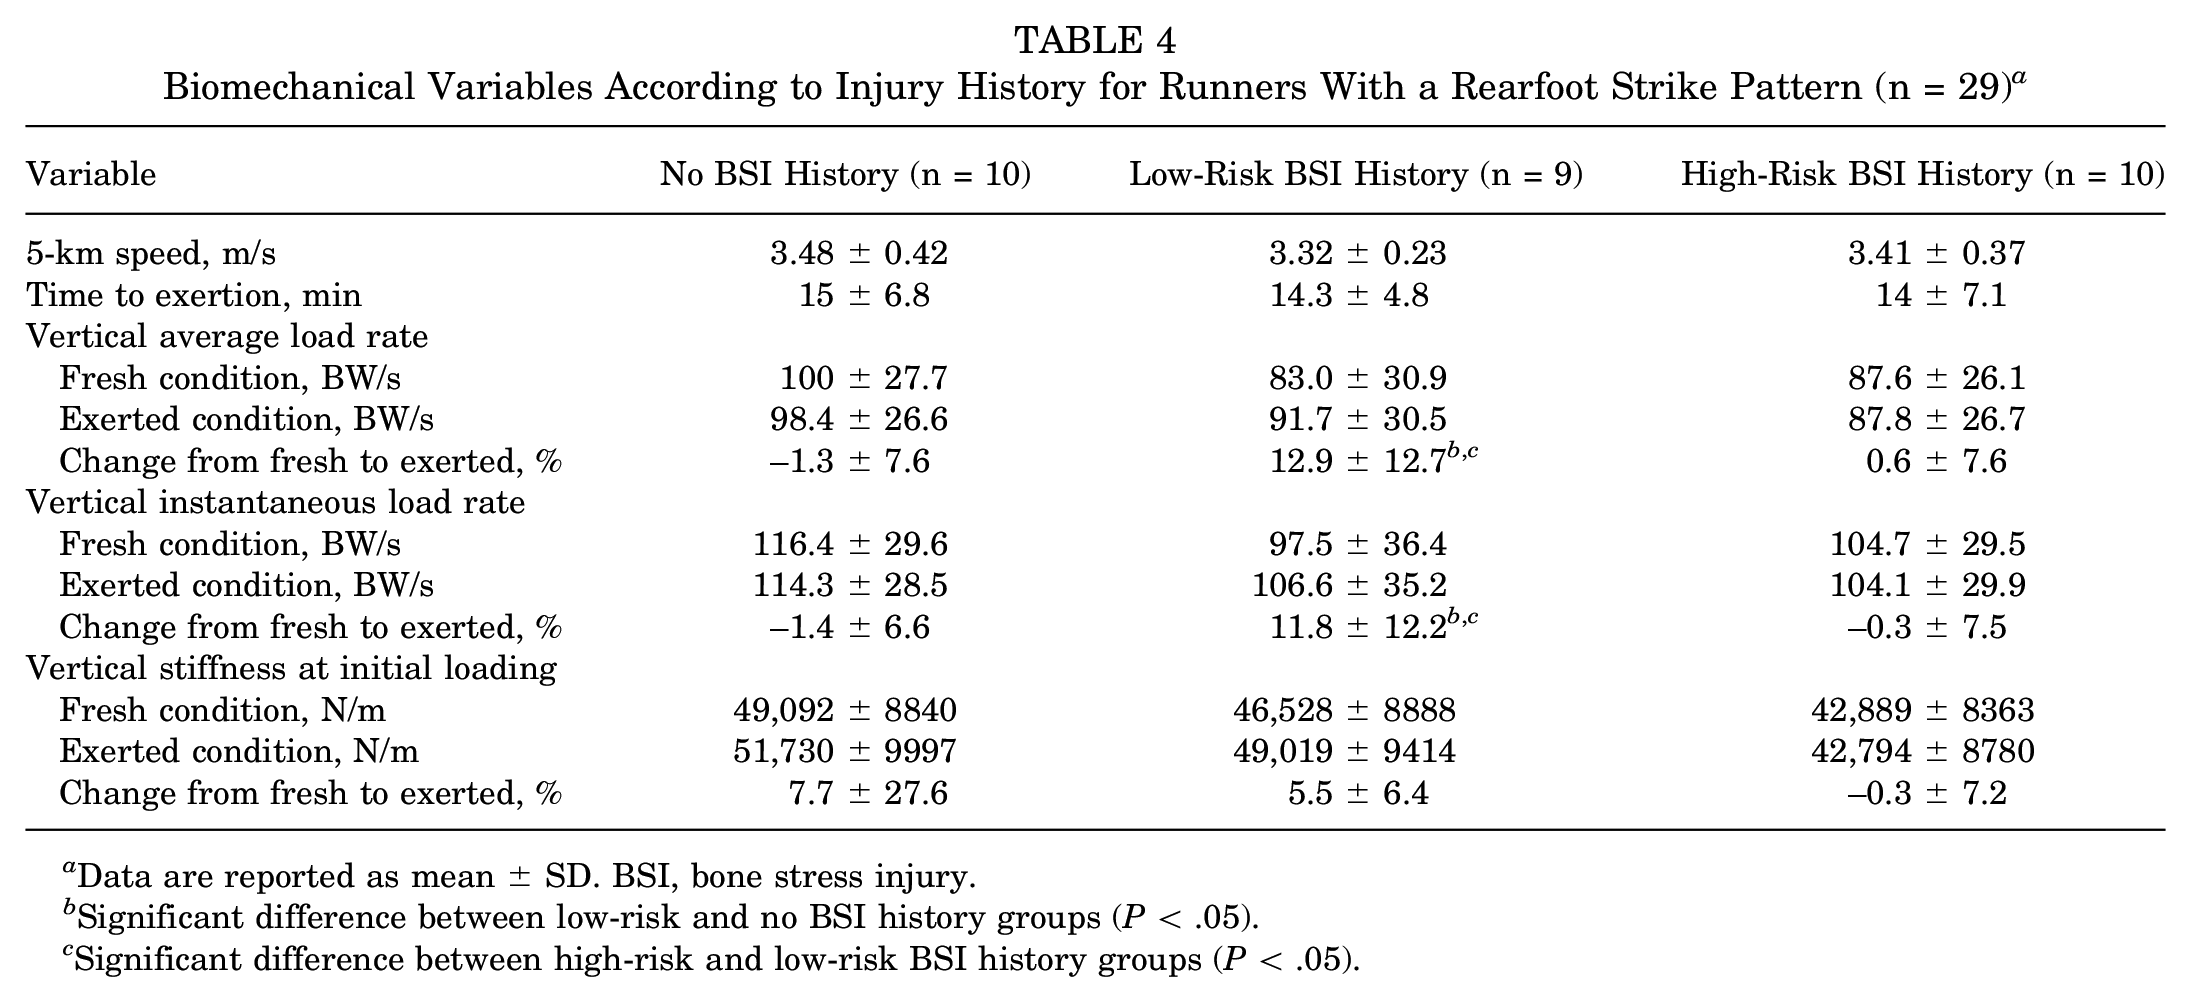
Data are reported as mean ± SD. BSI, bone stress injury.
Significant difference between low-risk and no BSI history groups (P < .05).
Significant difference between high-risk and low-risk BSI history groups (P < .05).
Discussion
This study aimed to characterize differences in factors in female athletes with a history of high-risk BSI, only low-risk BSI, or no BSI. As hypothesized, women with a history of high-risk BSI had lower BMD values than women with previous low-risk BSI. Further, women with previous high-risk BSI displayed a greater prevalence of factors that may contribute to poor bone health, including elevated disordered eating measures, greater changes in body weight at adult height, and sleeping <7 hours per night compared with those in the low-risk BSI or no-BSI cohorts. Contrary to our hypothesis, distal tibia and distal radius bone microarchitecture and estimated strength did not differ among women with a history of BSI. We did not observe differences in load rates between groups at fresh and postexertion conditions. Findings from this study suggest that lower BMD and associated risk factors for poor bone health may be more strongly associated with high-risk BSI. While the study was retrospective and limited to 45 participants, these results may help inform larger studies that can further explore these findings and evaluate other potential risk factors of interest.
The finding of high-risk BSI associated with low BMD is consistent with previous work in other athlete populations,22,34,36 and female athletes with previous high-risk BSI are recommended to have BMD measurements to guide further workup. 7 The presence of low BMD is defined as a BMD or BMC z score <–1 in weightbearing athletes, 27 and nearly half of the women with high-risk BSI in this study had BMD z scores below this cutoff. Differences in bone microarchitecture among the BSI groups were not detected in the tibia or radius using HR-pQCT. While this was unexpected, it is possible that smaller sample sizes (n = 15 per group) led to the current study being underpowered to detect differences. Another explanation for our findings is that measurements performed on the distal radius and tibia did not reflect BSI risk to other anatomic locations, including the pelvis, sacrum, and femoral neck.
Previous work has identified risk factors for BSI and low BMD resulting from the Triad and REDs, each describing the consequences of the low energy availability on menstrual function and bone health in female athletes.7,26 This study adds to the knowledge that the location of BSI may be more strongly associated with low BMD and related health factors contributing to poor bone health. While study exclusion criteria did not allow for enrolling women with previous or current eating disorders, measures from the EDE-Q were elevated for both Shape and Eating Concerns in women with a history of high-risk BSI. Likewise, the largest changes in weight were observed in women with high-risk BSI history. Clinically, not all athletes with a history of BSI have previous DXA to measure BMD, and it is difficult to determine energy availability without performing a detailed assessment of nutrition and exercise patterns. The knowledge that women with previous BSI sustained in the pelvis, femoral neck, or sacrum may be more strongly associated with low BMD can be helpful for clinicians, further prompting them to consider DXA and discuss changes in weight, eating attitudes, and behaviors with women who have a history of these injuries.
Sleep impairments have not been well described as a risk factor for BSI in athletes. Previous work has demonstrated that military recruits in sleep deprivation conditions (eg, 63 hours without sleep or sleeping upright in a chair for 6 hours per night for 3 days) resulted in significant changes in bone metabolism in 40% of participants, including elevated urinary excretion of both calcium and hydroxyproline and associated 5% loss in BMD. 6 A subsequent study demonstrated that mandatory sleep requirements combined with reduced military marching were effective in reducing the rate of BSI in military training by 62% along with 0.5% gain in bone mass for those who remained injury free. 10 While the cross-sectional nature of our present study limited determining causality, it is plausible that these sleep behaviors may impair bone quality and risk for future injury. While participants were asked about the number of hours of sleep, other quality measures were not assessed and could be further evaluated in other research or through standard clinical measures used to assess sleep disorders. The clinical implications of these findings include counseling women with current BSI to optimize sleep for recovery from injury and the importance of optimizing sleep during increased participation in physical activity to reduce risk for BSI.
Our findings regarding load rates were mixed. Previous work has suggested that elevated load rates may be a risk factor for BSI, 41 particularly in female runners with a history of tibial BSI.14,21,24,41,42 Unlike previous work, we did not observe differences in load rates in the pre-exerted conditions between groups. The use of an exertion trial has been reported in 3 previous studies assessing relationships between BSI and running biomechanics.14,29,30 In a study of 32 female runners, those with a history of pelvis or lower extremity BSI showed elevated mean active peak vertical GRFs throughout a run to exertion at an estimated 5 km race pace compared with women with no previous BSI. 29 Another study reported that women with a history of ≥3 lower extremity BSIs were more likely to exhibit greater increases in load rates during a 5-km run to exertion compared with women with no previous BSI. 30 Moreover, during a 45-minute exertion run, women with a history of tibial BSI exhibited greater changes in vertical impacts and forces compared with those with no previous BSI. 14 While we did not observe differences in impacts after exertion in our a priori analyses, we did observe a greater increase in load rates in the exerted condition compared with the fresh condition when evaluating runners with rearfoot strike pattern who sustained injuries in the low-risk BSI cohort compared with the high-risk BSI and no previous BSI groups. Notably, this was an exploratory analysis with relatively small sample sizes, especially when assessing rearfoot strike runners, in whom load rates tend to be highest. Therefore, results should be interpreted with caution. Differences in reported impact variables, exertion protocols, and BSI locations make it difficult to compare findings between existing exertion studies. Further work is needed to better understand the potential relationship between changes in impact forces with exertion and BSI.
Other investigated factors were not associated with BSI history. We did not detect a significant difference in the history of amenorrhea; nonetheless, it was notable that many women reported such a history. Likewise, the history of anemia and mean ferritin values were similar among groups, yet the mean ferritin value was below the proposed target of 35 to 50 μg/L for endurance athletes to promote health and performance. 19 The mean calcium and vitamin D intake and 25-hydroxy vitamin D levels were similar among groups and within the recommended reference values. Given the design of this study, it is possible that female athletes were making dietary corrections due to previous BSI. Regardless, it remains important to evaluate menstrual function and ensure that nutrition status is optimized for bone health in female athletes.
Limitations
While this represents a unique study design to examine the factors associated with low-risk and high-risk BSI, there are limitations. Because of the cross-sectional study design that enrolled women over 1 year after their most recent BSI, so BMD, bone microarchitecture, and some behaviors may have changed compared with the time of injury (eg, menstrual status and food attitudes). Moreover, running biomechanics may have been altered through structured physical therapy, changes in footwear, training behaviors or as a result of BSI. Therefore, we may be assessing the effect of the injury on mechanics and not the cause. The results from this study offer potential markers for real-world clinical decision-making of historical factors of BSI and determine further evaluation to reduce the risk for injury.
Conclusion
The study findings indicated that women with a history of high-risk BSI were more likely to exhibit risk factors for poor bone health—including lower BMD—while load rates did not distinguish women with a history of BSI. Low BMD and behaviors that may affect bone health—including disordered eating tendencies and sleep—are important to quantify in women, particularly those with a history of high-risk BSI. All female athletes with BSI should receive a comprehensive evaluation for BSI risk factors—including assessment of nutrition and sleep—with added consideration of the potential differences in risk by BSI anatomic location. Such a detailed approach to BSI may guide the most effective treatment and prevention strategies.
Footnotes
Acknowledgements
The authors thank the research participants for making this study possible.
Final revision submitted September 11, 2023; accepted October 24, 2023.
One or more of the authors has declared the following potential conflict of interest or source of funding: Funding was received from the Henry M. Jackson Foundation for the Advancement of Military Medicine Inc, the United States Department of Defense and United States Army, and the American Medical Society for Sports Medicine. K.E.A. has received consulting fees from Hologic. AOSSM checks author disclosures against the Open Payments Database (OPD). AOSSM has not conducted an independent investigation on the OPD and disclaims any liability or responsibility relating thereto.
Ethical approval for this study was obtained from Mass General Brigham Inc (ref No. 2016P001695).