
Abstract
Background:
The ideal position of the femoral bone tunnel in the anterior cruciate ligament (ACL) is controversial. The functional importance of the ACL fiber varies depending on where it is attached to the femur. Functionally important fibers can cause high mechanical stress on the bone, and the Wolff law predicts that bone mineral density will increase at high mechanical stress sites.
Purpose/Hypothesis:
The purpose of this study was to use computed tomography imaging to determine the distribution pattern of bone density in the lateral intercondylar wall. It was hypothesized that the high-density area (HDA) of the lateral intercondylar wall would reflect the functional insertion of the ACL as reported in previous anatomic studies.
Study Design:
Descriptive epidemiology study.
Methods:
Data from 39 knees without ACL injuries were retrospectively collected. The HDA of the lateral intercondylar wall was defined as the region containing the top 10% of the radiodensity values. The shape of the HDA was approximated as an ellipse, and the quadrant method was used to determine the center of the ellipse. The association between the ratio of the minor axis to the major axis of the ellipse and background characteristics was investigated.
Results:
According to the quadrant method, the center of the HDA ellipse was 33.6% in the deep-shallow direction and 23.4% in the high-low direction. The center of the ellipse was comparable to the anatomic center of the ACL footprint, as previously reported. The ratio of the minor axis to the major axis of the ellipse was 0.58 (95% CI, 0.54-0.62). There was a significant negative correlation between the ratio of the minor axis to the major axis of the HDA ellipse and the posterior tibial slope (r = −0.38, P = .02).
Conclusion:
The center of the HDA ellipse was found to be similar to the anatomic center of the ACL footprint. Considering the mechanical stress responses in bone, the HDA of the lateral intercondylar wall has the potential to represent the ACL insertion, especially functional insertion.
One of the ultimate goals of anterior cruciate ligament (ACL) reconstruction (ACLR) is to restore normal knee function and stability in all patients. The single-bundle ACLR (SB-ACLR) procedure has long been used to reconstruct an injured ACL. However, biomechanical studies have found that traditional SB-ACLR cannot restore normal anterior translation or rotatory laxity.21,22,25,45 As a result, techniques in which the ACL graft attachment is spread further across the anatomic attachment area have been used. These include anatomic reconstruction of the anteromedial and posterolateral bundles 47 (ie, double-bundle [DB] ACLR) as well as anatomic (ie, placed centrally in the ACL femoral attachment) SB-ACLR procedures.21,42
The precise location of the femoral bone tunnel is critical in ACLR. Therefore, it is important to comprehend the anatomy of the ACL attachment on the femur. However, there has been some debate in previous anatomic studies about the size and location of the femoral attachment of the ACL. According to some studies, the ACL is attached to a relatively narrow oval area on the lateral condyle.8,13,38,47 Other studies have reported that the ACL is attached to a broad area on the lateral condyle, causing the posterior attachment margin to come into contact with the articular cartilage margin.9,14,33,34,48 According to Mochizuki et al, 27 the femoral attachment of the ACL has a dense, direct insertion of the ACL midsubstance fibers as well as a thin, indirect insertion of the fibers that spread out on the posterior condyle, referred to as “fan-like extension fibers.” Iwahashi et al 16 discovered that the direct insertion of the ACL was located in the depression between the resident’s ridge and the articular cartilage margin on the lateral femoral condyle, whereas Sasaki et al 37 reported that the direct insertion was located at the anterior narrow part of the whole ACL insertion. According to biomechanical studies, the direct insertion was important in resisting tibial anterior drawer and rotation.19,36 A biomechanical study by Pathare et al 36 concluded that femoral tunnel positioning for anatomic ACLR was preferable in order to mimic the direct insertion.
It is understood that bones will adapt to the demands placed on them, a concept known as the Wolff law. This law states that bone strength increases in areas of high stress. There are 2 possible physiological responses to bone strengthening: thickening and increasing the bone density.28,43 As a result, the pattern of thickness and density of cortical bone can define areas of high stress in the lateral intercondylar wall of the distal femur, allowing a functional footprint of the ACL to be defined. Norman et al 32 used micro–computed tomography (CT) to reveal the cortical bone thickness of the lateral intercondylar wall of the distal femur and estimated the functional insertion of the ACL based on the pattern of cortical bone thickness of the lateral intercondylar wall.
The purpose of the current study was to use CT imaging to determine the distribution pattern of bone density in the lateral intercondylar wall. We hypothesized that the high-density area (HDA) of the lateral intercondylar wall would reflect the functional insertion of the ACL.
Methods
The protocol for this retrospective study was approved by our institutional review board. The hospital records of 320 consecutive patients who underwent knee surgery at our institution between 2018 and 2020 were reviewed. In our facility, it is protocol to perform imaging on both the injured knee and the contralateral uninjured knee for comparison purposes when taking a CT scan in patients undergoing knee surgery. The study inclusion criteria were (1) patients aged 18 to 40 years at the time of CT scanning and (2) patients who had CT scans of bilateral knees. Excluded were patients with (1) a history of knee surgery or an intra-articular knee fracture, (2) radiographic evidence of degenerative arthritis on the uninjured side, (3) a history of inflammatory disease such as rheumatoid arthritis, and (4) other pathologies that may alter the density of the bone, such as a congenital or acquired skeletal dysplasia.
Of 85 knees that met the inclusion criteria, 46 knees were excluded, leaving 39 knees for the study. The injuries that led to surgery were ACL rupture in 21 patients and other trauma in 16 patients. In all cases, we used the CT images of the contralateral uninjured knees for this study. Figure 1 shows the patient inclusion process.

Flowchart of patient inclusion. CT, computed tomography.
Radiological Evaluation
Full-length anteroposterior radiographs of the whole lower limb with the knee fully extended, as well as lateral radiographs of the knee, were obtained from the patient records. We measured the hip-knee-ankle angle, mechanical lateral distal femoral angle (mLDFA), and mechanical medial proximal tibial angle (mMPTA) on anteroposterior radiographs of the whole lower limb in the single-leg standing position. The angle between a line perpendicular to the mid-diaphysis of the tibia and the posterior inclination of the medial tibial plateau on the lateral view was used to calculate the posterior tibial slope (PTS).
HDA of the Lateral Intercondylar Wall of the Distal Femur
To obtain axial images of the knee, a high-resolution helical CT scanner (Aquilion One/ViSION Edition; Toshiba Medical Systems) was used. The thickness and interval of the slices were both set to 0.5 mm. CT data were obtained and transferred to a personal computer. Axial slices were reconstructed at 0.5-mm intervals using commercial software (Ziocube; Ziosoft Inc) so that slices were parallel to the surgical epicondylar axis 2 in the coronal plane and vertical to the axis of the distal third of the femur in the sagittal plane. The bone density of the lateral intercondylar wall was measured using noncommercial software (OsteoDens 4.0) developed at our institution (Figure 2A).11,17,18,31

(A) Using our proprietary software, the lateral wall of the distal femoral intercondylar notch (yellow line) was automatically identified. In each axial slice, the radiodensity of the identified region (in Hounsfield units [HU]) was measured at each coordinate point at 0.5-mm intervals. (B) The bone density distribution was determined by stacking the data from axial slices, including the radiodensity value at each coordinate point.
The area under the roof of the intercondylar notch was defined as the intercondylar wall. The maximum increment point from the surface was selected as the starting point of the region of interest (ROI), and the maximum point was selected automatically in the 2.5-mm ROI from the starting point. 17 We calculated the radiodensity (in Hounsfield units) of the identified lateral intercondylar wall at each coordinate point at 0.5-mm intervals. By stacking axial slices, a 2-dimensional image that mapped the distribution of bone density on the lateral intercondylar wall was obtained. The differences between the maximum and minimum radiodensity values on the mapping images were divided into 9 grades, and a surface mapping image was generated using these grades to produce a color scale in which red and violet indicated the greatest and lowest bone densities, respectively (Figure 2, B and C).
For the quantitative analysis of HDA, the area under the roof of the intercondylar notch was defined as the ROI (Figure 3A). The quantitative analysis of the obtained mapping data focused on the location of the HDA of the lateral intercondylar wall. A previous anatomic study reported that the area of ACL insertion was approximately 17.8% of the lateral intercondylar wall when excluding the cartilage portion. 15 Additionally, in our preliminary investigation, we examined the proportion of the lateral wall area excluding the cartilage portion to the total area of the lateral wall including the cartilage portion in a lateral distal femoral image reconstructed from 3-dimensional CT; this proportion was found to be 59.1% ± 4.9%. Therefore, considering that the ACL attachment to the ROI was approximately 10% of the lateral wall including the cartilage portion, we set the HDA to the region containing the top 10% of radiodensity values within the ROI (Figure 3B).

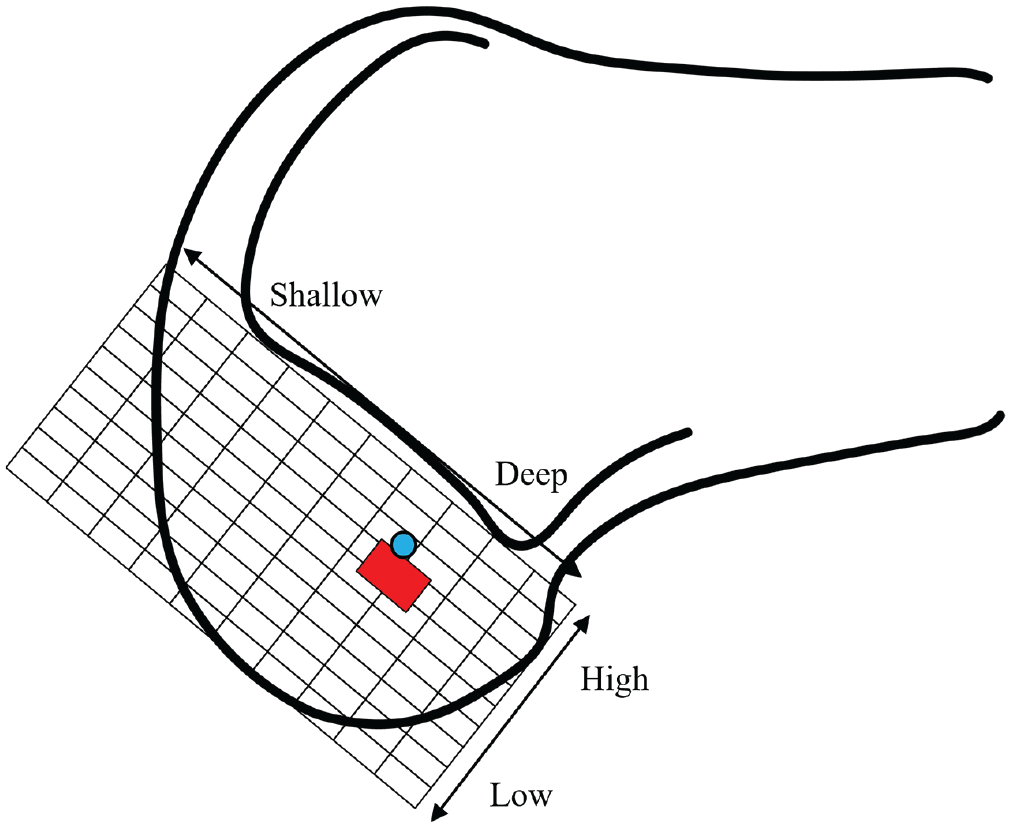
Finding the center of the high-density area (HDA) of the lateral intercondylar wall. (A) The area below the Blumensaat line (black line) was set as the region of interest (ROI) (dark gray area). (B) The HDA was defined as the top 10% of bone density within the ROI (red shaded area). (C) Automatic approximation of the red shaded area to an ellipse using ImageJ software. (D) The center of the HDA ellipse was measured using the grid system of the quadrant method. The center of the HDA (blue circle) is located 34% in the deep-shallow direction and 34% in the high-low direction. (E) The ratio of the minor axis, m, to the major axis, M, of the ellipse (m/M) and (F) the angle of the major axis of the ellipse to the Blumensaat line (θ) were measured.
The shape of the HDA was approximated to an ellipse using ImageJ (National Institutes of Health) (Figure 3C). The size of the ellipse was set to be >50% of the HDA because it was found that 50% was the value that approximated the HDA to an ellipse in all cases. The size of the ellipse in relation to the HDA was a mean of 82%. Then, the grid system used in the quadrant method by Bernard et al 3 was used to determine the location of the center of the ellipse on the lateral intercondylar wall (Figure 3D). The terminology used in the quadrant method for locating the center of the ellipse on the grid was based on the arthroscopic terminology used in the original quadrant method. 3 The center of ellipse, the length of the major axis (M), and the length of the minor axis (m) were calculated by ImageJ. We also calculated the ratio of the minor axis to the major axis (m/M in Figure 3E) and the angle of the major axis of the ellipse to the Blumensaat line (θ in Figure 3F).32,41
Statistical Analysis
Statistical analyses were performed using JMP Pro Version 14.0 (SAS Institute Inc). The level of significance was set at P < .05. Using Pearson correlation analysis, we investigated the relationship between the ratio of the minor axis to the major axis of the HDA ellipse and other parameters.
Post hoc power analysis revealed that for an alpha value of .05 and power of 0.72, a sample size of 35 knees was needed for the correlation between the ratio of the minor axis to the major axis of the HDA ellipse and PTS.
Results
The 39 knees that were evaluated were from 16 male and 23 female patients, with a mean age of 29.6 years (95% CI, 25.4-33.9 years). Details regarding patient characteristics and leg alignment are shown in Table 1.
Patient Characteristics and Leg Alignment a

Data are reported as mean (95% CI) unless otherwise indicated. HKA, hip-knee-ankle; mLDFA, mechanical lateral distal femoral angle; mMPTA, mechanical medial proximal tibial angle; PTS, posterior tibial slope.
According to the quadrant method, the center of the HDA ellipse was 34.3% (95% CI, 33.4%-35.2%) in the deep-shallow direction and 24.9% (95% CI, 22.7%-27.1%) in the high-low direction. The normal range of the center of the ACL attachment site was reported to be 24% to 37% in the deep-shallow direction and 28% to 43% in the high-low direction in a previous study. 35 When overlaying these 2 locations, we found the center of the HDA ellipse to be comparable to the anatomic center of the ACL footprint, as previously reported 35 (Figure 4).
The location of the mean center of the high-density area (HDA) on the grid of the quadrant method in the current study and the normal range of centers of anterior cruciate ligament (ACL) insertion reported in a previous systematic review. 35 (A) The mean center of the ellipse by which the HDA was approximated (blue circle) was 33.6% in the deep-shallow direction and 23.4% in the high-low direction. The normal range of the center of the ACL attachment site (red rectangle) was previously reported to be 24% to 37% in the deep-shallow direction and 28% to 43% in the high-low direction. 35
Representative images of the HDA and its corresponding ellipse are shown in Figure 5. The overall ratio of the minor axis to the major axis of the ellipse was 0.58 (95% CI, 0.54-0.62). The angle between the major axis of the ellipse and the Blumensaat line was 55.4° (95% CI, 44.6°-66.8°). There was a significant negative correlation between the ratio of the minor to the major axis of the ellipse and the PTS (r = −0.38, P = .02) (Table 2).

Two representative images of the high-density area (red shading) and its corresponding ellipse. (A) The ratio of the minor axis to the major axis of the ellipse was 0.70. (B) The ratio of the minor axis to the major axis of the ellipse was 0.29.
Correlation Between the Ratio of the Minor Axis to the Major Axis of the Ellipse and Patient Characteristics and Leg Alignment a
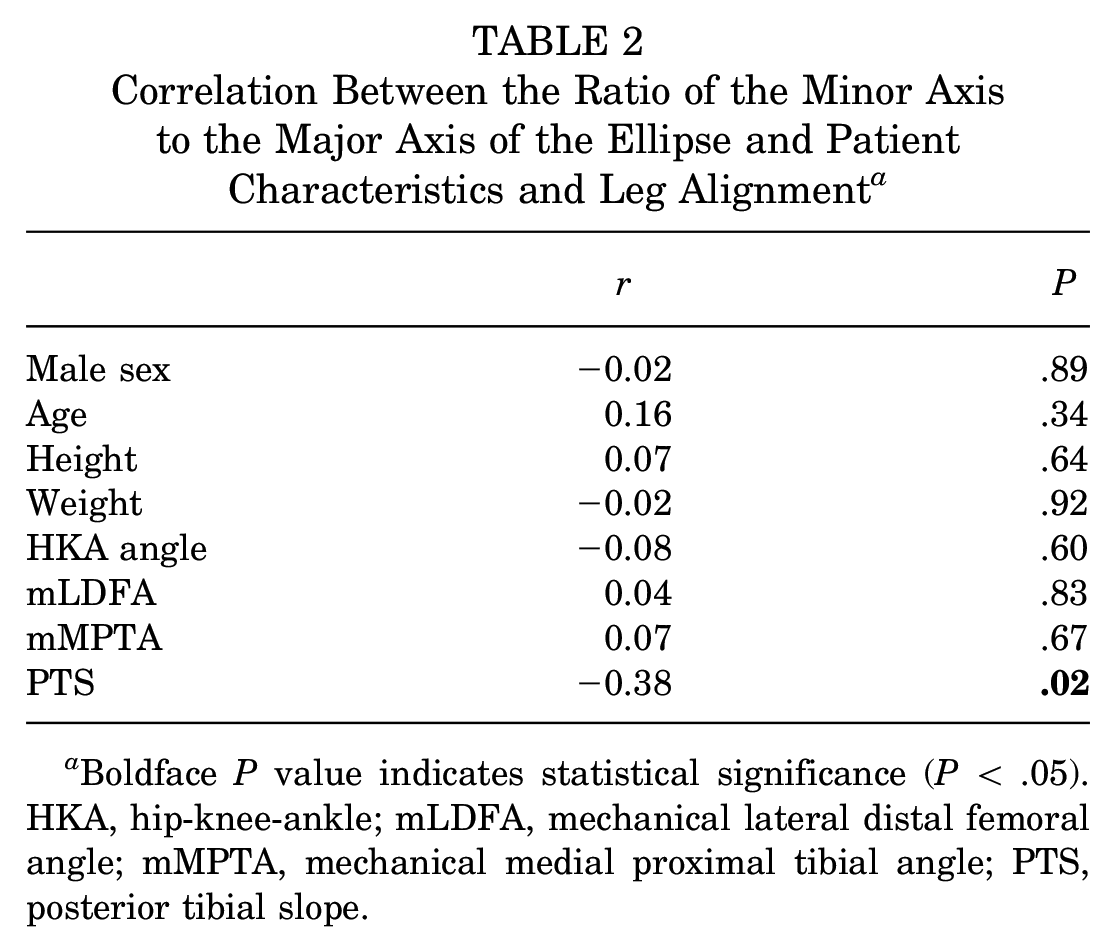
Boldface P value indicates statistical significance (P < .05). HKA, hip-knee-ankle; mLDFA, mechanical lateral distal femoral angle; mMPTA, mechanical medial proximal tibial angle; PTS, posterior tibial slope.
Discussion
The most important finding of this study was that the center of the HDA at the lateral intercondylar wall of the distal femur when approximated to an ellipse was 33.6% in the deep-shallow direction and 23.4% in the high-low direction according to the quadrant method, and that this location was comparable to the previously reported anatomic center position of the ACL footprint. 35 Moreover, a significant negative correlation was observed between the ratio of the minor axis to the major axis of the HDA ellipse and the PTS (r = −0.38, P = .02).
The bone remodels in response to mechanical stresses. 44 Responses to loading stress include cortical bone thickening and an increase in bone mineral density in trabecular bone. 6 Norman et al 32 speculated that a thickened area in the lateral intercondylar wall of the distal femur was a potential ACL attachment site due to traction stress of the ACL, based on these mechanical stress responses in bone. Their study showed that the location of the center of the thickened area by the quadrant method was 31% in the deep-shallow direction and 23.5% in the high-low direction. 32 The ratio of the minor axis and major axis was about 2. The center and ratio of the HDA ellipse were similar to those of cortical bone thickness. A recent biomechanical study reported that cortical bone density was another response to impact loading reported. 28 Considering the similarity in the location of the center and shape of the HDA and the thickened area, 32 it may be reasonable to consider the region of HDA and the thickened part of the cortical bone in the lateral intercondylar wall of distal femur as almost the same. However, the study by Norman et al 32 requires the use of micro-CT, which is not typically available in regular clinical practice. In contrast, our method allows bone density evaluation using conventional CT imaging, which provides the advantage of being able to perform surgical planning based on the preoperative HDA morphology.
A previous systematic review of the quadrant method to evaluate the location of the ACL insertion site in the lateral intercondylar wall of the distal femur reported that the normal range of the center of the attachment site was 24% to 37% in the deep-shallow direction and 28% to 43% in the high-low direction. 35 When comparing the locations reported by previous studies to our results, the center of the ellipse by which the HDA was approximated was similar to the location of the ACL insertion (Figure 4), supporting the idea that the HDA in the lateral intercondylar wall of the distal femur could reflect the ACL insertion as well as cortical bone thickness.
There are 2 types of ACL insertions: direct and indirect. Direct insertion is known to be more functional for anterior translation than indirect insertion. 29 According to Sasaki et al, 37 the anterior ACL insertion was the direct insertion, and the posterior ACL insertion was the indirect insertion in the total insertion area. In comparison to previous studies, the location of HDA was shallower,7,10,19,39 suggesting that it has the potential to represent the ACL insertion, especially direct insertion. The location of the HDA could provide information about the functional insertion of the ACL for the purposes of reconstruction surgery.
We found that there was a significant negative correlation between the ratio of the minor axis to major axis of the HDA ellipse and PTS, and that the angle between the Blumensaat line and the major axis of the ellipse was 52°, indicating that the functional attachment of ACL fibers was more round as the tibial slope became steeper. Conversely, the distribution pattern of the functional attachment of ACL fiber was band-like in the posterodistal direction as the tibial slope became flat. A recent study found that DB-ACLR was biomechanically superior to SB-ACLR in rotatory stability. 30 It is widely accepted that anterior-posterior stability is mainly provided by the anteromedial bundle with mild flexion or more.12,20 Additionally, it was reported that a steep PTS increased the tension on ACL. 4 Considering these results, the following scenarios are possible: When there is a steep posterior slope, the tension on the ACL increases, placing a greater burden on the anteromedial bundle while relatively reducing the burden on the posterolateral bundle. Conversely, when the posterior slope is flat, the burden on the anteromedial bundle decreases, which is thought to result in a relative increase on the posterolateral bundle. The relationship between the distribution pattern of HDA and PTS might support this scenario. Based on the above, SB-ACLR was thought to be adequate for patients with a steep PTS. In contrast, DB-ACLR was required in cases with a flat PTS.
Because the main ACL fiber has 2 bundles,1,13 it was thought that DB-ACLR was a more anatomic procedure than SB-ACLR. A recent study found that DB-ACLR was biomechanically superior to SB-ACLR in rotatory stability. 30 However, systematic reviews comparing clinical outcomes of SB-ACLR and DB-ACLR concluded that whether DB-ACLR restores rotatory stability compared to SB-ACLR remains inconclusive. Previous systematic reviews have concluded that DB-ACLR was superior to SB-ACLR in terms of knee stability but not in function,23,26,46 whereas a recent review concluded that there was no difference in function or knee stability. 24 The present study found that the morphology of HDA was not distributed in a band-like pattern in half of the cases, suggesting that the functional femoral insertion site was close to an SB in half of the cases, and furthermore, in these cases, there was a possibility that there was no difference in knee stability regardless of whether the reconstruction technique was SB-ACLR or DB-ACLR. The distribution pattern of functional insertion might cause no significant difference in function or knee stability between SB-ACLR and DB-ACLR.
Limitations
The current study has several limitations that should be considered. The first and major limitation was that the association between HDA and the anatomic insertion of ACL was not established. To prove the association between HDA and the anatomic insertion of ACL, additional scientific data are needed. However, there were the similarities in the location of the HDA and ACL attachment site reported by previous anatomic studies, supporting the idea that the HDA reflected the ACL attachment site. Second, we investigated the HDA in non–ACL-injured knees, so our findings may differ from the HDA distribution found in ACL-injured knees. It has been reported that bone mineral density at the footprint of the rotator cuff decreased after rotator cuff tear.5,40 Thus, it is unclear whether and when HDA changed after ACL rupture. Further research is planned into the difference in HDA between ACL-injured knees and contralateral ACL-intact knees or the changes in HDA during the waiting period from injury to surgery. However, this is the first study to posit a link between the distribution of bone density in the lateral intercondylar wall of the distal femur and the ACL attachment site. We believe that the findings of this study can form the foundation of further studies on the functional attachment site of the ACL.
Conclusion
We investigated the distribution pattern of bone density of the lateral wall of the intercondylar notch using conventional CT. The center of the HDA ellipse in the lateral intercondylar wall was found to be consistent with previous anatomic studies. Considering the mechanical stress responses in bone, the HDA has the potential to represent the functional insertion site of the ACL. Additionally, the correlation between the HDA’s roundness and PTS suggests that SB-ACLR may be appropriate for cases with a steep slope. Preoperative assessment of the HDA distribution in the lateral intercondylar wall can provide valuable information for surgeons planning ACLR.
Footnotes
Final revision submitted September 1, 2023; accepted September 11, 2023.
One or more of the authors has declared the following potential conflict of interest or source of funding: Research support was received from Olympus Terumo Biomaterials and by a grant-in-aid from the Ministry of Education, Culture, Sports, Science, and Technology, Japan (grant 21K16672). AOSSM checks author disclosures against the Open Payments Database (OPD). AOSSM has not conducted an independent investigation on the OPD and disclaims any liability or responsibility relating thereto.
Ethical approval for this study was obtained from Hokkaido University Hospital, Sapporo, Japan (reference No. 017-0163).