
Abstract
Background:
An updated National Hockey League (NHL) concussion protocol (NHLCP) was established in the 2016-2017 season to mitigate the negative outcomes of sport-related concussions. However, few studies on the effects of implementing the NHLCP have been performed.
Purpose:
To define concussion incidence and investigate differences in NHL player performance after a concussion during periods before and after NHLCP implementation and assess the financial impact on NHL teams associated with NHLCP implementation.
Study Design:
Cohort study; Level of evidence, 3
Methods:
This was a retrospective review of NHL players who sustained a concussion before (2000-2001 to 2015-2016 seasons) and after (2016-2017 to 2020-2021 seasons) implementing the NHLCP (pre-NHLCP and post-NHLCP groups). For each group, multiple performance metrics—including 30 days, 1 season, and 3 seasons before and after concussion—were compared for both groups. Return to play, total concussion cost, and association of return to play with cost were investigated using regression analysis.
Results:
A total of 452 players (423 skaters, 29 goalies) sustained concussions during the study period, including 331 players (315 skaters, 16 goalies) in the pre-NHLCP group and 121 players (108 skaters, 13 goalies) in the post-NHLCP group. For both groups, no significant differences in standard performance were observed during the 30-day and 1-season periods before and after concussion. The mean return to play was significantly higher in the pre-NHLCP group than in the post-NHLCP group (20.1 vs 15.7 days; P = .022). The mean adjusted player salary was not different between groups; nonetheless, the mean adjusted replacement player salary was significantly higher in the post-NHLCP group ($744,505 vs $896,942; P = .032). The mean cost of time missed did not differ between groups. The mean return to play time significantly decreased over the entire study period (R2 = 0.33; P = .005), and the mean return to play time was positively associated with cost R2 = 0.215; P = .030).
Conclusion:
Concussion incidence did not change after implementation of the updated NHLCP; nonetheless, players had significantly less missed time from injury after protocol implementation. Changes in player performance 30 days and 1 year before and after concussion injury were not different before and after NHLCP implementation. No differences were found in the financial cost of concussions between the pre- and post-NHLCP groups, and missed time was significantly correlated with mean cost from missed time.
Ice hockey, specifically at the professional level in the National Hockey League (NHL), is a fast-paced, highly physical contact sport. Because of the intense physical nature of hockey, many players will experience some injury during their career, many of which will be significant enough to cause missed game time. 2 Of these injuries, concussions are prevalent, with an incidence of up to 5.8 to 6.1 per 100 games.2,3 Concussions are considered a form of mild traumatic brain injury, and the pathogenic mechanism involves diffuse axonal injury due to the shearing of axons in the brain. 29 Overall, concussions have short-term, severe effects on performance18,24 and cause long-lasting changes in both cerebrovascular and cognitive function.4,25 These changes have been linked to cognitive decline, neurobehavioral changes, and neurodegenerative disease.13,14 Concussions can also pose significant financial costs to professional hockey teams, causing a salary loss of up to US$40 million per year. This accounts for the largest proportion of any injury likely due to the higher average cost of salary lost per concussion compared with other injuries.7,10,28
Because of an increased understanding of the serious effects of concussions, the NHL has created several programs to monitor and improve concussion outcomes among its players.16,17 In 1997, the NHL began to collect data on the incidence of concussions.3,11 During the 2010-2011 and 2011-2012 seasons, the NHL introduced a rule to eliminate blindside hits to the head and implemented the first NHL concussion protocol (NHLCP),3,11,16,17 which served as the NHL's standardized set of rules to guide the management of concussions. In the 2016-2017 season, because of concern over players not being appropriately removed from play, 2 the NHLCP was updated to its current form—including mandatory concussion education, the NHL Paper and Pencil test battery, and the ImPACT baseline test—in addition to the X2 Sports Concussion Assessment Tool that was already being utilized. 16 The new protocol included professionally trained spotters who could remove players when a concussion was suspected and game recordings that could be used to review injuries. While mandatory removal of a player showing concussive symptoms for evaluation was previously required, the update more clearly and comprehensively defined these criteria. Concussion was a clinical diagnosis made by a team physician both before and after NHLCP; nevertheless, the updates in 2016-2017 undoubtedly aided in making this diagnosis. The new protocol also introduced criteria for returning to play after concussion diagnosis, including complete recovery of symptoms at rest, no reemergence of symptoms at exertion levels consistent with competitive play, and return to neurocognitive baseline testing as determined by evaluation with a consulting neuropsychologist.18,19
Previous studies of various sports have shown that concussion incidence increases after the implementation of enhanced concussion protocols without significant impacts on player performance.6,15,19,21,22,23,26 While this is true for other professional sports, few studies have specifically looked at concussions in the NHL after the 2016-2017 protocol update. Furthermore, no studies have looked at differences in athlete performance or changes in financial effects before and after NHLCP implementation.
This study aimed to define concussion incidence and investigate differences in NHL player performance after a concussion injury during periods before and after implementation of the 2016-2017 updated NHLCP. Our secondary aim was to assess the financial impact on NHL teams associated with the implementation of the new NHLCP. We hypothesized that concussion incidence would increase and player performance would remain the same after NHLCP implementation.
Methods
Study Design
A retrospective review of NHL players who had sustained a concussion between the 2000-2001 to 2020-2021 seasons was performed. Players who had missed games because of injury were identified by searching the terms “concussion” and “head injury” in an online database, Pro Sports Transactions (https://www.prosportstransactions.com). This website utilizes hundreds of sources, including but not limited to magazine and newspaper articles, media guides, books, and the internet to ensure its database is up-to-date. Players identified were confirmed as having had a concussion using individual team injury reports. The following information was collected for all players who sustained a concussion: type of injury; return to play date; identification of players who replaced the injured player (identified as having had a corresponding roster move within 5 days of the injured player's injury date); and injury mechanism (contact, puck, and unknown). Contact injury mechanism included concussions caused by colliding with the ice, the boards, or another player; puck injury mechanism included concussions caused by contact with the puck; and unknown injury mechanism concussions where the play that caused the injury was not obvious or disclosed by reports or articles. Players who were not goalies are referred to as “skaters” in this study.
Players who sustained concussions during the NHL regular season or postseason were included. Players who were injured during the preseason or in the minor leagues, players who did not return during the index season, and players who sustained multiple concussions were excluded. Players who missed >5 consecutive games during the 30-day interval before or after concussion were excluded from the 30-day interval performance analysis. Players who sustained a concussion during the 2020-2021 season were excluded from the 1-season interval performance analysis. Players who sustained concussions from 2018 to 2021 were excluded from the 3-season interval performance analysis. Players who sustained a concussion before the updated NHLCP was implemented (2000-2001 to 2015-2016 seasons) were included in the pre-NHLCP group. Players who sustained a concussion after the NHLCP was implemented (2016-2017 to 2020-2021 seasons) were included in the post-NHLCP group. Concussion incidence, player characteristics, player performance, and costs were compared between groups.
Data Collection
The following information about player characteristics was collected: players’ age; team; position; number of seasons played at the time of concussion; and career length. Standard performance data were collected for the following time intervals: 30 days; 1 season; and 3 seasons before and after the players’ concussion. The season of injury was the index season. The time periods selected were to capture the short-, mid-, and long-term association of the players’ concussions with athletic performance. Standard data recorded for skaters included number of games, time on ice, goals, assists, points, plus/minus (player-goal differential), penalty minutes, shots made, and shooting percentage. Standard performance data for goalies included games, time on ice, wins, losses, overtime losses, shots against, saves, save percentage, goals against, and shutouts. Player statistics were collected from the Stathead Hockey database (https://stathead.com/hockey) and were cross-referenced against the NHL database (https://www.nhl.com/stats). Advanced sabermetric performance data were only available for players from 2008 to 2021. Sabermetric performance data were collected in intervals of 1 season and 3 seasons before and after the index season, including Corsi, Fenwick, and PDO. Corsi is the sum of all shot attempts for the player's team divided by all shot attempts for the opposing team while the player is on the ice; Fenwick is similar but excludes blocked shots by opposing players. PDO is the sum of the shooting and save percentages of the player's team while the player is on the ice. 9
Financial Analysis
A financial analysis was also conducted. Player and replacement player annual salaries during the season of the concussion were determined using the CapFriendly database (https://www.capfriendly.com) and cross-referenced against 2 others (Puckpedia [https://puckpedia.com] and Spotrac [https://www.spotrac.com]). Salaries were adjusted for inflation to equate to 2021 US dollars. Return to play was calculated as the days between the player's injury and return. The total cost of return to play was computed using an accepted formula. 5 The mean length of the NHL season from 2000 to 2021 was 249 days, excluding the 2004-2005 and 2012-2013 seasons, which were affected by lockouts, and the 2019-2020 and 2020-2021 seasons, which were shortened by the COVID-19 pandemic. The players’ and replacement players’ daily salaries were calculated by dividing the annual salary by 249 days. The player and replacement players’ costs of return to play were determined by multiplying the daily salary by the number of days missed. The total cost of return to play was calculated by adding the player and replacement player's cost of the return to play time.
Statistical Analysis
All analyses were performed using SPSS Statistics 28.0.1.1 (IBM). Descriptive statistics were calculated with categorical data reported as counts with percentages and continuous data as mean ± standard deviation. To evaluate categorical data, 2-group univariate comparisons were analyzed using the chi-square test for values ≥5 and the Fisher exact test for values <5 before and after implementing the 2016-2017 NHLCP change. Continuous variables were analyzed using the 2-sample t test for normally distributed variables and the Wilcoxon rank-sum test for nonnormally distributed variables before and after implementing the 2016-2017 NHLCP change. For each study group, changes in the mean player performance data during time periods before and after the concussion injury (30 days, 1 season, and 3 seasons) were analyzed with the paired t test for normally distributed variables and the Wilcoxon signed-rank test for nonnormally distributed variables. Linear regression analysis assessed trends in return to play and cost of concussion over time. Statistical significance was considered P < .05.
Results
Concussion Incidence
A total of 452 players (423 skaters, 29 goalies) sustained concussions during the study period, including 331 players (315 skaters, 16 goalies) in the pre-NHLCP group and 121 players (108 skaters, 13 goalies) in the post-NHLCP group. A total of 543 concussions occurred (508 skaters, 35 goalies), including 406 concussions (388 skaters, 18 goalies) in the pre-NHLCP group and 137 concussions (120 skaters, 17 goalies) in the post-NHLCP group. In the pre-NHLCP group, 267 players had 1 concussion, 55 had 2 concussions, 7 had 3 concussions, and 2 had 4 concussions. In the post-NHLCP group, 107 players had 1 concussion, 13 had 2 concussions, and 1 had 4 concussions. The time between first and second concussion in the pre-NHLCP group was 984.4 ± 944.7 days versus 572.83 ± 472.8 days in the post-NHLCP group (P = .024). A mean of 25.9 concussions occurred per season across our entire study period, with a mean of 25.4 concussions per season in the pre-NHLCP group and a mean of 27.4 concussions per season in the post-NHLCP group (P = .756) (Figure 1).

Total number of concussions per year for NHL players from 2000 to 2021. The panel shows the number of concussions per year for goalies (blue line) and skaters (orange line). “Skaters” means any player who was not a goalie. The dashed line indicates the year the updated NHLCP was implemented. NHL, National Hockey League; NHLCP, National Hockey League concussion protocol.
Player Characteristics
The mean age at the time of concussion was 27.5 ± 4.7 years in the pre-NHLCP group and 26.3 ± 4.3 years in the post-NHLCP group. Career length was significantly different (P < .001) between the pre-NHLCP and post-NHLCP groups at 11 ± 4.4 seasons and 8 ± 4 seasons, respectively. However, number of seasons played at time of concussion was not significantly different between the groups (pre-NHLCP 6.3 ± 4.5 and post-NHLCP 5.4 ± 3.8 seasons). Player position (P = .005) and injury mechanism (P = .001) were significantly different between groups (Figures 2 and 3). Defensemen (35.5%), followed by centers (22.7%), left wings (19.5%), right wings (18.0%), and goalies (4.4%) had the most concussions in the pre-NHLCP group. Centers (28.5%), followed by defensemen (26.3%), left wings (17.5%), right wings (15.3%), and goalies (12.4%) had the most concussions in the post-NHLCP group. In both groups, the most frequent mechanism of injury was contact (pre-NHLCP 72.2% and 73% post-NHLCP), followed by unknown (pre-NHLCP 25.1% vs post-NHLCP 17.5%). Fewer injuries were caused by the puck in the pre-NHLCP group (2.7% vs 9.5%).

Percentage of total concussions by NHL player position (A) before and (B) after implementation of the 2016-2017 updated NHLCP. There was a significant difference (P = .005) in concussions by position before versus after implementation of the updated concussion protocol. NHL, National Hockey League; NHLCP, National Hockey League concussion protocol.
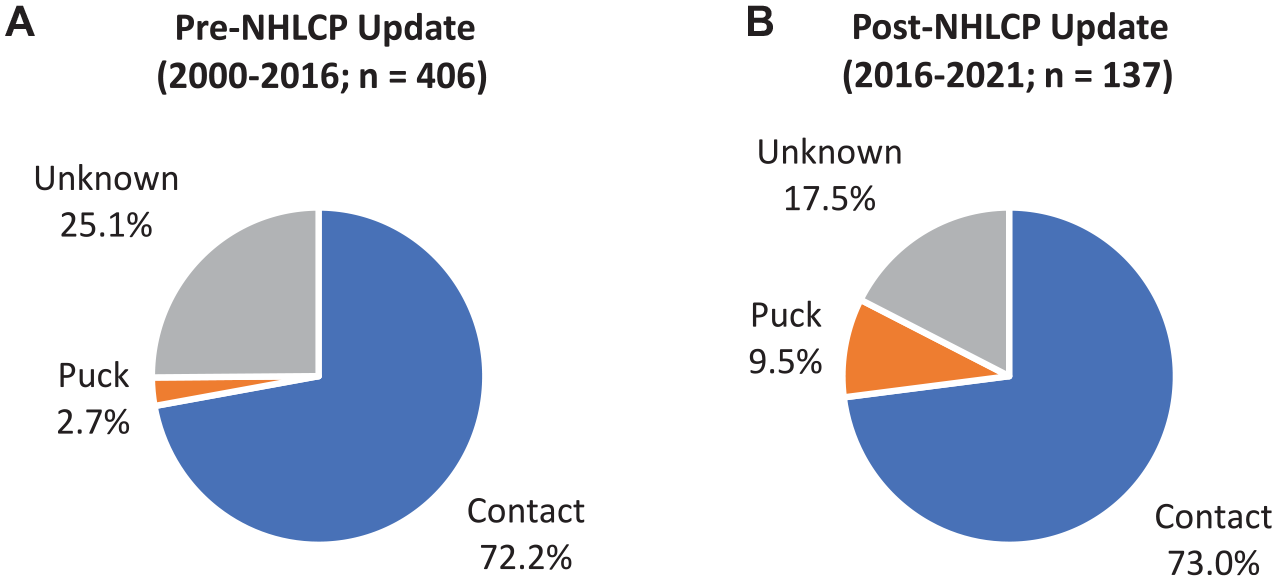
Percentage of total concussions by mechanism of injury (A) before and (B) after implementation of the 2016-2017 updated NHLCP. Contact injuries included collisions with ice, boards, or other players. Puck injuries included those caused by contact with the puck. There was a significant difference (P = .001) in concussions by mechanism before versus after implementation of the updated concussion protocol. NHLCP, National Hockey League concussion protocol.
Thirty-Day Interval Standard Performance
We asked whether players (skaters and goalies) before and after implementation of the NHLCP had significant changes in mean performance metrics during specific periods before and after sustaining a concussion. No significant differences in standard performance for skaters and goalies 30 days before and after concussion injury were observed in either group (Table 1).
Comparison of Standard Performance Metrics of Skaters and Goalies 30 Days Before and After Concussion a

Data are reported as a mean number of events unless otherwise indicated. NHL, National Hockey League; NHLCP, the 2016-2017 NHL updated concussion protocol; PIM, penalty minutes; TOI, time on ice.
Before the 2016-2017 NHL updated concussion protocol.
After the 2016-2017 NHL updated concussion protocol.
One-Season Interval Standard Performance
Skaters in the pre-NHLCP group, post-NHLCP group, and overall did not significantly differ in standard performance after a concussion. There were no significant differences in standard performance after a concussion for goalies in the pre-NHLCP or post-NHLCP groups. Overall, goalies had a significant decrease in save percentage from 91.9% ± 1.3% before concussion to 89.8% ± 2.5% after concussion (P = .034) (Table 2).
Comparison of Standard Performance Metrics of Skaters and Goalies 1 Season Before and After Concussion a

Data are reported as a mean number of events unless otherwise indicated. NHL, National Hockey League; NHLCP, the 2016-2017 NHL updated concussion protocol; PIM, penalty minutes; TOI, time on ice.
Before the 2016-2017 NHL updated concussion protocol.
After the 2016-2017 NHL updated concussion protocol.
Three-Season Interval Standard Performance
There were no significant differences in standard performance 3 seasons before and after a concussion for skaters in the pre-NHLCP group or overall (Table 3). Skaters in the post-NHLCP group showed a significant decrease after concussion in games played (62.9 ± 24.5 vs 51.8 ± 13.8; P = .017) and time on ice (1139:14 ± 527:57 vs 915:19 ± 356:49 min: sec; P = .016). There were also significant decreases after concussion for skaters in the post-NHLCP group in assists (20.8 ± 18.4 vs 16.8 ± 11.7; P = .025), points (33.1 ± 28 vs 26.2 ± 19.4; P = .0305), penalty minutes (26.4 ± 19.6 vs 16.6 ± 11.9; P = .014), and shots (120.2 ± 76.2 vs 97.6 ± 55.8; P = .037). There were no significant differences after concussion in this period in standard performance for goalies in the pre- or post-NHLCP group or overall (Table 3).
Comparison of Standard Performance Metrics of Skaters and Goalies 3 Seasons Before and After Concussion a
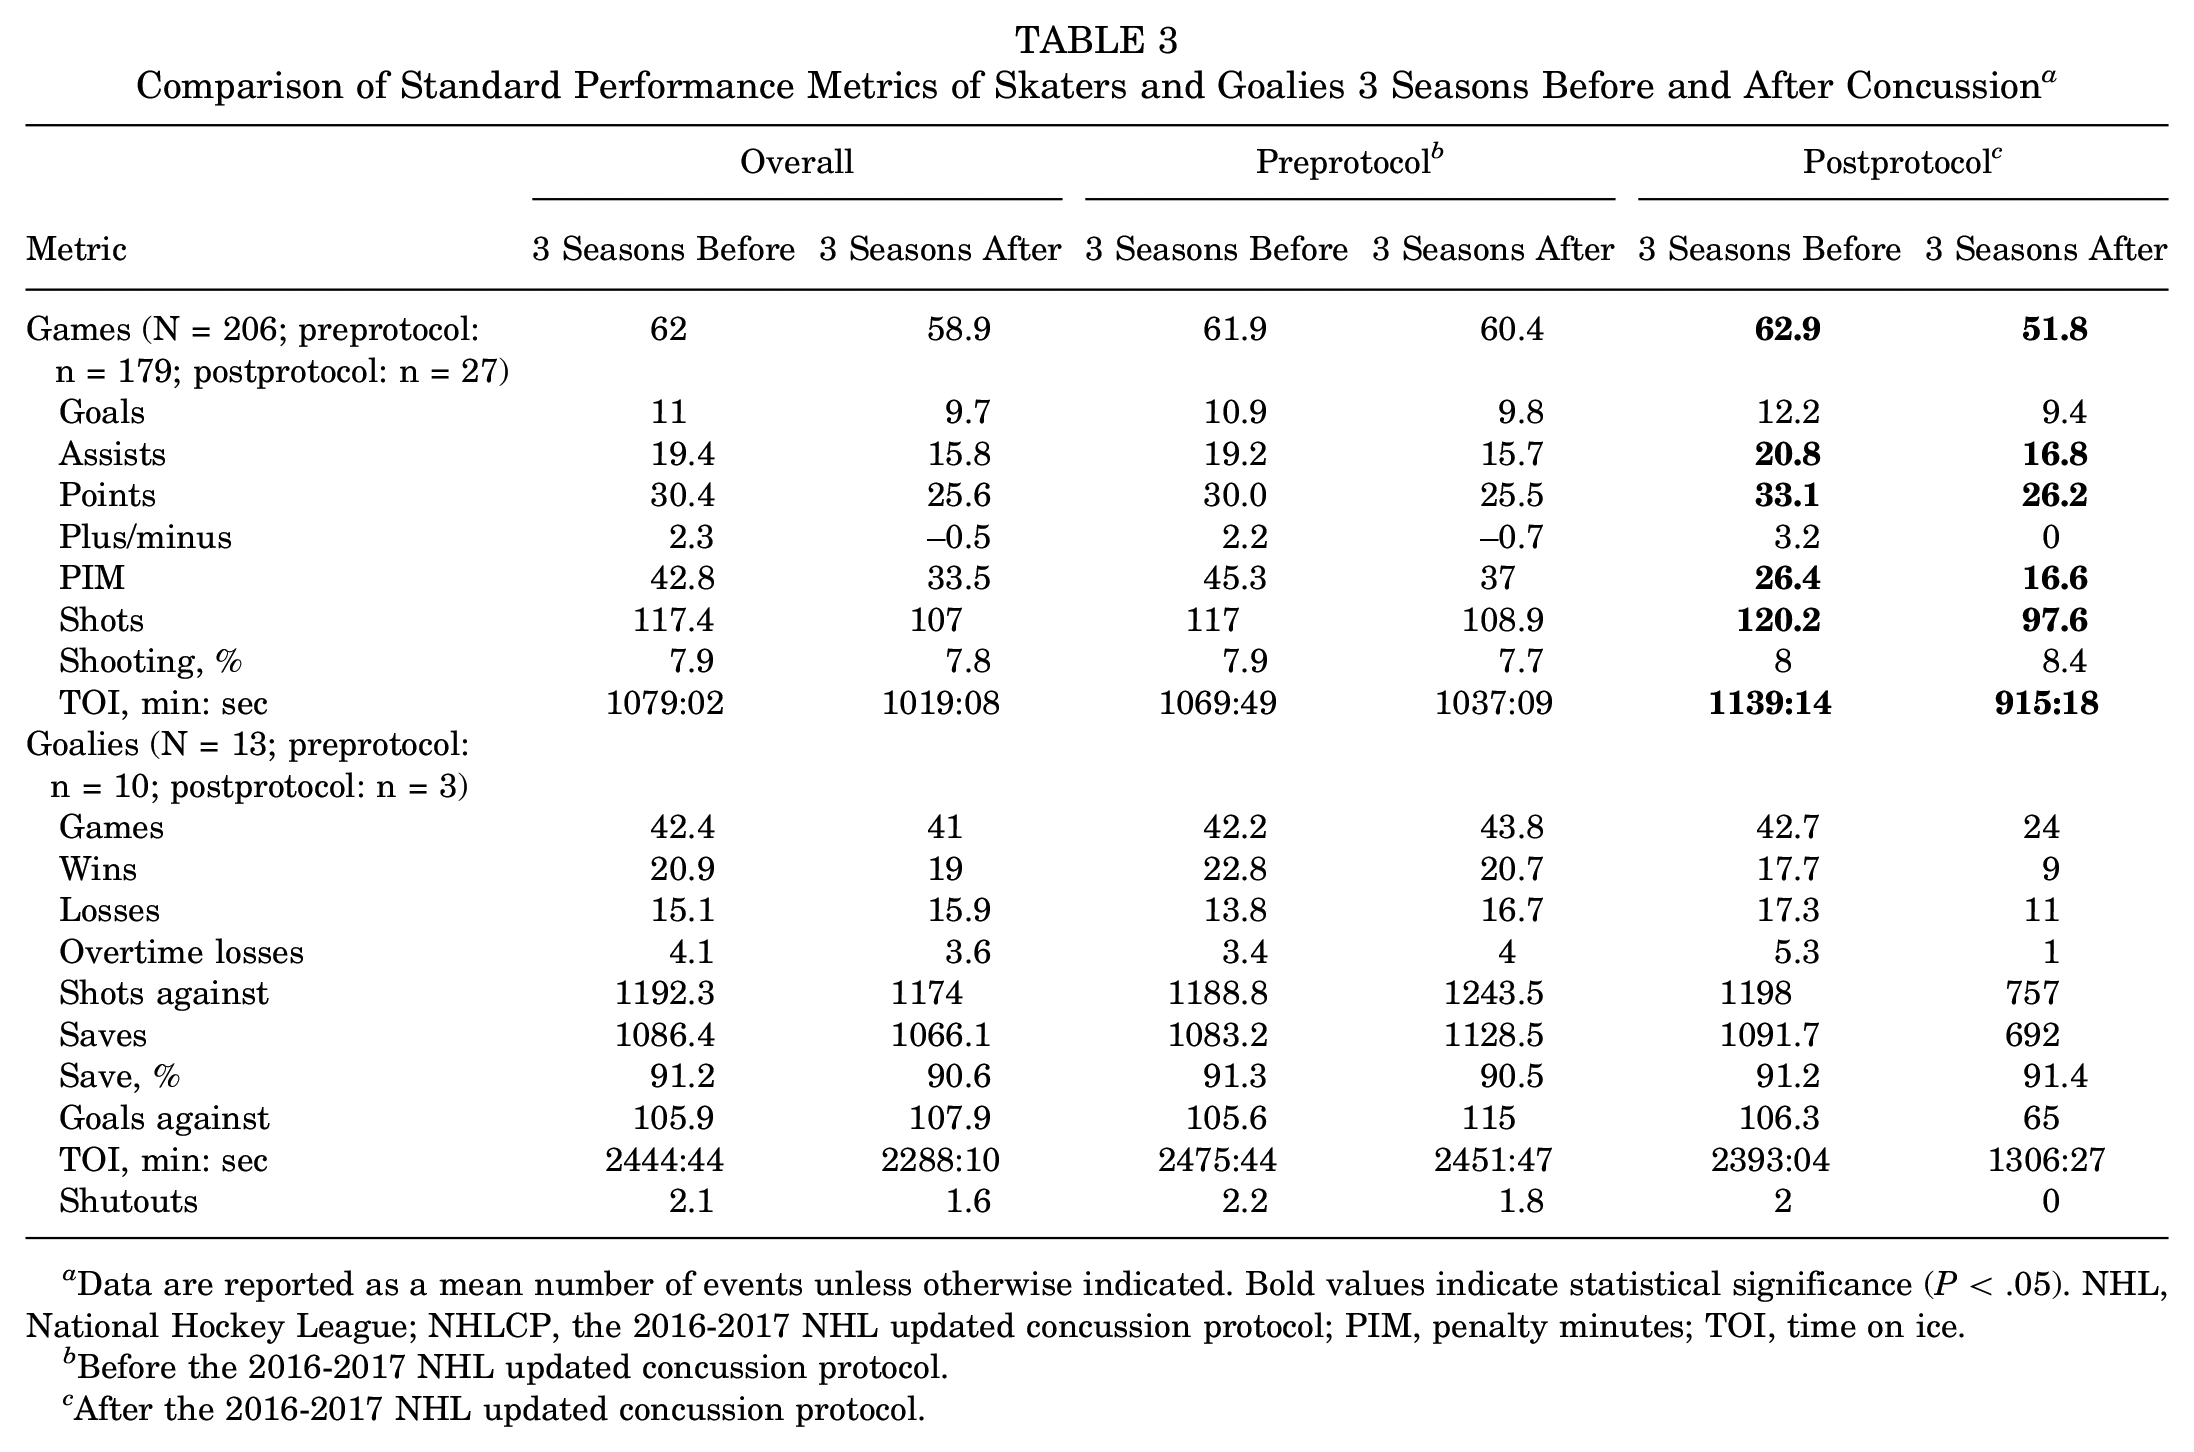
Data are reported as a mean number of events unless otherwise indicated. Bold values indicate statistical significance (P < .05). NHL, National Hockey League; NHLCP, the 2016-2017 NHL updated concussion protocol; PIM, penalty minutes; TOI, time on ice.
Before the 2016-2017 NHL updated concussion protocol.
After the 2016-2017 NHL updated concussion protocol.
One-Season Interval Sabermetric Performance
There was a significant decrease after concussion in the 1-season period in Fenwick (50.9% ± 6.5% vs 50.2% ± 5.4%; P = .048) for skaters in the pre-NHLCP group. There were no significant differences in sabermetric performance 1 season after a concussion for skaters in the post-NHLCP group. Overall, skaters had a significant decrease after concussion in Fenwick (51.4% ± 6.1% vs 50.9% ± 5.5%; P = .019). (Table 4).
Comparison of Mean Skater Sabermetric Performance Metrics 1 Season and 3 Seasons Before and After Concussion a

Data are reported as a mean number of events unless otherwise indicated. Bold values indicate statistical significance (P < .05; 2- sample unequal value t test).
Three-Season Interval Sabermetric Performance
For sabermetric performance during the 3-season interval before and after a concussion, we observed that skaters in the pre-NHLCP group had a significant decrease after concussion in Corsi (51.7% ± 7.4% vs 51.1% ± 6.8%; P = .036) and Fenwick (51.4% ± 7.7% vs 51.1 ± 6.5%; P = .036) (Table 4). Overall, skaters had a significant decrease after concussion in Corsi (52.4% ± 7.1% vs 51.1% ± 6.6%; P = .004) and Fenwick (52% ± 7.3% vs 51.1% ± 6.3%; P = .005).
Financial Cost
The mean return to play was significantly higher in the pre-NHLCP group (20.1 ± 17.9 days) than in the post-NHLCP group (15.7 ± 12.1 days; P = .022). There were no significant differences in average adjusted salary (in 2021 US$) of players between the pre- and post-NHLCP groups ($2,466,361 ± $2,289,752 vs $2,609,285 ± 2,397,171), while the average adjusted salary of replacement players was significantly lower in the pre-NHLCP group ($744,505 ± 478,252) than in the post-NHLCP group ($901,140 ± 466,235; P = 0.032). The mean cost of return to play was not significantly different between the pre-NHLCP ($232,273 ± 253,458) and post-NHLCP groups ($211,668 ± $234,017; P = 0.509). Regression analyses showed that the mean return to play time decreased significantly (R2 = 0.335; P = .005) from 2000 to 2001, while the mean cost of the time missed did not differ significantly over the same period (Figure 4A). Regression analyses also showed a significantly positive correlation between mean return to play and mean cost of return to play (R2 = 0.215; P = .030) (Figure 4B).

Results of regression analysis of (A) trends for the mean return to play and cost of concussion over time and (B) the association between mean return to play and cost. The cost is in 2021 US dollars. DL, disabled list .
Discussion
In this study, we found a similar incidence of concussions in NHL players before (25.4 ± 16.2 concussions per season) and after (27.4 ± 9.5 concussions per season) implementation of the 2016-2017 updated NHLCP (P = .756). In addition, there were significantly fewer days missed after concussion in players in the post-NHLCP group (15.7 ± 12.1 days) than in the pre-NHLCP group (20.1 ± 17.9 days; P = .022). For NHL players, no significant differences were found in player performance before and after concussion in the pre-NHLCP and post-NHLCP groups at 30 days and 1 season; however, we observed significant differences in skater usage and performance in the post-NHLCP group at a 3-year time period before and after concussion. Overall, no differences were found in the financial cost of concussions between the pre- ($232,273 ± 253,458) and post-NHLCP groups ($211,668 ± $234,017; P = .509), and missed time was significantly correlated with mean cost from missed time (R2 = 0.215; P = .030).
NHL concussion incidence has steadily increased throughout the history of the sport. 27 Kuhn and Solomon 11 reported in a systematic review that the incidence of concussions in the NHL from 1986 to 2012 increased from 0.417 to 4.878 concussions per 100 NHL games, with the highest reported incidence in the 2011-2012 season. They attributed this increase to a possible rise in violent style of play in addition to increased awareness among players, coaches, and team medical staff of concussion symptoms. More recently, Adams et al 1 reported on the incidence of concussions in the NHL between 2013 and 2017 and found that incidence was consistent up until the 2016-2017 season, when the updated NHLCP was instituted and concussion incidence dramatically increased. An increase in concussion incidence was seen after the institution of a concussion protocol in Major League Baseball (MLB) and in the National Basketball Association (NBA); however, both of those sports have considerably less physical contact than hockey.15,21,26 Peterson et al 22 similarly found an increase in reported concussions after the institution of the MLB 2011-2012 standardized concussion protocol (MLBCP), and an increase in concussion incidence was also seen after the institution of the NBA concussion protocol (NBACP), from a mean of 5.7 to 16.7 concussions per season. 21 We observed a higher rate of concussions after implementation of the NHLCP; however, the overall difference in the incidence before and after implementation of the NHLCP was not significant (25.4 vs 27.4; P = .756). We believe that this may be because post-NHLCP team personnel and independent spotters have increased awareness of concussions.
The impact of concussion protocols on professional athletes return to play is mixed. In MLB, a decrease in time needed to return to play was found after the institution of the MLBCP, from a mean of 33.7 days to 18.9 days. 26 A report on NBA concussion injuries before and after the establishment of the NBACP found no significant difference, with a mean of 6.7 days missed before and 8.7 days missed after implementation of the NBACP. 21 A combination of factors likely contributed to the improved return to play that we observed in the post-NHLCP group (15.74 ± 12.14 days) compared with the pre-NHLCP group (20.08 ± 17.89 days; P = .022). As the concussion protocol became more comprehensive and sensitive, a wider spectrum of concussions might have been noticed, whereas it is likely that only severe injuries were reported in pre-NHLCP. Minor concussions can resolve in a few days, and while players with minor concussions may have kept playing before the NHLCP was established, they may now be held out of play for a short period before returning to play because of increased vigilance. In addition, over the course of the study period, concussion treatments and techniques improved; therefore, a shorter return to play time would be expected. There were also much fewer repeat concussions in the post-NHLCP group, indicating the players returning are doing so safely and are not subject to repeat concussions like the pre-NHLCP group was.
Excellent short-term recovery from concussion in NHL players is reflected in other reports on NHL performance. Neustadtl et al 20 assessed NHL player performance during the 5 games before and the 5 games after a concussion injury and found no significant change in performance measures. Similarly, Kuhn et al 12 assessed NHL player performance at 5 games before and after concussion and found no significant differences in standard performance metrics. Andrews et al 2 assessed NHL players at 1 year after concussion and found no significant difference in standard or sabermetric performance compared with the players’ preinjury performance or compared with an uninjured matched control cohort. One study reported decreased scoring metrics in the first year after concussion for skaters, which they attributed to the injury as well as other factors. 18 Our study had similar results when comparing performance 30 days (5 games) and 1 year before and after concussion, where we found that NHL players performed at their previous level both before and after implementation of the NHLCP, which is to be expected since most concussion symptoms can resolve quickly after a typical pattern of initial cognitive and physical limitation followed by a gradual return to activity within days. 8
We found that the financial cost of an NHL player concussion was positively correlated with time missed, and we showed that the cost of a concussion was consistent before and after the NHLCP was established. This is an important finding because players and team staff should feel comfortable reporting concussive symptoms and instituting necessary treatment since the cost of concussions is not significantly different from previous years, despite an increase in concussion reporting. One possible explanation is that after the implementation of the NHLCP, return to play improved, which helped keep costs controlled since the financial cost of a concussion and time missed are positively correlated. However, there may be other financial costs to the player that were beyond the scope of our study. Navarro et al 18 reported significant earning reductions and a decrease of $292,000 per year in contract value for players who sustained concussions. In other professional sports, Chatha et al 6 reported on the financial cost of the MLBCP 7-day disabled list and concluded that the protocol implementation lowered team costs and did not negatively affect reporting. Overall, NHLCP implementation had no negative impact on the financial cost of a concussion; therefore, concussion protocol measures should continue to be implemented without fear of significant financial impact on the hockey team.
Limitations
This study is not without limitations. First, public internet sites were used for data collection; therefore, inaccurate information may have been included in these datasets, and the data may be biased toward higher-profile players who receive more reporting. Second, we could not access official NHL health records; thus, we could not formally assess for concomitant injuries. Return to play could have been affected by other injuries sustained alongside the concussion, despite the resolution of concussion symptoms. We reviewed multiple public sources that document injuries and excluded any athletes with multiple injuries. In addition, we had no method for assessing players’ concussion history before they entered the NHL. Most players play throughout childhood and professionally before joining the NHL. Thus, many players could have sustained concussions previously, which could affect the metrics of recovery and time missed from concussions sustained in the NHL. We excluded players who had multiple concussions to mitigate the effects of multiple injuries; however, this excluded the players who probably had the most severe injury outcomes, and the overall impact of concussions on NHL players may be more severe than what our findings suggest. Last, performance statistics are imperfect for assessing every player's impact on the game; therefore, players who serve as penalty killers, enforcers, or faceoff specialists rather than goal scorers may be underrepresented in the current performance metrics.
Conclusion
Concussion incidence did not change after implementation of the updated NHLCP; nevertheless, players had significantly less missed time from injury after protocol implementation. Changes in player performance 30 days and 1 year before and after concussion injury were not different before and after NHLCP implementation. No differences were found in the financial cost of concussions between the pre- and post-NHLCP groups, and the missed time was significantly correlated with the mean cost from the missed time. We recommend continued reevaluation and improvement of concussion protocols to determine the optimal management of concussions.
Footnotes
Acknowledgements
The authors thank Karla D. Passalacqua, PhD, ELS, MWC, for help assisting and preparing this article.
Final revision submitted June 28, 2023; accepted August 23, 2023.
One or more of the authors has declared the following potential conflict of interest or source of funding: M.A.G. has received education payments from Pinnacle. J.P.C. has received education payments from Pinnacle. T.S.L. has received education payments from Gotham Surgical Solutions & Devices; consulting fees from Smith & Nephew and KCI; and nonconsulting fees from Smith & Nephew, Arthrex, and Linvatec. AOSSM checks author disclosures against the Open Payments Database (OPD). AOSSM has not conducted an independent investigation on the OPD and disclaims any liability or responsibility relating thereto.
Ethical approval was not sought for the present study.