
Abstract
Background:
A limb symmetry index (LSI) of >90% for single-leg horizontal hop distance is recommended as a cutoff point for safe return to sports after anterior cruciate ligament reconstruction (ACLR). Despite achieving this threshold, abnormal lower limb biomechanics continue to persist in athletes after ACLR. Symmetry in single-leg vertical hop height appears to be more difficult to achieve and can be a better representation of knee function than single-leg horizontal hop distance.
Purpose:
To explore whether an LSI of >90% for single-leg vertical hop height can represent normal lower limb biomechanics in athletes during a bilateral vertical jump after ACLR.
Study Design:
Controlled laboratory study.
Methods:
According to the LSI for single-leg vertical hop height, 46 athletes who had undergone ACLR with an autologous ipsilateral bone–patellar tendon–bone or hamstring tendon graft were divided into a low symmetry group (LSI <90%; n = 23) and a high symmetry group (LSI >90%; n = 23), and 24 noninjured athletes were selected as the control group. The kinematic and kinetic characteristics during a bilateral vertical jump were compared between the low symmetry, high symmetry, and control groups.
Results:
During the propulsion phase of the bilateral vertical jump, the operated side in the high symmetry group showed a lower knee extension moment than the nonoperated side (P = .001). At peak vertical ground-reaction force, the operated side in the high symmetry group showed a lower knee internal rotation moment compared with the control group (P = .016). Compared with the nonoperated side, the operated side in the high symmetry group showed a higher hip extension moment (P = .002), lower knee extension moment (P < .001), lower ankle plantarflexion moment (P < .001), and lower vertical ground-reaction force (P = .023).
Conclusion:
Despite achieving an LSI of >90% for single-leg vertical hop height, athletes after ACLR showed abnormal lower limb biomechanical characteristics during the bilateral vertical jump.
Clinical Relevance:
Symmetrical single-leg vertical hop height may not signify ideal biomechanical or return-to-sports readiness in this population.
Keywords
Currently, it is common to use either postoperative time or subjective clinician criteria to determine the timing of return to sports for patients after anterior cruciate ligament (ACL) reconstruction (ACLR).3,4,8 Unfortunately, these criteria do not adequately take into account the biomechanical deficits of patients after ACLR. 21 Nearly one-quarter of young athletes experience a secondary ACL injury after return to sports. 39 The high incidence of secondary ACL injuries may represent a flaw in the current return-to-sports criteria.21,37
Biomechanical analysis of the movement quality of hop tests can provide valuable information for identifying abnormal loading strategies and determining the optimal timing of return to sports. 1 However, given the high cost and expertise requirement, detailed biomechanical assessments are not applicable in the clinical setting. Identifying simple, cost-effective, and reliable tools to measure function after ACLR is a challenge in the field of sports medicine. One such tool is the single-leg horizontal hop test, often used to assess patients’ lower limb muscle strength and evaluate their ability to perform tasks that challenge knee stability. 34 The hop distance reflects the overall function of the hip, knee, and ankle joints, as well as the coordination among them, and can represent the demands of high-level exercise. 14 In addition, the single-leg horizontal hop test has no time or space constraints, it can be widely administered, and the results are easy to interpret. As a result, it is now widely used in the assessment of return to sports in patients after ACLR.
Most studies recommend a limb symmetry index (LSI; [operated side value/nonoperated side value] × 100%) of >90% on the single-leg horizontal hop test as a criterion for return to sports after ACLR.1,10 However, research has suggested that even with an adequate LSI for single-leg hop distance, athletes after ACLR still exhibit abnormal biomechanical characteristics during the single-leg horizontal hop test, potentially indicating an increased risk of reinjury. 19 A recent study has shown that after ACLR, athletes achieve 97% symmetry in single-leg horizontal hop distance but only 83% symmetry in single-leg vertical hop height. 18 Vertical hop height symmetry appears to be more difficult to achieve than horizontal hop distance symmetry and may be a better representation of limb function.
To our knowledge, whether an LSI of >90% for vertical hop height can represent good lower limb biomechanics has not been explored yet. Therefore, the aim of this study was to investigate whether athletes after ACLR with an LSI of >90% for vertical hop height exhibited similar biomechanical characteristics to those of noninjured athletes. We utilized a bilateral vertical jump instead of a single-leg vertical hop. This decision was made because a lower hop height on the operated side in athletes after ACLR with an LSI of <90% for vertical hop height may produce less momentum during landing, resulting in less total power and vertical ground-reaction force (vGRF). Using a single-leg vertical hop to analyze the kinematic and kinetic differences did not seem to fully reflect abnormal patterns in athletes after ACLR with an LSI of <90% for vertical hop height. A bilateral vertical jump can generate similar hop heights on both sides, and it more closely resembles the movements involved in high-intensity exercises such as gymnastics, basketball, and volleyball in which propulsion and landing with both legs are more common. 12 Our hypothesis was that athletes after ACLR with an LSI of >90% for vertical hop height would have similar biomechanical characteristics to those of noninjured athletes and that those with an LSI of <90% for vertical hop height would still show abnormal patterns.
Methods
Study Design and Participants
This laboratory study involved a case-control comparative analysis of an ACLR group (time since surgery: 15.8 ± 5.1 month) and a noninjured control group. The study protocol was approved by the medical ethics committee, and all participants were informed about the experimental process and signed an informed consent form. An a priori power analysis (G*Power Version 3.1.2; Franz Faul) was performed to determine the appropriate sample size for the entirety of the study. After calculations, we determined that a sample size of 22 participants per group was required to achieve a power of 0.80, an effect size of 0.4, and an alpha level of .05 using 1-way analysis of variance (ANOVA). A total of 70 athletes participated in this study, including 46 athletes who underwent ACLR and 24 control athletes (Figure 1).
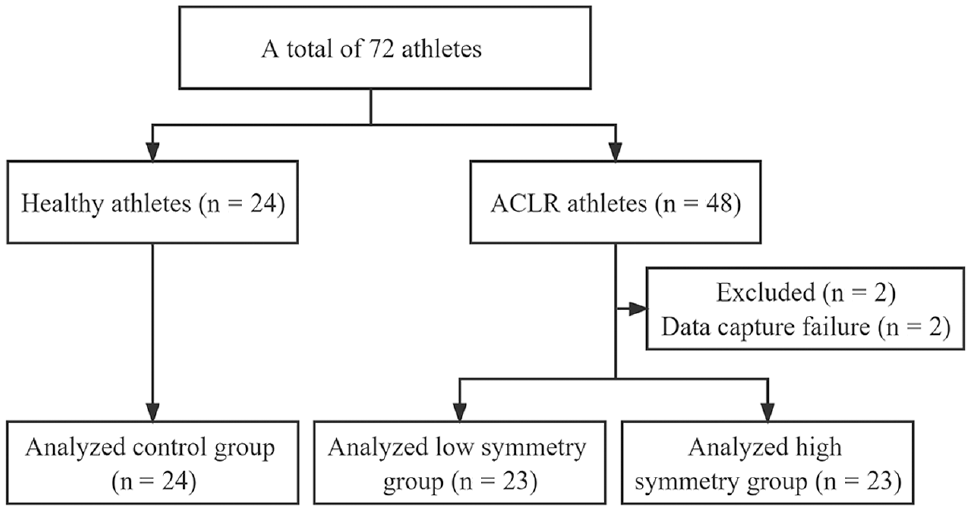
Study flow diagram. ACLR, anterior cruciate ligament reconstruction.
The inclusion criteria for the athletes who had undergone ACLR were as follows: (1) had a complete unilateral ACL injury treated with an autologous ipsilateral bone–patellar tendon–bone or hamstring tendon graft (semitendinosus and/or gracilis tendon), (2) had a postoperative time of ≥9 months, (3) were cleared to return to all high-level athletic activities by their surgeon and treating rehabilitation specialist and intended to return to cutting and pivoting sports regularly (≥50 h/y), (4) had an LSI of >90% for single-leg horizontal hop distance on the single-leg horizontal hop test, and (5) had a Tegner score of ≥7 before the injury. The inclusion criteria for the control athletes were a Tegner score of ≥7 and an LSI of >90% for single-leg horizontal hop distance. The exclusion criteria were as follows: (1) had a concomitant grade 3 knee ligament injury, concomitant full-thickness articular cartilage lesion, or history of other lower limb surgery (in either limb), back pain, or lower limb injury in the previous 3 months; (2) could not complete the tasks; and (3) had missing motion analysis data during hopping.
Data Collection
Participants first performed a 10-minute standardized warm-up, and then 38 spherical reflective markers (diameter, 14 mm) were applied to the left and right anterior superior iliac spine, iliac crest, posterior superior iliac spine, greater trochanter of the femur, lateral femoral condyle, medial femoral condyle, lateral malleolus, medial malleolus, heel, first metatarsal head, fifth metatarsal head, and 4 markers on the side of each thigh and shank. A 9-camera infrared high-speed motion capture system was used to collect kinematic parameters of the lower limb during hopping (200 Hz; Vicon T40; Vicon). Kinetic parameters were collected synchronously with marker trajectories using 4 ground-embedded force plates (1000 Hz; Kistler).
For measurements of single-leg vertical hop height, participants were asked to complete 3 successful single-leg vertical hops on each side. The test limb order was randomly assigned using a coin toss. Hop height was calculated using the toe-off vertical velocity derived from the vGRF signal using the impulse-momentum theorem. 16 The average of the 3 hop heights was taken for analysis. According to the LSI for single-leg vertical hop height, the athletes who underwent ACLR were assigned to 1 of 2 groups: the low symmetry group (LSI <90%; n = 23) or the high symmetry group (LSI >90%; n = 23).
For measurements of bilateral vertical jump performance, participants stood on 2 force plates with their feet separated by a distance equal to the width of their shoulder and their arms folded over the chest to eliminate the effect of arm swing on the markers. Participants performed a downward movement until they reached their preferred self-selected depth, and then they hopped vertically with maximum effort and landed on the same force plate (Figure 2). The hop was considered successful if the participants landed on a separate force plate with each foot and held the landing for more than 2 seconds. If not, the hop was performed again until 3 successful hops were completed, and the average of the 3 hops was taken for analysis.

Schematic diagram of the bilateral vertical jump.
Data Processing
Kinematic and inverse kinetic analyses were processed with Visual3D software (C-Motion). Marker trajectories and force plate data were both filtered with a fourth-order low-pass Butterworth filter with a cutoff frequency of 12 Hz. Initial contact and toeoff were expressed as the point when the vGRF became <50 N and >50 N, respectively. The propulsion phase was defined as 400 ms before toeoff until toeoff. All kinematic variables were extracted at the times of initial contact with the ground on landing and peak vGRF, and all kinetic variables were extracted at the time of peak vGRF.
The kinematic variables of interest were hip, knee, and ankle joint angles. The kinetic variables of interest were hip, knee, and ankle joint moments and vGRF. In addition, the peak angle of the sagittal plane of the hip, knee, and ankle joints during the propulsion phase as well as the average moment of the sagittal plane of the hip, knee, and ankle joints were extracted. 40 The ankle, hip, and knee joint angles were defined as the angle between the distal and proximal segments. Joint moments were calculated using inverse dynamics from the force plate data. All kinetic variables were normalized using body weight.
Statistical Analysis
Descriptive statistics will summarize demographic data and observable variables using frequencies for categorical variables, means ± standard deviations for continuous variables. The Fisher exact test and 1-way ANOVA were used to compare categorical and continuous demographic variables, respectively, between groups. For kinematic and kinetic variables, a paired-samples t test was used for within-group comparisons, and 1-way ANOVA was used for between-group comparisons. If significant differences were found between groups, post hoc tests were performed using the Bonferroni correction. Normality was confirmed using the Shapiro-Wilk test, and equal variance was confirmed using the Levene test. Between-limb analysis of all relevant parameters in the control group showed no significant differences; thus, one limb was randomly selected for analysis. 19 Statistical analyses were performed using SPSS (Version 25.0; IBM), with a significance threshold of P < .05.
Results
Participants’ Characteristics
There were no differences between the groups in sex distribution, age, height, weight, body mass index, preinjury Tegner score, or graft type. LSIs for single-leg horizontal hop distance and single-leg vertical hop height were lower in the low symmetry group compared with the high symmetry and control groups (P < .05), and International Knee Documentation Committee scores were lower in the low symmetry and high symmetry groups compared with the control group (P < .05) (Table 1).
Participants’ Characteristics a

Data are reported as mean ± SD unless otherwise indicated. Dashes indicate characteristics that were not applicable to the control group. ACL, anterior cruciate ligament; BPTB, bone–patellar tendon–bone; IKDC, International Knee Documentation Committee; LSI, limb symmetry index.
Statistically significant difference between low symmetry and control groups (P < .05).
Statistically significant difference between high symmetry and control groups (P < .05).
Statistically significant difference between low symmetry and high symmetry groups (P < .05).
Kinematic Variables
During the propulsion phase, compared with the control group, both the operated and nonoperated sides in the low symmetry group showed a higher peak hip flexion angle (P = .004 and P = .009, respectively). The operated side in the low symmetry group demonstrated a lower peak ankle dorsiflexion angle (P = .002) than the nonoperated side (Table 2).
Kinematic Variables a

Data are reported as mean ± SD. vGRF, vertical ground-reaction force.
Statistically significant difference versus the control group (P < .05).
Statistically significant difference versus the nonoperated side in the low symmetry group (P < .05).
At initial contact, compared with the control group, both the operated and nonoperated sides in the low symmetry group showed a higher hip flexion angle (P < .001 and P = .001, respectively) and lower ankle plantarflexion angle (P = .013 and P = .034, respectively). The operated side in the low symmetry group demonstrated a lower hip abduction angle (P = .002) than the nonoperated side. Compared with the control group, both the operated and nonoperated sides in the high symmetry group showed a lower ankle plantarflexion angle (P = .048 and P = .009, respectively) (Table 2).
At peak vGRF, compared with the control group, both the operated and nonoperated sides in the low symmetry group showed a higher hip flexion angle (P < .001 for both) and lower knee flexion angle (P = .012 and P = .015, respectively). The operated side in the low symmetry group demonstrated a lower hip abduction angle (P = .001) than the nonoperated side (Table 2).
Kinetic Variables
During the propulsion phase, the knee extension moment on the operated side in the low symmetry group was significantly lower than that in the control group (P = .002), the nonoperated side in the low symmetry group (P < .001), and the nonoperated side in the high symmetry group (P < .001). The operated side in the high symmetry group showed a lower knee extension moment than the nonoperated side (P = .001) (Table 3).
Kinetic Variables a

Data are reported as mean ± SD. BW, body weight; vGRF, vertical ground-reaction force.
Statistically significant difference versus the nonoperated side in the high symmetry group (P < .05).
Statistically significant difference versus the control group (P < .05).
Statistically significant difference versus the nonoperated side in the low symmetry group (P < .05).
At peak vGRF, compared with the control group, both the operated and nonoperated sides in the low symmetry group had a lower knee internal rotation moment (P = .013 for both), and the operated side demonstrated a higher hip extension moment (P = .038), lower knee extension moment (P = .011), and lower vGRF (P = .022). Compared with the nonoperated side, the operated side in the low symmetry group demonstrated a higher hip extension moment (P < .001), lower knee extension moment (P < .001), lower ankle plantarflexion moment (P = .010), and lower vGRF (P = .001). Compared with the nonoperated side in the high symmetry group, the operated side in the low symmetry group showed a higher hip extension moment (P = .041), lower knee extension moment (P = .005), lower ankle plantarflexion moment (P = .001), and lower vGRF (P = .004) (Table 3).
At peak vGRF, compared with the control group, both the operated and nonoperated sides in the high symmetry group showed a lower knee internal rotation moment (P = .016 and P = .040, respectively). Compared with the nonoperated side, the operated side in the high symmetry group demonstrated a higher hip extension moment (P = .002), lower knee extension moment (P < .001), lower ankle plantarflexion moment (P < .001), and lower vGRF (P = .023) (Table 3).
Discussion
The study results indicated that despite achieving an LSI of >90% for single-leg vertical hop height, athletes after ACLR had abnormal lower limb biomechanical characteristics during a bilateral vertical jump compared to healthy controls. The LSI for single-leg vertical hop height in the low symmetry group reached only 78.8%, which was significantly lower than that in the high symmetry group (98.3%) and the control group (101.0%). In the single-leg horizontal hop, the knee joint contributes 12.9% of the hop distance. 17 In the single-leg vertical hop, the knee joint contributes 34.1% of the hop height. 17 The knee contributes more in the vertical direction than in the horizontal direction; vertical hop height symmetry is more effective in identifying knee joint functional deficits in those with knee impairments than horizontal hop distance symmetry.17,18 This may explain the failure of some athletes to achieve hop height symmetry after achieving 90% hop distance symmetry after ACLR.
Kinematics
The results of this study demonstrated that the low symmetry group exhibited a higher peak hip flexion angle during the propulsion phase than the control group. A greater hip flexion angle during the propulsion phase can generate greater momentum in upward and forward movements, which translates into better hop height and hop distance. 25 A higher hip flexion angle in the low symmetry group may represent an altered pattern of motion that produces higher kinetic energy through higher hip flexion angles, thus avoiding the decrease in hop height caused by neuromuscular deficits on the operated side.
The low symmetry group exhibited a higher hip flexion angle and lower knee flexion angle at peak vGRF than the control group. This could be a potential strategy to avoid a “stiff” landing by compensating for a smaller knee flexion angle with a larger hip flexion angle. However, the smaller the knee flexion angles during landing, the greater the knee loads. A reduced knee flexion angle also results in a decreased potential to absorb ground-reaction forces.11,36 All of these factors may increase the risk of an ACL reinjury.23,31 A reduced knee flexion angle may be caused by altered quadriceps activation or decreased quadriceps strength.20,35,38,43 Studies have shown that greater quadriceps strength is associated with a greater peak knee flexion angle and smaller peak vGRF. 38 There were no significant differences in hip or knee flexion angles in the high symmetry group compared with the control group, which may indicate that quadriceps activation and strength in the high symmetry group were similar to those in the control group.
Ankle motion during dynamic tasks such as hop landing affects the biomechanics of the hip and knee. Specifically, increased ankle plantarflexion reduces the need for proximal joint muscle contraction, thereby decreasing energy dissipation in the hip. 22 If the ankle does not contribute sufficient energy reduction, the knee needs to absorb more energy. 26 All athletes after ACLR demonstrated lower ankle plantarflexion angles at initial contact, regardless of symmetry.
Kinetics
In the present study, the knee extension moment was significantly lower on the operated versus nonoperated side in athletes after ACLR, regardless of symmetry. Previous studies have indicated that athletes after ACLR tend to use the nonoperated side to carry the landing load during the landing phase.27,28 Our findings complement the notion from previous studies that athletes after ACLR tend to use the nonoperated side to generate kinetic energy during the propulsion phase. Because an ACL injury is unlikely to occur during the propulsion phase, it is unclear why this pattern emerged: possibly because of a lack of confidence in the operated side.
The results revealed that the operated side of athletes after ACLR exhibited a higher hip extension moment and lower knee extension moment at peak vGRF than the nonoperated side, regardless of symmetry. It could be explained by the fear of an ACL reinjury: athletes after ACLR attempt to unload the knee and shift the load to the ipsilateral hip and contralateral knee. It is worth mentioning that regardless of symmetry, ankle plantarflexion moment on the operated side in athletes after ACLR was significantly lower than that on the nonoperated side. This may be because athletes after ACLR tend to shift the load on the knee to the hip rather than the ankle. Boo et al 6 showed that athletes who underwent ACLR exhibited higher hip energy absorption and lower ankle energy absorption during the landing phase compared to noninjured athletes.
vGRF asymmetry during the landing phase has been shown to be a risk factor for noncontact ACL injuries. 33 Paterno et al 30 observed that patients who underwent ACLR had significantly lower peak vGRF on the operated side than on the nonoperated side and in controls during a bilateral vertical drop hop. In the present study, vGRF was significantly lower on the operated versus nonoperated side in athletes after ACLR, regardless of symmetry. On the one hand, this may be caused by a lack of psychological confidence in the operated side in athletes after ACLR, who unload the operated side and transfer the load to the nonoperated side during dynamic tasks.2,27 On the other hand, the elevated vGRF on the nonoperated side may be caused by a decrease in knee flexion and ankle plantarflexion angles, which reduces the potential for the absorption of vGRF.
Clinical Implications
Athletes after ACLR with an LSI of >90% for hop height exhibited more symmetrical biomechanics during landing compared to athletes with an LSI of <90% for hop height. However, athletes after ACLR with an LSI of >90% for hop height still had abnormal lower limb biomechanical characteristics on the operated side compared to control athletes and the nonoperated side. This may be because of the fear of an ACL reinjury or prolonged uncorrected abnormal loading strategies postoperatively, suggesting that symmetrical hop height may not imply ideal biomechanics or readiness for return to sports. Moreover, decreased or increased performance of the uninvolved limb will produce a misleading LSI, which may overestimate or underestimate the functional capacity of the involved limb. 9
Limitations
Several limitations were present in this study. First, the types of grafts used were not uniform. The differences in graft types may have been a factor that influenced our results. 41 Second, this study did not assess quadriceps strength, which should also be considered during functional return-to-sports testing.29,42 Third, we did not include the assessment of other important lower limb deformities/morphologies that can significantly alter the kinematics during a single-leg vertical hop.5,7,15,24 Fourth, no baseline assessment of hip/knee/ankle range of motion was conducted before kinematic testing to assess for differences. The technically incorrect placement of tunnels or insufficient rehabilitation could have contributed to the limited dynamic knee extension. 32 Additionally, there is no differentiation between included athletes based on their sports. Another limitation is that men and women were not analyzed separately because of the relatively small sample size, despite some evidence of biomechanical differences between sexes. 13
Conclusion
Despite achieving an LSI of >90% for single-leg vertical hop height, athletes after ACLR had abnormal biomechanical characteristics during a bilateral vertical jump. Results indicated that symmetry in single-leg vertical hop height did not represent normal lower limb biomechanics in athletes after ACLR.
Footnotes
Acknowledgements
The authors thank Professor Weitao Zheng, director of the Key Laboratory of Sports Engineering of the General Administration of Sport of China, Wuhan Sports University, as well as Dr Rui Han for guiding the experimental process.
Final revision submitted August 19, 2023; accepted August 30, 2023.
One or more of the authors has declared the following potential conflict of interest or source of funding: Research support was received from the Research Fund for Young Teachers of Wuhan Sports University, Donghu Scholar Program of Wuhan Sports University (2019), and Young and Middle-Aged Scientific Research Team Project of Wuhan Sports University (21KT14). AOSSM checks author disclosures against the Open Payments Database (OPD). AOSSM has not conducted an independent investigation on the OPD and disclaims any liability or responsibility relating thereto.
Ethical approval for this study was obtained from Wuhan Sports University (No. 2022034).