
Abstract
Background:
Limited literature is available regarding the effect of subchondral cysts on the surgical outcomes for treatment of osteochondral lesion of the talus (OLT).
Purpose:
To conduct a systematic review and meta-analysis of studies comparing surgical outcomes between OLTs with and without cysts.
Study Design:
Systematic review; Level of evidence, 4.
Methods:
Following the PRISMA (Preferred Reporting Items for Systematic Reviews and Meta-Analyses) guidelines, the authors searched PubMed, Embase, Web of Science, and the Cochrane Library for relevant studies published up to January 7, 2023. The 4375 retrieved studies were screened, and 9 articles (level of evidence, 2-4) were included, which comprised 165 patients with OLT and subchondral cysts (cyst group) and 223 without cysts (noncyst group). After data extraction, mean differences in outcome scores (American Orthopaedic Foot and Ankle Society [AOFAS] Ankle Hindfoot Scale, visual analog scale [VAS] score for pain) and adverse events were compared between the groups.
Results:
Functional scores improved after surgery in both groups, with the cyst group having a significantly higher AOFAS score than the noncyst group (P = .005; I2 = 0%); subgroup analysis revealed that this difference was attributable to the size of the osteochondral lesion and the type of surgical procedure. No significant difference was found between the cyst and noncyst groups in VAS pain scores (P = .77; I2 = 0%) or postoperative adverse events (P = .35; I2 = 0%).
Conclusion:
The results of this review indicated that patients with subchondral cysts improved with surgical treatment of OLT. A relatively low level of evidence was available to indicate that surgical treatment for small OLTs with subchondral cysts will result in better clinical outcomes compared with OLTs without cysts.
Osteochondral lesion of the talus (OLT) is a common ankle injury involving the articular cartilage and subchondral bone of the talus; acute ankle sprain and chronic ankle instability account for 66% and 70% of OLTs, respectively.19,32 Due to the lack of nerves, blood vessels, and lymph in the cartilage, the subchondral bone matrix has poor self-healing ability after destruction, and the treatment is challenging. 34 Subchondral bone cysts occur in 29% to 46% of chronic OLTs 36 and are seen in the setting of bone destruction, resorption, and synovial fluid invasion.6,20,30 Inflammatory cell aggregation, neo-angiogenic vasculature, and nerve fibers have been observed within the cyst.21,42 Hepple stage 5 and Anderson stage 2A are recognized as OLT with subchondral cyst formation based on imaging findings.1,18
In patients with OLT refractory to nonoperative treatment, surgery becomes an option. 43 A variety of surgical techniques have been considered, including bone marrow stimulation (BMS), osteochondral autologous transplant (OAT), bone marrow aspirate concentrate (BMAC), and autologous matrix-induced chondrogenesis (AMIC).27,35 Microfracture has become the preferred method because of its simplicity and good clinical outcomes, and the curative effect of arthroscopic BMS with a lesion area <150 mm2 has been widely verified.9,12 OAT is recommended when the lesion area is larger, because this technique uses mechanically stable hyaline cartilage with excellent durability.33,39 However, the effectiveness of surgical intervention for OLT in the presence of subchondral cysts remains a contentious issue. Some authors believe that the presence of cysts will interfere with the surgical approach and prognosis and recommend that BMS not be used alone when combined with cystic changes.14,37 Other authors consider that cysts are not an independent predictor of clinical failure after surgical therapy for OLT, with and without subchondral cysts have comparable properly clinical outcome.7,8,25,28
Given the potential challenges faced by surgeons in making medical decisions, the purpose of this study was to compare the clinical outcomes of OLTs with versus without the presence of cysts. We hypothesized that the presence of cysts would not affect clinical outcomes.
Methods
Search Strategy
The study was conducted according to the PRISMA (Preferred Reporting Items for Systematic Reviews and Meta-Analyses) guidelines. 31 The population, intervention, comparison, outcome, and study design (PICOS) question format was used in the retrieval and inclusion process, where the population was patients diagnosed with OLT, the intervention was surgical, the comparison was OLT with versus without cysts, the outcome was based on the studies’ description of postoperative outcomes, and the study designs were cohort studies or case series. To expand retrieval, we used the following text search strategy: (talus OR astragalus bone OR astragalus bones OR bone, astragalus OR bones, astragalus OR os trigonum OR talar) AND (osteochondral defects OR osteochondral lesions OR chondral lesions). Specifically, we searched PubMed, Web of Science, Embase, and Cochrane Library databases from database creation to January 7, 2023. We also assessed the reference lists of identified studies for additional articles. Language restrictions were not added. The results that met our PICOS question selection criteria were then screened.
Inclusion and Exclusion Criteria
Eligible articles included the following: (1) Articles described published cohort studies or case series with extractable data. (2) Surgical treatment was carried out on patients diagnosed with OLT, using procedures such as BMS, OAT, BMAC, and AMIC. Patients with OLT who had concomitant cysts exhibited radiographic features consistent with Hepple stage 5 or Anderson stage 2A.1,18 (3) The clinical average follow-up period was at least 12 months.
Exclusion criteria were (1) presence of concomitant lesions that would alter recovery, such as villonodular synovitis or tenosynovial giant cell tumor; (2) factors interfering with postoperative functional indexes, such as obvious limitation of activity or mental illness; (3) data not available; and/or (4) mean age of the patients >18 years.
Outcomes of Interest
The primary outcome of interest was the American Orthopaedic Foot and Ankle Society (AOFAS) Ankle Hindfoot Scale, 26 a scoring system combining subjective and objective criteria to assess clinical parameters, with a maximum score of 100 (pain = 40; function = 50; alignment = 10). A score of ≥90 is considered as excellent, 80 to 89 as good, 70 to 79 as fair, and ≤69 as poor. The secondary outcome was the visual analog scale (VAS) for ankle pain, where 0 = no pain and 10 = maximum pain. Additional outcome information included talar surgical-site complications or adverse events in both treatment groups. Type of surgical procedure performed and size of OLT (lesion area in mm2 or cm2) were collected. The number of patients lost to follow-up was also recorded as a study characteristic.
Study Selection and Data Extraction
All citations and abstracts generated by the literature search were screened by 1 reviewer (Q.L.), and selection criteria were applied. Duplicate literature was removed. Identified cohort studies and case series were assessed for inclusion by 2 reviewers (J.Z. and W.C.). Journal titles and author names were not blinded during the study selection process. Two researchers (J.Z. and K.Z.) independently extracted data from the included studies. Study characteristics (authors, year, study design, evidence level, sample size) and patients’ baseline information (age, sex, OLT size, surgical procedure, follow-up events, outcome measures) were extracted. Any disagreements about the studies were resolved through discussion with a third reviewer (Q.L.).
Quality Assessment
The Methodological Index for Non-Randomized Studies (MINORS) score 41 was applied to included cohort studies and case series for quality and risk assessment. Eight items are assessed for each included study, and each item is scored on a scale of 0 to 2 (0 = unreported, 1 = underreported, and 2 = adequately reported). Scores of 0 to 4 indicate very low quality, 5 to 7 indicate low quality, 8 to 12 indicate fair quality, and ≥13 indicate high quality.
Statistical Analysis
RevMan 5.4 software (Review Manager; Cochrane) was used to estimate the pooled effect size for each outcome. Mean differences (MDs), effect sizes, odds ratios (ORs), and corresponding 95% CIs 13 were calculated for quantification of treatment effects, and P < .05 was considered statistically significant. The I2 statistic was used to examine the heterogeneity between studies, where I2 < 60% was considered within acceptable heterogeneity, and a fixed-effects model was applied; otherwise, a random-effects model was used. When greater heterogeneity occurred, further sensitivity analyses or subgroup analyses were performed to find a potential source of heterogeneity if necessary. For the primary outcome (AOFAS score), subgroup analyses were performed according to surgical procedure and defect size.
Results
Literature Search Findings
PubMed, Web of Science, Embase, and the Cochrane Library were searched according to the identified keywords, and a total of 4375 articles were retrieved. After removal of 2189 duplicate articles, the titles and abstracts of the remaining 2186 articles were screened, and 2170 articles were removed according to the inclusion and exclusion criteria. The full text of 16 articles was then further assessed. Ultimately, 9 studies § met our eligibility criteria: 7 studies13,15,16,22,25,28,45 reported AOFAS scores, 5 studies15,23,25,28,46 included VAS pain scores with extractable data, and 3 studies15,16,46 mentioned complications or adverse events. The details of the study selection process are shown in Figure 1.

PRISMA (Preferred Reporting Items for Systematic Reviews and Meta-Analyses) flow diagram of the study selection process.
Study Characteristics
The characteristics of the included studies are shown in Table 1. There were 2 prospective cohort studies,15,28 5 retrospective cohort studies,16,23,25,45,46 and 2 case series13,22 published with comparative surgical treatment of OLTs with and without cysts. A total of 165 patients with OLT who had cysts (cyst group) and 223 patients without cysts (noncyst group) were included, with a mean age of 36.77 years (range, 12-74 years) and a mean follow-up time of 33.44 months (range, 6-117 months). The VAS pain and AOFAS scores were extracted as shown in Tables 2 and 3, respectively. In all studies, the postoperative scores were significantly higher than the preoperative scores (P < .05). One study 25 did not report preoperative data separately for the cyst and noncyst groups, and the remaining studies reported no significant difference in preoperative VAS pain or AOFAS scores between the cyst and noncyst groups.
Characteristics of the Included Studies a

AAS, Ankle Activity Score; AOFAS, American Orthopaedic Foot and Ankle Society Ankle Hindfoot Scale; AMIC, autologous matrix-induced chondrogenesis; BMS, bone marrow stimulation; CG, cyst group; CS, case series; FADI, Foot and Ankle Disability Index score; F, female; FAOS, Foot and Ankle Outcome Score; FFI, Foot Function Index; IKDC, International Knee Documentation Committee form; LOE, level of evidence; M, male; NA, not available; NG, noncyst group; OAT, osteochondral autologous transplant; PCS, prospective cohort study; RCS, retrospective cohort study; VAS, visual analog scale.
Data are reported as mean ± SD or mean (range).
Individual data extraction of VAS pain scores for each group was not possible.
Pre- and Postoperative VAS Pain Scores From the Included Studies a

Data are reported as mean ± SD.
Significantly different compared with cyst group (P < .05).
Individual data extraction for each group was not possible.
Pre- and Postoperative American Orthopaedic Foot and Ankle Society Scores From the Included Studies a

Data are reported as mean ± SD.
Significantly different compared with cyst group (P < .05).
Individual data extraction for each group was not possible.
Quality Assessment
The MINORS scores of the included cohort studies and case series are shown in Table 4. The mean score was 10.9, indicating overall fair quality of the included studies.
Quality Assessment of the Nonrandomized Studies With the MINORS Criteria a

Only the noncomparative part of the MINORS criteria (ie, first 8 items) was used. Items are graded as 0, high risk; 1, medium risk; or 2, low risk. Maximum score is 16. CS, case series; MINORS, Methodological Index for Non-randomized Studies; PCS, prospective cohort study; RCS, retrospective cohort study.
MINORS items: 1 = a clearly stated aim; 2 = inclusion of consecutive patients; 3 = prospective collection of data; 4 = endpoints appropriate to the aim of the study; 5 = unbiased assessment of the study endpoint; 6 = follow-up period appropriate to the aim of the study; 7 = loss to follow up <5%; and 8 = prospective calculation of the study size.
Scores of 0-4 indicate very low quality, 5-7 low quality, 8-12 fair quality, and ≥13 high quality.
Comparison of Postoperative AOFAS Scores
Seven studies13,15,16,22,25,28,45 compared the AOFAS score between cyst and noncyst groups at the last follow-up; included in the comparison were 284 patients (124 patients with cystic changes, 160 patients without). No significant heterogeneity was found between the studies (I2 = 0%; P = .50). Pooled results showed a significantly higher AOFAS score in the cyst group (MD = 0.35; 95% CI, 0.11 to 0.59; Z = 2.81; P = .005) (Figure 2A).

Forest plots showing comparisons of the postoperative American Orthopaedic Foot and Ankle Society (AOFAS) score between the cyst and noncyst groups. (A) All studies with AOFAS score. (B) Subgroup analysis by follow-up time (24 months). IV, inverse variance.
Subgroup Analysis by Follow-up Time
Included in the analysis were 2 studies13,22 with a follow-up time of ≤24 months and 5 studies15,16,25,28,45 with a follow-up time of >24 months, comprising 284 patients (124 patients with cystic changes, 160 patients without). The results showed a significant difference between the groups at both 12 months (MD = 1.97; 95% CI, 0.36 to 3.57; Z = 2.40; P = .02) and 24 months (MD = 2.04; 95% CI, 0.17 to 3.91; Z = 2.13; P = .03), with the cyst group having higher AOFAS scores, similar to the summary result (P = .005) (Figure 2B).
Subgroup Analysis by OLT Area
Included were 4 studies13,15,16,28 with an OLT area of ≤150 mm2 and 2 studies22,25 with an OLT area of >150 mm2, comprising 260 patients (117 patients with cystic changes, 143 patients without). The combined results showed that when the OLT area was ≤150 mm2, the cyst group exhibited a significantly higher AOFAS score (MD = 1.87; 95% CI, 0.54 to 3.19; Z = 2.77; P = .006). When the OLT area was >150 mm2, no significant difference was seen between the groups (MD = 2.79; 95% CI, −0.48 to 6.07; Z = 1.67; P = .09) (Figure 3A).

Forest plots showing comparisons of the postoperative American Orthopaedic Foot and Ankle Society (AOFAS) score between the cyst and noncyst groups. (A) Subgroup analysis according to OLT size cutoff of 150 mm2. (B) Further subgroup analysis of studies with OLT size ≤150 mm2 according to surgical procedure. BMS, bone marrow stimulation; IV, inverse variance; OAT, osteochondral autologous transplant; OLT, osteochondral lesion of the talus.
In the 4 studies13,15,16,28 with an OLT area of ≤150 mm2, further subgroup analysis was performed according to surgical procedure. Included in the analysis were 2 studies16,28 that primarily used BMS (including microfracture and drilling) and 2 studies13,15 that primarily used OAT, with 200 patients (85 patients with cysts, 115 patients without). No significant heterogeneity was seen among the included studies (I2 = 58%; P = .07). The combined results showed a significantly higher AOFAS score in the cyst group when OAT was performed (MD = 2.17; 95% CI, 0.57 to 3.77; Z = 2.65; P = .008). No significant group difference in scores was seen when BMS was performed (MD = 1.22; 95% CI, –0.14 to 3.58; Z = 1.02; P = .31) (Figure 3B).
Subgroup Analysis by Surgical Procedure
Two studies16,28 performed BMS and 5 studies13,15,,22,25,45 performed OAT; included were 284 patients (124 patients with cystic changes, 160 patients without). The combined results showed a significantly higher AOFAS score in the cyst group when OAT was performed (MD = 2.28; 95% CI, 0.86 to 3.70; Z = 3.14; P = .002). No significant difference between the groups was seen when BMS was performed (MD = 1.22; 95% CI, –1.14 to 3.58; Z = 1.02; P = .31) (Figure 4A).

Forest plots showing comparisons of the postoperative American Orthopaedic Foot and Ankle Society score between the cyst and noncyst groups. (A) Subgroup analysis according to surgical procedure: bone marrow stimulation (BMS) vs osteochondral autologous transplant (OAT). (B) Further subgroup analysis of OAT studies according to defect size. IV, inverse variance; OLT, osteochondral lesion of the talus.
Within the studies that performed OAT, further subgroup analysis was performed according to the OLT defect cutoff size of 150 mm2. Four of these studies13,15,22,25 mentioned OLT area (including 120 patients: 52 patients with cystic changes and 68 patients without): 2 studies13,15 had an OLT area of ≤150 mm2, and 2 studies22,25 had an OLT area of >150 mm2. The combined results showed that within the studies that performed OAT, when the OLT area was ≤150 mm2, there was a significantly higher AOFAS score in the cyst group (MD = 2.17; 95% CI, 0.57 to 3.77; Z = 2.65; P = .008). The group difference was not significant when the OLT area was >150 mm2 (MD = 2.79; 95% CI, –0.48 to 6.07; Z = 1.67; P = .09) (Figure 4B).
Comparison of Postoperative VAS Pain Scores
Five studies15,23,25,28,46 compared postoperative VAS pain scores, including 286 patients (129 patients with cystic changes, 157 patients without). The included studies had no significant heterogeneity (I2 = 0%; P = .97). Pooled results showed no significant group difference in VAS pain scores (MD = 0.04; 95% CI, –0.24 to 0.33; Z = 0.29; P = .77) (Figure 5).
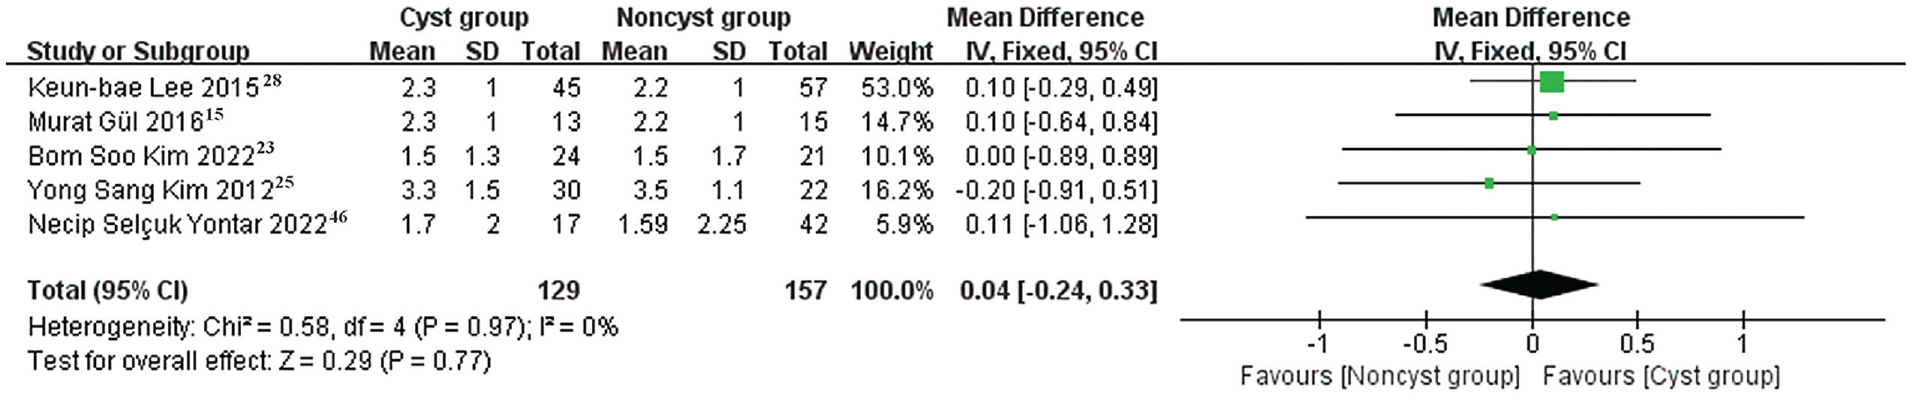
Forest plot showing comparison of postoperative pain visual analog scale score between the cyst and noncyst groups. IV, inverse variance.
Comparison of Postoperative Adverse Events
Three studies compared the occurrence of postoperative adverse events between cyst and noncyst groups, including 125 patients (50 patients with cystic changes, 75 patients without). Pooled results showed no significant differences between the groups (OR = 1.95; 95% CI, 0.49 to 7.80; Z = 0.94; P = .35) (Figure 6).

Forest plot showing comparison of postoperative adverse events between the cyst and noncyst groups. M-H, Mantel-Haenszel.
Discussion
The functional outcome measures of the 9 included studies ‖ showed improvement in all patients compared with before surgery. Based on studies with evidence levels of 2 to 4, the results of this meta-analysis indicated a significant difference in postoperative AOFAS scores between patients with cysts and those without cysts, with the cyst group showing higher scores than the noncyst group (P = .005). No significant differences were found between the 2 groups in terms of postoperative VAS pain scores (P = .77) or the occurrence of adverse events (P = .35). Subgroup analysis indicated that when the defect area was <150 mm2 and/or OAT was performed, the cyst group yielded a better postoperative AOFAS score than the noncyst group (P < .05). Therefore, we speculate that a smaller defect area and/or the use of OAT surgery may be more beneficial to the treatment of OLT, and the existence of some cysts may even play a positive role in surgical outcomes.
The presence of cysts was not an independent predictor of poor postoperative outcome. Choi et al,7,8 conducted analyses of factors influencing the clinical efficacy of OLT and found that the presence of cysts did not disrupt the prognosis of surgery. Clinical evidence has also shown that satisfactory clinical and imaging results have been obtained after OLT surgery with cysts, and most of the results are good to excellent.29,38,47 The included cohort studies, in patients both with and without cysts (especially OLT size ≤150 mm2), showed similar good clinical outcomes.15,16,25,28 Choi et al 8 pointed out that it has been proven that the “size of osteochondral defect” and “the number of intra-articular lesions” of the talus are highly related to AOFAS score, whereas subchondral cyst and chronic ankle instability are not related to clinical results, and the complexity of intra-articular abnormality itself is the cause of adverse clinical results. It is predictable that the prognosis of OLT may also be related to the size, depth, and number of cysts themselves; however, based on the current lack of high-quality evidence, the result of our meta-analysis suggests that the assertion that the presence of cysts worsens efficacy may not be true.
Lesion size has been widely accepted as the most commonly used clinical prognostic indicator for treatment of OLT,8,35 because larger lesions will change the contact stress of the ankle joint, resulting in poor clinical results. 10 The threshold for assessing the defect area is 150 mm2, beyond which the clinical score of OLT significantly decreases after BMS. 9 Therefore, we conducted a subgroup analysis based on OLT area, and the results showed that the size of the lesion area was one of the factors affecting the difference between the 2 groups. The cyst group performed significantly better than the noncyst group on the AOFAS Ankle Hindfoot Scale when the OLT area was ≤150 mm2 (P = .006), but there was no group difference when the area was >150 mm2. When reviewing the literature, we found that it is rarely mentioned that the surgical results of small-area OLTs (size ≤150 mm2) with cysts will be better.
BMS is commonly performed for the treatment of small- and medium-area OLTs with or without subchondral cysts,4,11 but for patients with large defects or large cystic depth, autologous/allogeneic osteochondral or autologous chondrocyte transplant is recommended to restore the cartilage and subchondral supporting structure of the talus surface defect.14,40 A number of successful results have been reported for OAT applied to subchondral cysts.2,40 A 2021 study 17 found that in the treatment of medium-sized OLTs (around the critical size of 150 mm2), the natural hyaline cartilage introduced by OAT seemed to lead to higher quality repair, with higher MOCART (magnetic resonance observation of cartilage tissue) scores and lower rates of cyst, edema, revision, or pain in patients with OAT. In the current review, subgroup analysis indicated that the presence of a subchondral cyst was not associated with worse AOFAS scores when the OLT was treated with an OAT procedure (better outcomes for the cyst vs noncyst group; P = .002). Given the premise that the defect size was small (≤150 mm2), subgroup analysis by surgical procedure also showed that OAT led to better outcomes for the cyst versus noncyst group (P = .008). However, the gold standard for the treatment of OLT with cysts has not yet been found.
Limitations
The limitations of this study are several and include that the sample size was small for a meta-analysis. In addition, we included studies with level 2 to 4 evidence or low methodological quality. The rationale for not conducting a meta-analysis of high-level evidence was that participants could not be randomized to the intervention, and the available studies in this field provide sparse high-level evidence. The appropriate follow-up time for evaluation scores has been debated in earlier studies,3,5,24,44 especially 12 or 24 months. We included studies with a follow-up period of >12 months and conducted a subgroup analysis with a threshold of 24 months; the results showed a significant difference between the cyst and noncyst groups at 12 or 24 months, a finding that is also consistent with the total result (P < .05). Limited research is available that describes and categorizes the cause of OLT, such as a history of trauma, and there are also slight differences in postoperative rehabilitation protocols, including weightbearing time, which may contribute to potential variations.
Accurate meta-analysis is difficult to achieve given the observed heterogeneity of the patient population (in factors such as preoperative score and cyst size), the diversity of evaluation results, and the release of incomplete data. Future studies should establish a deliberate comparison of treatment for OLT with and without cysts to increase the homogeneity and consistency of the results. Larger multicenter, high-quality cohort studies are needed to verify the results of the meta-analysis.
Conclusion
Our systematic review suggests that all patients will improve with surgical treatment of OLT. A relatively low level of evidence indicates that surgical treatment for small OLTs with subchondral cysts may result in better clinical outcomes. However, insufficient high-level evidence is available to answer our initial question. More detailed and higher evidence studies may be needed to help answer this important clinical question.
Footnotes
Final revision submitted July 17, 2023; accepted August 10, 2023.
The authors have declared that there are no conflicts of interest in the authorship and publication of this contribution. AOSSM checks author disclosures against the Open Payments Database (OPD). AOSSM has not conducted an independent investigation on the OPD and disclaims any liability or responsibility relating thereto.