
Abstract
Background:
An increased posterior tibial slope (PTS) corresponds with an increased risk of graft failure after anterior cruciate ligament (ACL) reconstruction (ACLR). Validated methods of manual PTS measurements are subject to potential interobserver variability and can be inefficient on large datasets.
Purpose/Hypothesis:
To develop a deep learning artificial intelligence technique for automated PTS measurement from standard lateral knee radiographs. It was hypothesized that this deep learning tool would be able to measure the PTS on a high volume of radiographs expeditiously and that these measurements would be similar to previously validated manual measurements.
Study Design:
Cohort study (diagnosis); Level of evidence, 2.
Methods:
A deep learning U-Net model was developed on a cohort of 300 postoperative short-leg lateral radiographs from patients who underwent ACLR to segment the tibial shaft, tibial joint surface, and tibial tuberosity. The model was trained via a random split after an 80 to 20 train-validation scheme. Masks for training images were manually segmented, and the model was trained for 400 epochs. An image processing pipeline was then deployed to annotate and measure the PTS using the predicted segmentation masks. Finally, the performance of this combined pipeline was compared with human measurements performed by 2 study personnel using a previously validated manual technique for measuring the PTS on short-leg lateral radiographs on an independent test set consisting of both pre- and postoperative images.
Results:
The U-Net semantic segmentation model achieved a mean Dice similarity coefficient of 0.885 on the validation cohort. The mean difference between the human-made and computer-vision measurements was 1.92° (σ = 2.81° [P = .24]). Extreme disagreements between the human and machine measurements, as defined by ≥5° differences, occurred <5% of the time. The model was incorporated into a web-based digital application front-end for demonstration purposes, which can measure a single uploaded image in Portable Network Graphics format in a mean time of 5 seconds.
Conclusion:
We developed an efficient and reliable deep learning computer vision algorithm to automate the PTS measurement on short-leg lateral knee radiographs. This tool, which demonstrated good agreement with human annotations, represents an effective clinical adjunct for measuring the PTS as part of the preoperative assessment of patients with ACL injuries.
Keywords
Anterior cruciate ligament (ACL) reconstruction (ACLR) generally leads to favorable overall outcomes; however, recurrent ACL injury (ipsilateral or contralateral) may occur in up to 20% to 30% of cases.1,14 These studies typically cite younger age, female sex, higher activity level, allograft use, coronal malalignment, and unrecognized concomitant pathology (among others) as factors that can increase the risk of failure after ACLR.5,16,25 Recently, hyperlaxity, high-grade pivot shift, and tibial slope have also come to be recognized as important variables in predicting outcomes after ACLR.7,8,22
The posterior tibial slope (PTS)—a measure of sagittal alignment—is an important risk factor when considering patients for primary or revision ACLR. 26 The PTS influences knee biomechanics by affecting anterior tibial translation.4,22 An increase in the PTS has resulted in increased anterior tibial translation and increased strain on the ACL, with every 10° increase in the PTS resulting in 6 mm of increased anterior translation. 22 Two studies have demonstrated an association between increased PTS and increased risk of graft rupture after ACLR.6,22
The PTS is characterized by the angle between the line perpendicular to the tibia and the line tangent to the medial or lateral tibial plateau for the medial or lateral PTS, respectively. Overall, several measurement techniques involving various types of radiographs—weightbearing, short-leg vs full-length, proximal tibial axis vs middiaphyseal axis, and midpoint vs circle method—have been described.10,12,15,23,32 Likewise, although morphological disparities exist in anatomy, such as the PTS, recent studies have demonstrated the mean medial PTS to be near 6.9° and the mean lateral PTS to be near 4.7°—with a range of 7° to 10° for the medial and 4° to 7° for the lateral PTS. 22 While there is no current consensus on (1) the method of measurement and (2) the importance of the medial versus the lateral tibial slope in assessments for ACLR, a recent study has demonstrated that medial PTS measurements comparing short-leg lateral knee and full-length lateral tibial radiographs with regard to the anatomic axis provide similar measurements when using the middiaphyseal axis method for measurement. 10
Artificial intelligence (AI) has been increasing in orthopaedic surgery. 20 By providing a method to analyze high-dimensional data, machine learning allows us to create accurate predictions when intervariable relationships are too complex for traditional statistics. 21 Deep learning—a subset of machine learning—provides digitization of images and videos for analysis by computer software in an automated fashion. 19 One application of deep learning—computer vision—allows automated processes such as face recognition, optical character recognition, and automated identification of lesions or regions of interest in medical imaging. 33 Recent studies have demonstrated deep learning to be faster, as accurate, and more efficient compared with experts with automated measurements in orthopaedic imaging.28-31 One of the issues in measuring the PTS is that the process is relatively labor-intensive and time-consuming for busy clinicians. This also makes it more difficult to perform research on large numbers of patients that all require manual calculation of the PTS. AI has the potential to overcome the challenges of manual measurement. Still, no studies have explored applications of deep learning in PTS measurements.
This study aimed to develop a deep learning tool that (1) can automatically measure the PTS on a given lateral radiograph and (2) has good agreement, defined by a mean difference of ±2° compared with expert human measurements. We hypothesized that this deep learning tool would be able to measure the PTS on a high volume of radiographs expeditiously and that these measurements would be similar to previously validated manual measurements.
Methods
The study protocol received institutional review board approval. Informed consent was provided for patient participation in the Rochester Epidemiology Project (REP), which included the use of patient data for research purposes. The planned deep learning tool is a pipeline that consists of a semantic segmentation model followed by an image processing algorithm. First, we generated a semantic segmentation model to automatically recognize and segment the anatomic landmarks on a radiograph required for measuring the tibial shaft, tibial tuberosity, and the tibial joint surface. Segmentation is a subdomain of computer vision whereby algorithms are trained to accurately group pixels within a region of interest into the correct class labels, or in other words, to provide maps outlining the objects in each image. 19 After this, we deployed an image processing algorithm that transforms and processes digital signals, such as pixel data, into numerical values to perform the desired measurements. A general workflow for developing this tool is outlined in the flowchart provided in Figure 1.
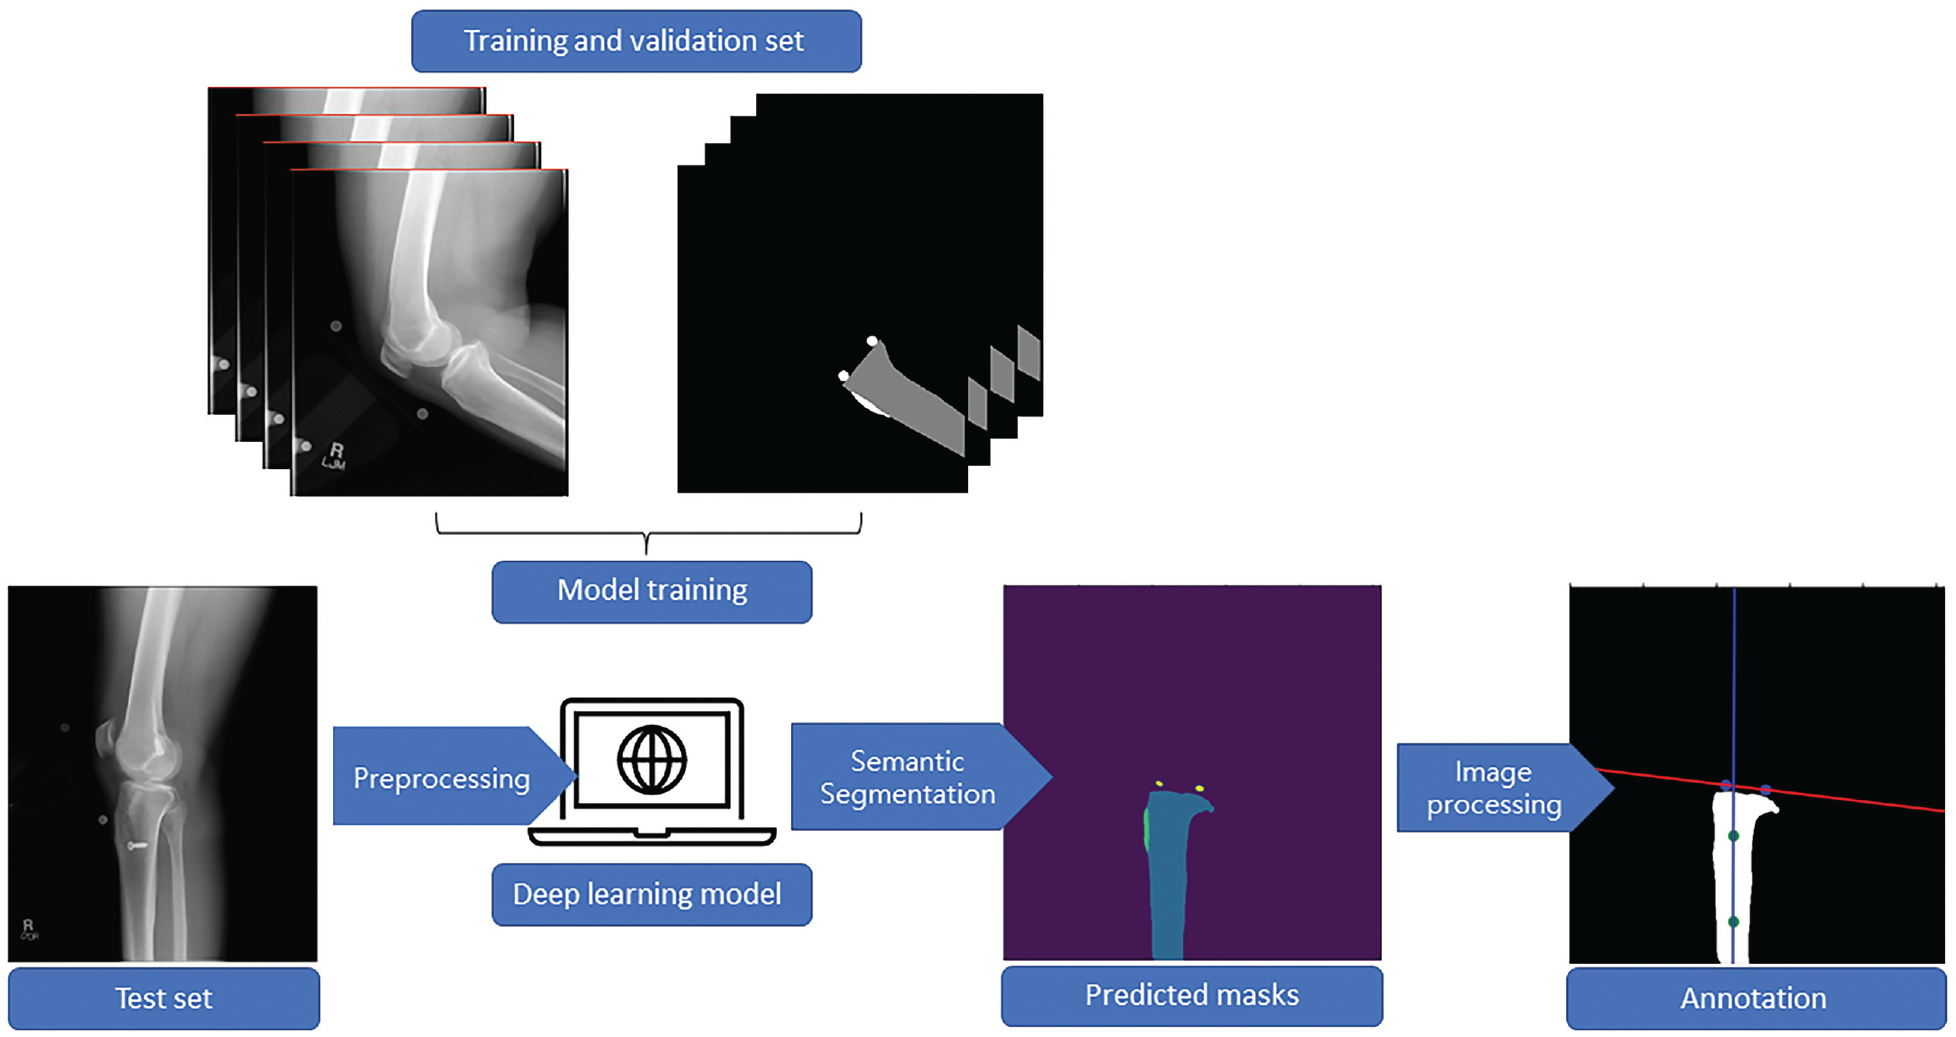
Representative workflow for developing the deep learning computer vision tool for automated posterior tibial slope measurement. First, the training and validation set was curated and manually segmented. Second, data were fed into the model, which learned to recognize and segment the appropriate areas on new radiographs. Finally, the model-generated masks were fed into an image-processing pipeline for angle calculations.
Data Source
A total of 300 postoperative short-leg lateral radiographs were retrospectively collected from patients who were diagnosed with an ACL injury and underwent subsequent ACLR. Patients were identified utilizing the Rochester Epidemiology Project, an established longitudinal geographic database of >500,000 medical records for residents of Olmstead County, Minnesota, as well as neighboring counties in southeast Minnesota and western Wisconsin. 24 This sample size was chosen based on previous work that demonstrated the training of effective 2-dimensional (2D) segmentation models with a similar cohort size. 29 Patients were identified utilizing a geographical longitudinal database. For our specific task, training images were balanced to maintain a 1 to 1 ratio of patient sex and a 1 to 1 to 1 ratio of the graft type utilized—allograft, bone–patellar tendon–bone autograft, and hamstring autograft. To reflect real-work clinical and research practices, images were not discriminated based on fixation method (screws, suspensory, buttons, etc), fixation materials (metal, biocomposite, etc), or tunnel configuration (sockets, full tunnels, etc). Notably, we did not exclude radiographs with concomitant ligamentous reconstructions to assess the fidelity of model performance. These images were randomly divided into training and validation sets utilizing an 80 to 20 train-validation split.
Semantic Segmentation
After data curation, these images were segmented by 2 authors (Y.L., A.P.) with both clinical orthopaedic knowledge at the resident level and programming expertise utilizing 3D Slicer (Version 4.13.0; Slicer Community). Specifically, the first 20 images were segmented in concert with the senior author (C.L.C.), a sports medicine fellowship–trained orthopaedic surgeon with >5 years of practice experience, who also randomly selected and validated a batch of 20 images from the final segmentation images. The senior author manually segmented the tibial shaft, the tibial tuberosity, and the tibial joint surface into pixel masks. For the first 2 landmarks, a simple brush tool was used to outline each area on the radiograph, where one dot was used to mark the anterosuperior margin of the tibial plateau for the joint surface and another dot was used to mark the posterosuperior margin of the tibial plateau.
We then supplied the human-made masks—otherwise termed the “ground-truth” segmentations—and the original radiographs to a U-Net Convolutional Neural Network (CNN) model to train it for automated segmentation. The model attempts to iteratively reproduce the ground-truth segmentations on the original radiographs until it has fully learned the features that help it accurately recognize each anatomic landmark. We used an EfficientNet-B7 as the encoder of the U-Net model, with initialization weights pooled from a pretrained model on the ImageNet database using noisy-student distillation. ImageNet is a free, publicly available collection of 14,197,122 object images for training computer vision algorithms (Stanford Vision Lab). 13 The U-Net model was trained for 400 epochs using the Adam optimizer, 18 with a batch size of 8 and a learning rate of 0.001. The best-performing candidate model was selected based on the maximization of the Dice similarity coefficient (DSC), which is a measure of the overlap of the pixels from the manually contoured ground truth segmentations from the primary author and the predicted segmentations by the model, with a DSC of >0.820 considered the lower range of acceptable based on previous work.11,35 The U-Net model was trained on an NVIDIA GeForce graphics processing unit (GPU) (NVIDIA Corporation) with 24 gigabytes of random-access memory using the Medical Open Network for AI (MONAI; Version 0.8.0) running on Python (Version 3.9; Python Software Foundation).
Image Processing Workflow
An imaging processing pipeline was developed to measure the tibial slope on the automatically generated masks subsequently. Four masks were generated, representing the outline of the tibia up to the level of the joint surface, the tibial joint surface, the approximate location of the tibial tuberosity, and the background of the image, respectively. To highlight the pixels of each mask as a region of interest for image processing, each mask was finally converted to a single-channel image via the application of an argmax function. Each pixel value in this final image represented a unique region of interest: for example, pixels within the tibial mask region were assigned a value of 1, those in the joint surface region a value of 2, those in the tuberosity region a value of 3, and the rest of the image assigned a value of 0. This approach helps to delineate the exact location of the anatomic landmarks on the original radiograph.
After image segmentation, the regionprops module from the Scikit-Image Python library (Version 0.19.2) was used to estimate the PTS based on the relative spatial positions of the pixels in the 2D plane. First, independent nonzero regions <150 pixels were removed from each image to filter only the regions of interest from the argmax output and ignore the noise in segmentation maps. Second, the center of the 2 points highlighting the tibial joint surface was identified using the centroid function, and a line (heretofore designated as the joint surface line) fitted through them. Third, the distance of all nonzero pixels in the tibia mask to the joint surface line was calculated, and the pixels coplanar with the tuberosity masks were removed to prevent offset by the curvature of the proximal posterior cortex of the tibia. Fourth, a straight line was fitted through the remaining pixels of the tibia mask (heretofore designated as the tibial axis line). Finally, the angle between the joint surface line and the tibial axis line was measured, and the PTS was calculated in degrees by subtracting this measurement from 90.
Output and Evaluations
The final pipeline of segmentation and image processing algorithms was deployed on a random cohort of 90 short-leg lateral knee radiographs, identified using the Rochester Epidemiology Project, for performance evaluation. To evaluate the generalizability of our algorithm to preoperative radiographs, we included a 50 to 50 split of pre- and postoperative images in the test set. There was no data leakage between the original images used for training and validation of the semantic segmentation model and the images within the test set.
For comparisons with human measurements, the images were manually annotated by the senior author and a sports fellowship–matched postgraduate year 5 orthopaedic surgery resident (A.P.) utilizing 3D Slicer (Version 4.13.0), based on the methods first described by Utzschneider et al. 32 Briefly, 2 transverse lines connecting the anteroposterior cortices of the tibia were drawn at approximately 5 and 15 cm from the tibial joint surface, a line was drawn connecting the midpoints of these 2 lines, and the angle subtended by this line and a line parallel to the tibial joint surface was measured and subtracted from 90 to give the PTS (Figure 2). Given that obliquity can affect PTS measurements, images that were deemed insufficient in quality were eliminated from the annotation pool based on 2 parameters: (1) complete overlap of the femoral condyles and (2) images distally extending to include the entirety of the tibial tubercle and at least the proximal third of the tibial shaft.
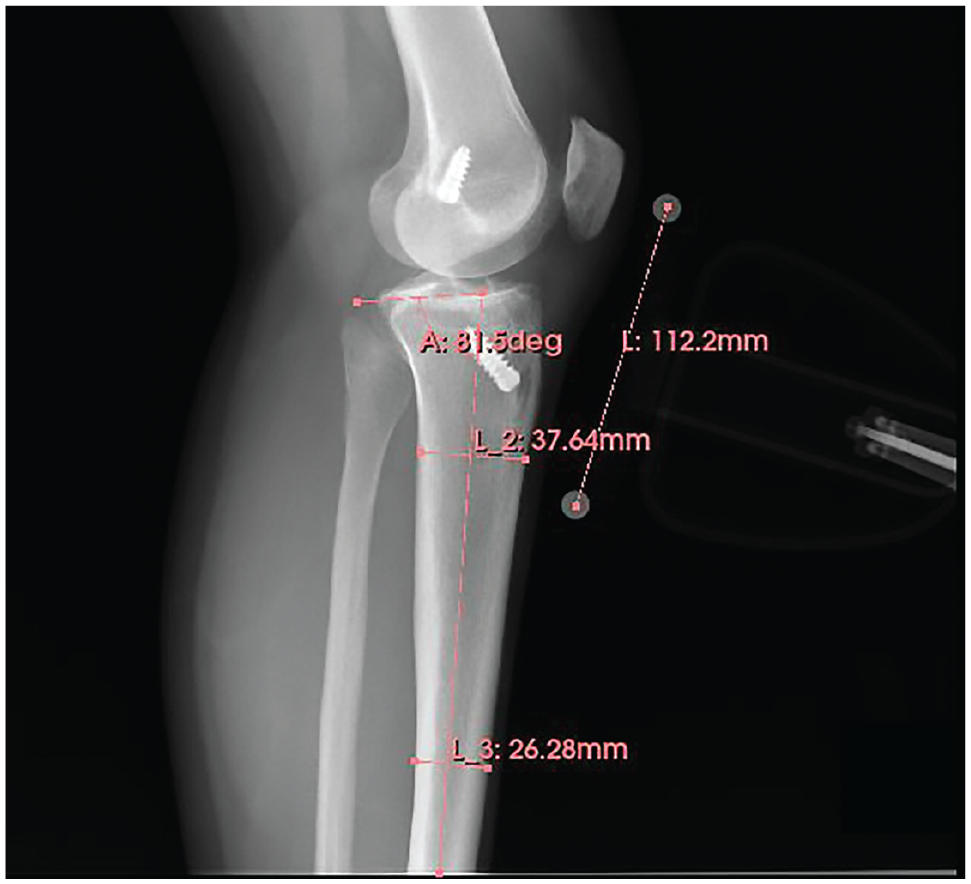
Sample human annotation of the tibial slope on a lateral knee radiograph using the technique by Utzschneider et al. 32 Distances were standardized and calibrated using the magnification marker. A, angle; L, length.
The human measurements were then compared with machine-level measurements utilizing a 2-tailed 2-sample t test assuming equal variance. Moreover, visual comparisons of the extent of agreement between the measurement methods were demonstrated using a Bland-Altman plot. Finally, a scatterplot was generated between the PTS and measurement differences to assess whether there was a correlation in the magnitude of human-machine differences in measurement with increasing PTS. Of note, the 2 human annotators (A.P., C.L.C.) measured 45 overlapping images to provide a benchmark assessment of human level interrater reliability, as measured by the Cohen kappa coefficient, 27 and a tolerable margin of error for measurements made by the computer vision tool.
The final model was incorporated into a web-based digital application using a combination of FastAPI Version 0.75.1 (Sebastián Ramírez) for server-side computations and the Streamlit Version 1.8.0 (Streamlit Inc) application framework for designing the user interface. The application is compatible with both Portable Network Graphics and Digital Imaging and Communications in Medicine formats and is tailored for work with medical imaging. The software runs through a web browser and can be easily deployed on computing specifications common to most clinical workspaces without the need for a GPU. The time for segmentation and measurement from a single raw image was then measured in triplicates on a Windows machine with an Intel Core-i7-9750H central processing unit and 16 gigabytes of random-access memory.
Results
A total of 390 patients, with a mean (±SD) age of 28.6 (±10.9) years, with 390 radiographs were included in the study cohort, of whom 50% were women. A comparison of patient demographic and intraoperative information for the training and testing cohorts is provided in Table 1. Following convergence of the semantic segmentation U-Net model, evaluation was performed on the validation set for every 2 epochs of training; the final model demonstrated a mean DSC of 0.872 in segmentation of the short-leg lateral radiographs (Table 2).
Demographic and Intraoperative Characteristics of the Training and Testing Cohorts a
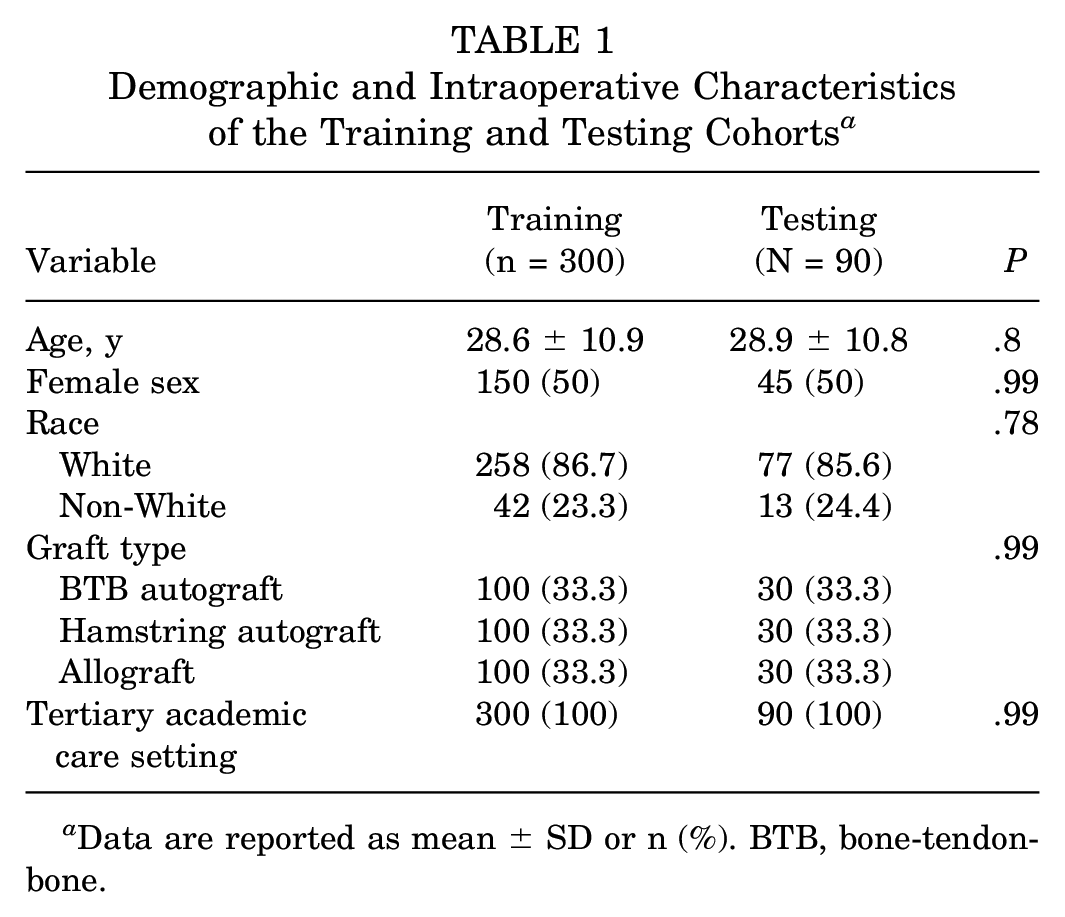
Data are reported as mean ± SD or n (%). BTB, bone-tendon-bone.
Performance of the U-Net Semantic Segmentation Model on Validation Set a

DSC, Dice score coefficient.
Perfect overlap between human-made and predicted segmentations has a DSC of 1; generally, acceptable semantic segmentation models 35 have DSCs of ≥0.8.
When specific DSCs for individual mask layers were evaluated, the highest value was present within the tibial segmentations, with a DSC of 0.912, followed by the tibial tuberosity segmentations, with a DSC of 0.908. Figure 3 demonstrates changes in the loss values and the DSC scores for the validation set converging during training. The model had the greatest difficulty characterizing the 2 points that denoted the tibial plateau joint surface, yielding a DSC of 0.835. However, this performance remained acceptable, as demonstrated by the results of the image processing algorithm for PTS measurement (Figures 4 and 5).
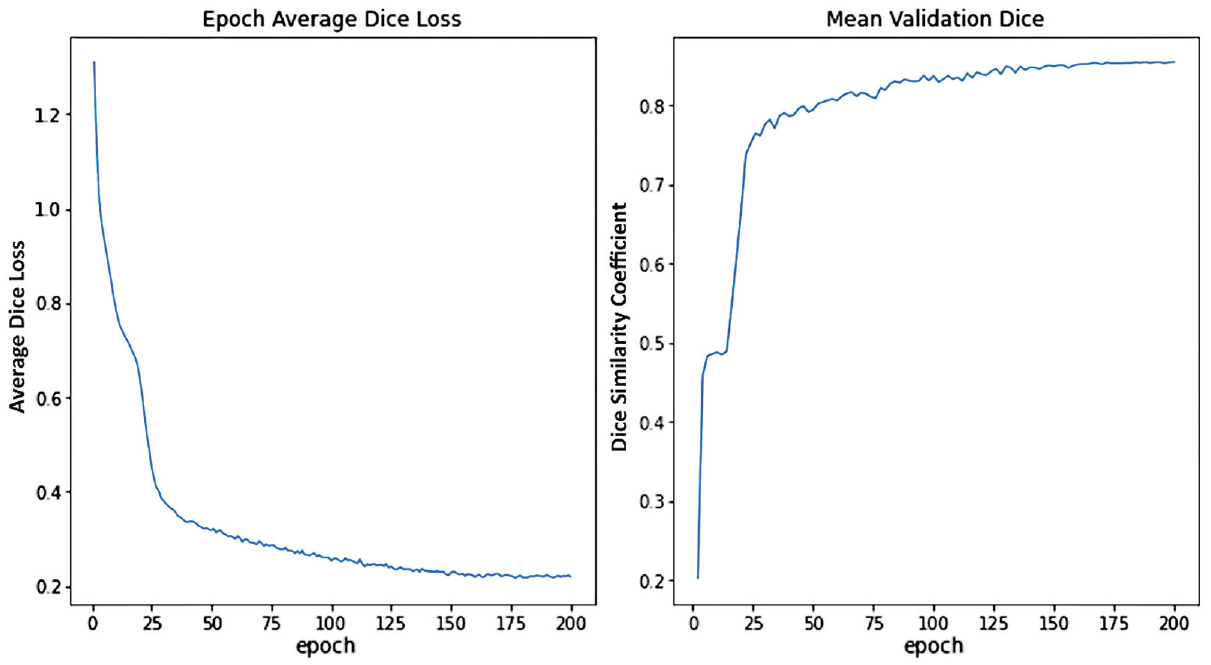
Training and validation performance of the semantic segmentation U-Net models. (A) Validation loss curve illustrating the Dice coefficient loss as a function of training epochs; (B) Validation Dice coefficient as a function of number of training epochs.

Overview of the pipeline for automatic PTS measurement on short-leg lateral radiographs in 2 patients after ACLR. (A) Original radiographic images, (B) overlay of semantic segmentation masks from the U-Net models on the original radiographs, and (C) best-fit lines through the joint surface and tibial anatomic axis through which the PTS can be measured. ACLR, anterior cruciate ligament reconstruction; PTS, posterior tibial slope.

(A) The Bland-Altman plot of differences between human and machine measurements as a function of the mean PTS between the 2 demonstrating a nonclinically significant undermeasurement of 0.5° by the machine annotator compared with human measurements. (B) The scatterplot of the magnitude of differences between AI and machine as a function of the human-measured PTS demonstrating a slight but nonsignificant trend toward increasing differences at greater PTS (P = .27). AI, artificial intelligence; PTS, posterior tibial slope.
Computer vision workflow resulting in the measurement of posterior slopes on 2 representative short-leg lateral knee radiographs is provided in Figure 4. The top row is an immediate postoperative radiograph with single direct compression graft fixation, while the bottom row is a postoperative radiograph of a multiply revised knee with several fixation methods and retained hardware.
Manual measurement of the PTS by the 2 orthopaedic surgeon annotators demonstrated a mean absolute difference of 1.30° (σ = 2.16°) across 45 overlapping images, reaching an interrater reliability of 0.84. When comparisons were made with human ground-truth measurements, the machine predictions made by our computer vision tool demonstrated a mean absolute difference of 1.92° (σ = 2.81°; P = .21). Figure 5 demonstrates neither significant asymmetric deviations from human measurements by the computer vision annotator nor an increase in the measurement difference as the slope increased. An assessment of outliers—defined as instances of absolute differences ≥5° between human and machine measurements—identified 4 images (4.44%). Upon closer inspection of the specific images, the tibial joint surface of 1 image was significantly obscured on all 4 images. These images are included in Appendix Figure A1 to illustrate the specific deviations between human and machine measurements.
The final model was incorporated into a digital application that provided real-time measurements (Figure 6). For the testing set of 90 images, this tool completed semantic segmentation and image processing to obtain angle measurements in <1 minute—significantly shorter than the manual annotation time estimated to be 180 minutes by the 2 annotators (P < .001). Raw images were processed utilizing the browser-based digital application with a mean time of 5 seconds. Pending external validation using noninstitutional images, the application can be easily deployed to the web using operating system virtualization tools such as Docker (Docker Inc).
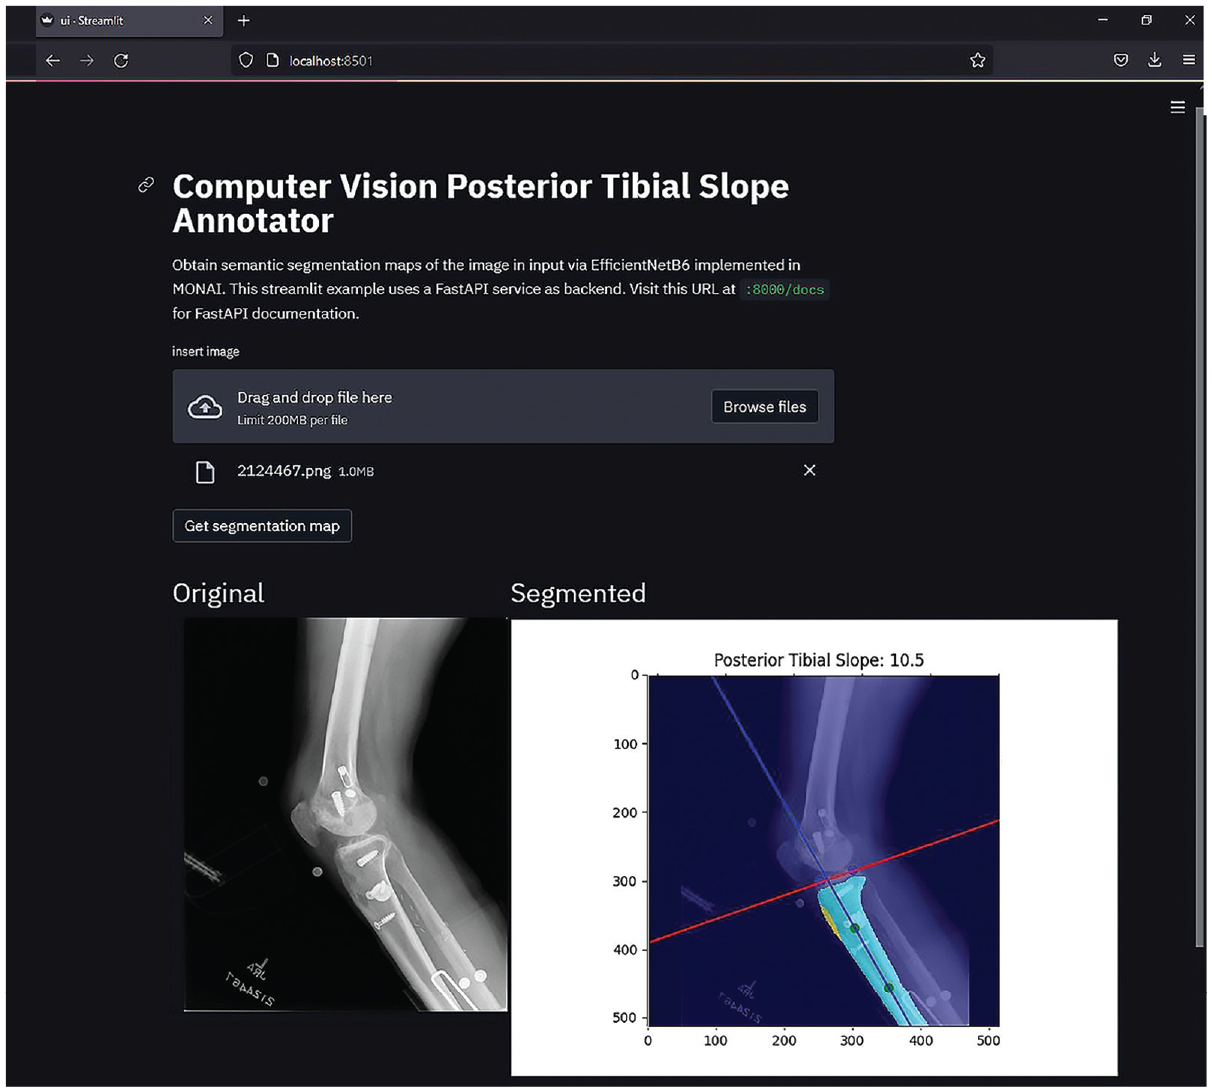
Screenshot from the Computer Vision Posterior Tibial Slope Annotator, a web-based application developed to demonstrate deployment of the semantic segmentation U-Net model and subsequent image processing workflow for annotating the PTS on short-leg lateral radiographs, with minimal user input. Currently supports both PNG and DICOM images. DICOM, Digital Imaging and Communications in Medicine; PNG, Portable Network Graphics; PTS, posterior tibial slope.
Discussion
We developed a deep learning computer vision tool to measure the PTS using short-leg knee lateral radiographs, with good agreement to human measurements. When supplied with a raw radiograph, the tool provided a PTS measurement in a mean time of 5 seconds. The DSC—as well as an assessment of the final PTS measurements—demonstrates a consistent performance of the segmentation models on patients after primary and revision ACLR as well as multiligamentous reconstructions.
The PTS has long been established as a crucial measurement with significant implications for knee biomechanics, and the increased slope has specifically been correlated to an increased risk of graft failure after ACLR. 22 Therefore, reliable PTS measurements are integral for risk stratification of patients during preoperative counseling for ACL surgery and postoperative follow-ups. At present, the gold-standard measurement of PTS requires human annotation of long-leg lateral radiographs. However, these require dedicated views that are not routinely obtained and lack generalizability. While several methods exist for manual annotation on short-leg lateral radiographs of the knee,10,12,22 we developed a fully automated deep learning AI that can rapidly process and annotate the PTS accurately and reproducibly.
Not unexpectedly, we observed the most challenging task for the semantic segmentation model to be outlining the tibial joint surface, as reflected by the lowest DSC score of 0.835. This is intuitive as the pixel number is the smallest in this mask layer relative to the tibial shaft and tuberosity. Therefore, the model optimization strategy is least affected by losses in this layer. However, a DSC >0.8 is still considered “good” to “excellent,” 34 and as empirically demonstrated, the image processing algorithm was still able to successfully measure the PTS angle within a tolerable margin of error. Currently, there remains no group consensus on a minimal clinically significant difference of the measured PTS, with numbers cited anywhere from ≥2 to ≥5.10,15 These error margins grow even larger when comparing measurements made with advanced imaging to those on plain radiographs. 15 When taking into account the literature threshold for error, the difference of 1.92° (σ = 2.81°) between the human and computer measurements—while acceptable—is more appealing when considering the speed and reproducibility by which the computer vision annotator can produce measurements. The current literature demonstrates variable intrarater reliability for PTS measurements with several techniques on radiography, computed tomography, or magnetic resonance imaging, ranging from 0.82 to 0.99; similarly, interrater reliability has been reported to range from 0.63 to 0.95.9,12,15,32 As previously demonstrated, the computer vision algorithm will exhibit perfect intrarater reliability and substantial interrater reliability with human annotators regardless of the washout period. 17 Furthermore, the computer vision annotator developed herein has an advantage in efficiency once incorporated into routine practice. With exponential increase in digitization of imaging data given more sophisticated warehousing and management technologies, this tool can be leveraged for imaging annotations that are not practical for clinicians. Finally, the technique using a calculated distance from the tibial joint surface to mark the trajectory of the angle requires the presence of a marker for scale. This need is removed by the computer vision tool, which improves its efficiency.
Several methods for digital measurements of the PTS have been described in previous studies; however, none are fully automated and deployable at the level of efficiency of the tool presented here. Amerinatanzi et al 2 developed a method of measuring the PTS from advanced imaging using traditional image processing techniques and performed measurements on 9 subjects. In another study, Amirtharaj et al 3 developed a similar method to perform tibial slope measurements using computed tomography and image processing utilizing 3 cadaveric knees. However, both methods require advanced imaging that is not yet the clinical standard of care for patients with ACL injuries and, therefore, remain limited in application to everyday clinical practice. Moreover, neither of the developed methods underwent a robust validation process, which the present study improved upon with a comparison of human annotations on a test set of 90 radiographs. Finally, while the angle measurements in these methods are automated, both tools remain dependent on user data input in segmenting the relevant areas of the tibia and the tibial joint surface, which, based on subjective feedback from the annotators, was the most labor-intensive and time-consuming component of the workflow. Following the protocol previously established by Rouzrokh et al, 29 our tool obviates the human segmentation process to achieve full automation of annotation, with the user only needing to supply the input image.
Any discussion of algorithm implementation needs to account for failure instances. A perfect lateral view—that is, complete overlap of the femoral condyles and distal extension to include the entirety of the tibial tubercle as well as the proximal third of the tibial shaft—is ideal, although not required, as the tool was effectively deployed on multiple skewed radiographs in the testing set. We intentionally did not seek a training dataset of perfect lateral images to increase the generalizability of the tool to the average orthopaedic practice, where radiography protocols may not be standardized and personnel not as experienced. In the present study, the amount of obliquity was judged based on visual inspection by the senior author, and there was no standardized measurement. Since both human and computer annotators are subject to nonuniformity in the quality of the radiographs, we would expect a degree of performance breakdown as the view obtained deviates from ideal; indeed, Utzschneider et al 32 identified a PTS measurement error of nearly 50% with ±40° of malrotation of the tibia. While the current expectation is that clinicians evaluate radiographs before measurement, future endeavors at automation may aim to preselect for acceptable lateral radiographs using another deep learning classifier before measurement.
Limitations
Several limitations need to be taken into consideration to appropriately interpret our findings. As noted previously, rotational changes to the orientation of the knee or the x-ray beam and the presence of hardware may distort or obscure the necessary anatomy. The work by Rouzrokh et al 29 observed increased deviation in model measurements of acetabular component position because of the interference by unusual hardware in the regions of interest such as plates for pelvic fixation. Fortunately, we did not observe this as the case for our tool. As illustrated in Figure 4, the segmentation model successfully segmented the masks despite the presence of significant hardware from previous surgeries. This is likely secondary to the ease with which the significant difference between radiographic attenuation of hardware and bone on can be recognized. In contrast, it is more difficult to differentiate the boundaries of an implant from overlapping radio-opaque hardware. However, our tool is unlikely to work in patients who have already undergone total knee arthroplasty , where the native osseous tibial joint surface will be obliterated by the presence of the implant. Second, the segmentation model was developed on radiographs from a single institution, which may limit its generalizability to data from other centers. Third, long-leg radiographs have historically been defined as the gold-standard medium for PTS measurement. We did not validate the computer vision annotator on these radiographs because of data availability; nonetheless, this and additional validation on multi-institution data are important in future considerations. Finally, it is important to recognize that this study does not validate the radiographic view of short-leg lateral compared with long-leg lateral, but rather validates the computer vision annotator compared with manual measurements.
Conclusion
We developed an efficient and reliable deep learning computer vision algorithm to automate the PTS measurement on short-leg lateral knee radiographs. This tool demonstrates good agreement with human annotations and will be deployed for clinical use on an institution-wide basis. This represents an effective clinical adjunct for PTS measurement as part of the preoperative assessment of patients with ACL injuries.
Footnotes
Appendix
Final revision submitted June 9, 2023; accepted June 19, 2023.
One or more of the authors has declared the following potential conflict of interest or source of funding: A.P. has received hospitality payments from Medical Device Business Services. K.R.O. has received education payments from Gemini Medical, Arthrex, Endo Pharmaceuticals, Pinnacle, Medwest Associates, and Smith & Nephew; consulting fees from Endo Pharmaceuticals and Smith & Nephew; nonconsulting fees from Smith & Nephew and Arthrex; a grant from Arthrex; and hospitality payments from Medical Device Business Services, Wright Medical Tech, and Zimmer Biomet Holdings. A.J.K. has received consulting fees from Arthrex, JRF Ortho, and Responsive Arthroscopy; nonconsulting fees from Arthrex; royalties from Arthrex and Responsive Arthroscopy; a grant from DJO; and honoraria from JRF Ortho and MTF Biologics. C.L.C. has received education payments from Arthrex, consulting fees from Arthrex, and nonconsulting fees from Arthrex. AOSSM checks author disclosures against the Open Payments Database (OPD). AOSSM has not conducted an independent investigation on the OPD and disclaims any liability or responsibility relating thereto.
Ethical approval for this study was obtained from the Mayo Clinic (ref No. PR14-005089-02).