
Abstract
Background:
Identifying atypical lower limb biomechanics may help prevent the occurrence or recurrence of running-related injuries. No reference values for spatiotemporal or kinetic variables in healthy recreational runners are available in the scientific literature to support clinical management.
Purpose:
To (1) present speed- and sex-stratified reference values for spatiotemporal and kinetic variables in healthy adult recreational runners; (2) identify the determinants of these biomechanical variables; and (3) develop reference regression equations that can be used as a guide in a clinical context.
Study Design:
Descriptive laboratory study.
Methods:
This study involved 860 healthy recreational runners (age, 19-65 years [38.5% women]) tested on an instrumented treadmill at their preferred running speed in randomly allocated, standardized running shoes with either hard or soft cushioning. Twelve common spatiotemporal and kinetic variables—including contact time, flight time, duty factor, vertical oscillation, step cadence, step length, vertical impact peak (VIP), time to VIP, vertical average loading rate, vertical stiffness, peak vertical ground-reaction force (GRF), and peak braking force—were derived from GRF recordings. Reference values for each biomechanical variable were calculated using descriptive statistics and stratified by sex and running speed category (≤7, 8, 9, 10, 11, 12, 13, 14, and ≥15 km/h). Correlations and multiple regression analyses were performed to identify potential determinants independently associated with each biomechanical variable and generate reference equations.
Results:
The mean running speed was 10.5 ± 1.3 km/h and 9 ± 1.1 km/h in men and women, respectively. While all potential predictors were significantly correlated with many of the 12 biomechanical variables, only running speed showed high correlations (r > 0.7). The adjusted R2 of the multiple regression equations ranged from 0.19 to 0.88.
Conclusion:
This study provides reference values and equations that may guide clinicians and researchers in interpreting spatiotemporal and kinetic variables in recreational runners.
Clinical Relevance:
The reference values can be used as targets for clinicians working with recreational runners in cases where there is a clinical suspicion of a causal relationship between atypical biomechanics and running-related injury.
Long-distance running is one of the most popular physical activities worldwide 15 and provides numerous health benefits.16,30 However, running-related injuries are common among novice, recreational, and experienced runners. 37 The consequences of running-related injuries may offset the health benefits of regular practice as injury has been identified as the main reason to stop running. 12
Most running-related injuries are located in the lower limbs,17,35 have a gradual onset,3,21 and are thought to originate from an imbalance between repetitive loading of biological tissue and its remodeling capacity. 9 A running pattern with atypical lower limb biomechanics has been proposed as a potential risk factor for running-related injury, given the effect of biomechanics on the distribution of loads across different body structures. Biomechanical factors, such as vertical loading rate, 34 step rate, 18 and contact time, 5 have been associated with running-related injury. Still, these findings are based on cross-sectional or prospective studies with limited sample sizes. While the current prospective evidence on potential biomechanical risk factors for running-related injury is inconsistent, 6 the factors describing how external forces are applied to the musculoskeletal system are interesting targets for preventive measures, as they are modifiable and thought to be involved in the causal mechanism.3,29 The effectiveness of gait retraining targeted at lowering loading rate has already been demonstrated to decrease injury risk in recreational runners. 7 However, further trials are required to define the most relevant biomechanical factors, allowing clinicians to deliver the proper intervention to the right patient.
The biomechanical analysis of running techniques has increased in popularity. Many clinicians offer advice on running biomechanics. Recent educational interventions have attempted to advise on proper running biomechanics, among others, to prevent injury but without knowledge of the normal range of biomechanics for recreational runners.8,11 For example, low step rate, 18 high braking force, 28 and overstriding 10 are usually considered detrimental, but how much is too much? Identifying atypical lower limb biomechanics may help prevent both the occurrence of a new and the recurrence of a previous injury (ie, primary and secondary prevention, respectively). Depending on the equipment used, researchers and clinicians can assess, among others: (1) spatiotemporal variables—such as contact and flight time, vertical oscillation, step rate, and step length; (2) ground-reaction force (GRF) (ie, kinetic) variables—such as vertical impact peak (VIP), vertical loading rate, and peak braking force; (3) joint angles (ie, kinematics)—such as foot ground angle and knee flexion at initial contact; (4) neuromuscular activity (ie, electromyography); and (5) foot pressure distribution, segment accelerations, etc, compared with some reference values. As both sex 4 and running speed 25 are key determinants of running biomechanics, reference values should be available per sex as well as over a range of physiologically relevant speeds in distance running. To the best of our knowledge, no such reference values for spatiotemporal and kinetic variables for adult recreational runners are currently available.
The main objective of this study was to present a speed- and sex-stratified dataset of reference values for spatiotemporal and kinetic variables in healthy adult recreational runners using a treadmill instrumented with force plates. The secondary aim was to identify determinants independently associated with each biomechanical variable and develop reference regression equations for use in a clinical context.
Methods
Study Design and Participants
The data of this study stem from 874 adult recreational runners who participated in a randomized trial conducted by us in 2017 (ClinicalTrials.gov, NCT03115437) in which we investigated the association between shoe cushioning, body mass, running biomechanics, and injury risk. 20 The present study, the protocol of which received ethics committee approval, only presents baseline data that were gathered in the framework of the parent study. All volunteers received a complete protocol description and provided written informed consent for participation. Recreational runners were recruited between September 2017 and January 2018 from Luxembourg and the neighboring regions (Belgium, France, and Germany) using a convenience sampling approach, which included advertisements in public media (print, television reports, and social media) and social networks in Luxembourg.
It was assumed that those in a reference sample were healthy. “Healthy” was defined as the absence of any current pain or health condition that may affect running biomechanics, any running-impeding injury over the previous month, any medical contraindication to performing a running activity, any prior (<12 months) lower limb or back surgery, and no use of orthopaedic insoles for running. Therefore, the inclusion criteria were set to adults (age, 18-65 years, the youngest participant was 19) in good health who could perform a minimum of 15 minutes of continuous running, regardless of their running experience, fitness level, or body mass. Participants were excluded if <10 clean steps (ie, without a double-support phase preventing an accurate measurement of temporal variables) were available for analysis.
Baseline Evaluation
Volunteers registered for the study made an appointment with the research team via a dedicated website and completed an online questionnaire regarding running and training experience. Eligibility and baseline responses were checked during the subsequent visit to the laboratory.
Participants randomly received 1 of the 2 standardized running shoe versions specifically designed for the parent trial (all shoes manufactured by Decathlon).20,21 The shoe versions only differed in their cushioning properties, defined by their global stiffness at the heel (hard, 94.9 ± 5.9 N/mm; soft, 61.3 ± 2.7 N/mm),19,21 which was derived using a standardized protocol. 1 Cushioning properties were within the range of other running shoes available on the market (53.5-97.1 N/mm; unpublished data). Participants and assessors were blinded regarding the shoe version received.
Height, body mass, fat mass proportion (bioelectrical impedance analysis; Tanita SC-240 MA), and leg length 20 were measured before the running test was performed in the randomly allocated study shoe version on a split-belt treadmill instrumented with force plates (M-Gait; MotekForcelink). The test lasted 13 minutes and comprised a 3-minute warm-up, an 8-minute habituation phase, and a 2-minute data recording. The last 10 minutes were performed at the self-declared preferred running speed (hereafter referred to as “running speed”). GRF data were sampled at 2 kHz and filtered using a cutoff frequency of 30 Hz with a bidirectional second-order Butterworth low-pass filter. The participant's body weight (BW) was obtained by averaging the vertical GRF signal (Fz) of a 5-second recording during a quiet stance.
Signal Processing
A custom program in Matlab (Matlab R2014a; MathWorks) was used to process the GRF data. First, initial contact and toe-off events were identified by the Fz exceeding and falling below a 20-N threshold. The stride time (ms) was defined as the interval between 2 consecutive initial contact events from the same foot, and the contact time (ms) was the interval between initial contact and toe-off. The flight time (ms) was calculated as the difference between the stride and contact times. The duty factor (%) was the ratio between the contact time and the stride time. 23 The step length (m) and the step rate (steps/min) were other spatiotemporal gait parameters analyzed. Vertical oscillation of the body center of mass (mm) was calculated as the difference between minimal and maximum vertical positions of the center of mass during a step, obtained by double integration of the vertical acceleration signal. 13
Peak vertical GRF (BW) was the highest Fz value observed during the stance phase and detected in a window of ±50 ms around midstance. The VIP (BW) was defined as the first peak of the Fz curve in those steps, displaying 2 peaks in the Fz record. If only 1 peak (ie, peak vertical GRF) was present, that step was marked as having no VIP. 19 All curves with corresponding peaks were visually inspected for each participant and manually confirmed. Time to VIP (ms) was defined as the time interval between the initial contact and the VIP. The vertical average loading rate (BW/s) was calculated between 20% and 80% of the time between initial contact and the VIP or the time between initial contact and 13% of the ground contact time for steps without the VIP. 38 Vertical stiffness (BW/m) was calculated as the ratio of the peak vertical GRF and the downward displacement of the center of mass from the foot strike to the lowest position.26,33 Peak braking force was defined as the maximum posterior force observed in the anteroposterior direction. 28 The kinetic variables were normalized to the participant's BW. Discrete variables were calculated for each gait cycle of the 2-minute recording and averaged per participant and from both limbs.
Statistical Analyses
All analyses were performed using STATA/SE Version 15 (StataCorp). Data pertaining to demographic, training, and biomechanical characteristics were presented as counts and percentages for dichotomous variables and as means ± standard deviations or medians and interquartile ranges (IQRs) for normally or nonnormally distributed continuous variables, respectively. Normality was assessed using histograms. More detailed descriptive statistics of the spatiotemporal and kinetic variables were then tabulated by sex and running speed category (≤7, 8, 9, 10, 11, 12, 13, 14, and ≥15 km/h). A 2 × 9 (sex × speed group) analysis of variance (ANOVA) was used to test the hypothesis that these 2 independent variables should be used to stratify biomechanical measurements.
The potential explanatory variables for each spatiotemporal and kinetic variable were also investigated. The predictors examined included sex, age, height, body mass, body mass index (BMI), fat mass proportion, running experience (years of running practice during adulthood), running regularity (months of regular running practice over the previous year), mean number of running sessions per week over the previous year, mean session distance over the previous year, running speed, and shoe version (hard or soft). To avoid multicollinearity, only 1 variable from moderately or highly intercorrelated variables was included in the analyses. To explore the relationship between each potential determinant and the biomechanical variables, Pearson correlation and point-biserial correlation coefficients were used for continuous and dichotomous (ie, sex and shoe version) variables, respectively. Finally, 12 forward-selection multiple linear regression analyses (1 for each biomechanical variable) were used to generate explanatory equations. The model fit was inspected using the overall F test for the regression model, individual t tests for each regression coefficient, and adjusted R2. We checked for multicollinearity in the final model using the variance inflation factor, with a threshold 32 set to 10. Thus, each model provided a reduced set of factors that best predicted and could be considered independently associated with the biomechanical variables investigated. Variables were retained in the regression model if P < .05. The recommendation for using at least 10 participants per predictor included in the regression analysis was strictly followed. 31
Results
Participants
In total, 1107 volunteers preregistered for the study on the dedicated electronic platform, and 874 fulfilled the inclusion criteria and performed the running test in the laboratory. Fourteen participants were excluded from the analyses because of a health condition reported by the participant after completing the test (n = 2) or the presence of a double-support phase during running (n = 12). The descriptive statistics of the 860 participants included in the analyses are presented in Table 1. The mean age of participants was 40.2 ± 10 years, 38.5% were women, and 72% lived in Luxembourg, 14% in France, 10% in Belgium, and 4% in Germany.
Descriptive Statistics of the Participants a

Data are presented as mean ± SD, n (%), or median [IQR]. BMI, body mass index; BW, body weight; GRF, ground-reaction force; IQR, interquartile range; VALR, vertical average loading rate; VIP, vertical impact peak.
32 missing values (ie, no VIP could be detected).
Reference Values
The results of the ANOVAs confirmed that each biomechanical variable differed significantly (P < .05) by sex and speed (except for vertical oscillation; P = .074). Tables 2 and 3 present the descriptive statistics for each spatiotemporal and kinetic variable, stratified by sex and speed groups. Furthermore, Supplemental Table S1 presents the descriptive statistics for VIP, time to VIP, and peak breaking force by sex, speed, and shoe version. To assist in the visualization of the biomechanical data, box plots by sex and speed categories are also presented (Figures 1 and 2).
Percentiles of the Spatiotemporal Variables by Sex and Running Speed Category a

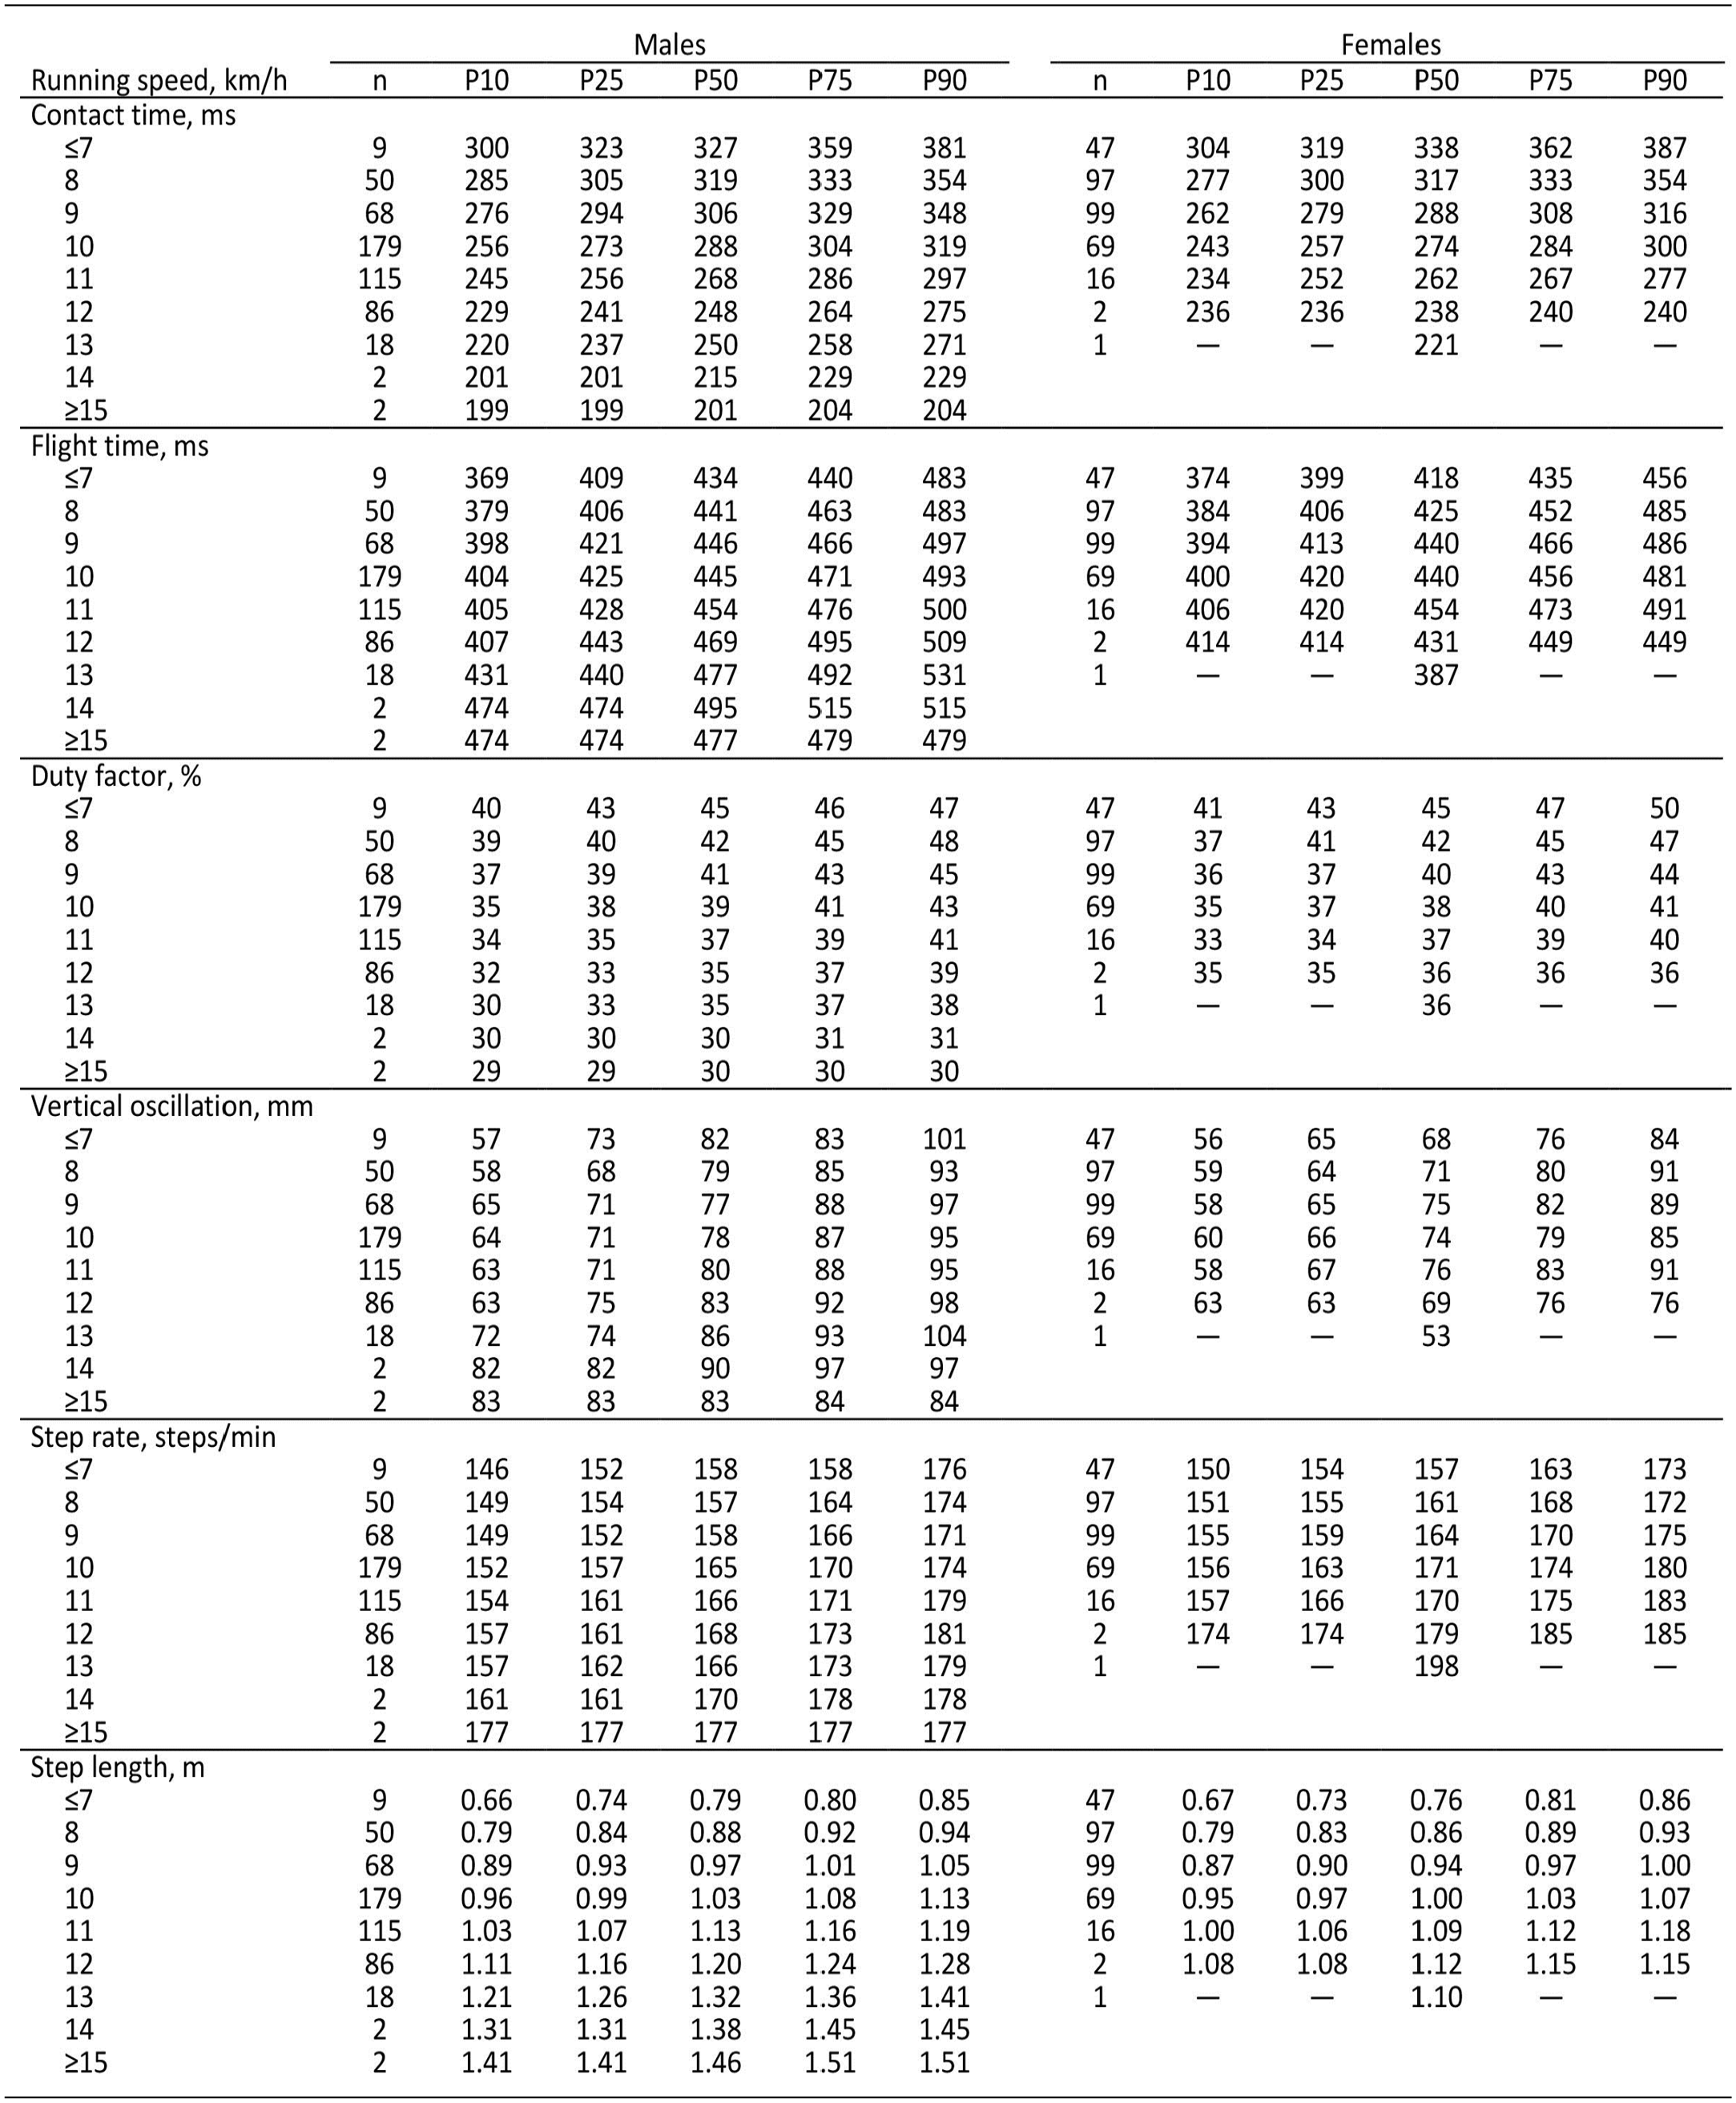
P, percentile; –, no data (not applicable).
Percentiles of the Ground-Reaction Force Variables by Sex and Running Speed Category a


BW, body weight; GRF, ground-reaction force; P, percentile; VALR, vertical average loading rate; VIP, vertical impact peak; –, no data (not applicable).

Box plots of the spatiotemporal variables for male and female study participants. The lower and upper box boundaries indicate the 25th and 75th percentiles, respectively. The middle line inside the box represents the median, and the filled diamond is the mean. Whiskers below and above the boxes represent the 25th percentile − 1.5 × IQR and 75th percentile + 1.5 × IQR, respectively. IQR, interquartile range.

Box plots of the ground-reaction force characteristics for male and female study participants. The lower and upper box boundaries indicate the 25th and 75th percentiles, respectively. The middle line inside the box represents the median, and the filled diamond is the mean. Whiskers below and above the boxes represent the 25th percentile − 1.5 × IQR and 75th percentile + 1.5 × IQR, respectively. IQR, interquartile range.
Determinants of the Spatiotemporal and GRF Variables
Before generating the regression models, correlation coefficients were used to check the assumption of multicollinearity. As BMI was highly correlated with body mass (r = 0.81) and fat mass proportion was moderately correlated with sex (r = 0.66) and running speed (r = −0.60), these 2 predictors were not included in the analyses (see Supplemental Table S2, available separately). The correlation between the potential determinants and the 12 spatiotemporal and GRF variables investigated are presented in Supplemental Table S3 (available separately). While all potential predictors significantly correlated with most biomechanical variables, running speed generally showed the highest correlations (r > 0.7 with contact time, step length, and peak braking force). Table 4 presents the final multiple linear regression models for each biomechanical variable. Among the 10 potential determinants investigated, between 3 and 6 were associated with each biomechanical variable. The adjusted models showed that women had longer contact time, shorter flight time, greater duty factor, lower vertical oscillation, and lower VIP and peak vertical GRF than men. Higher running speed was associated with shorter contact time, longer flight time, lower duty factor, higher step rate, greater step length, greater VIP, faster time to VIP, and greater vertical average loading rate, vertical stiffness, peak vertical GRF, and peak braking force (Table 4). The adjusted R2 ranged from 0.19 to 0.88.
Predictive Models for the Spatiotemporal and GRF Variables a
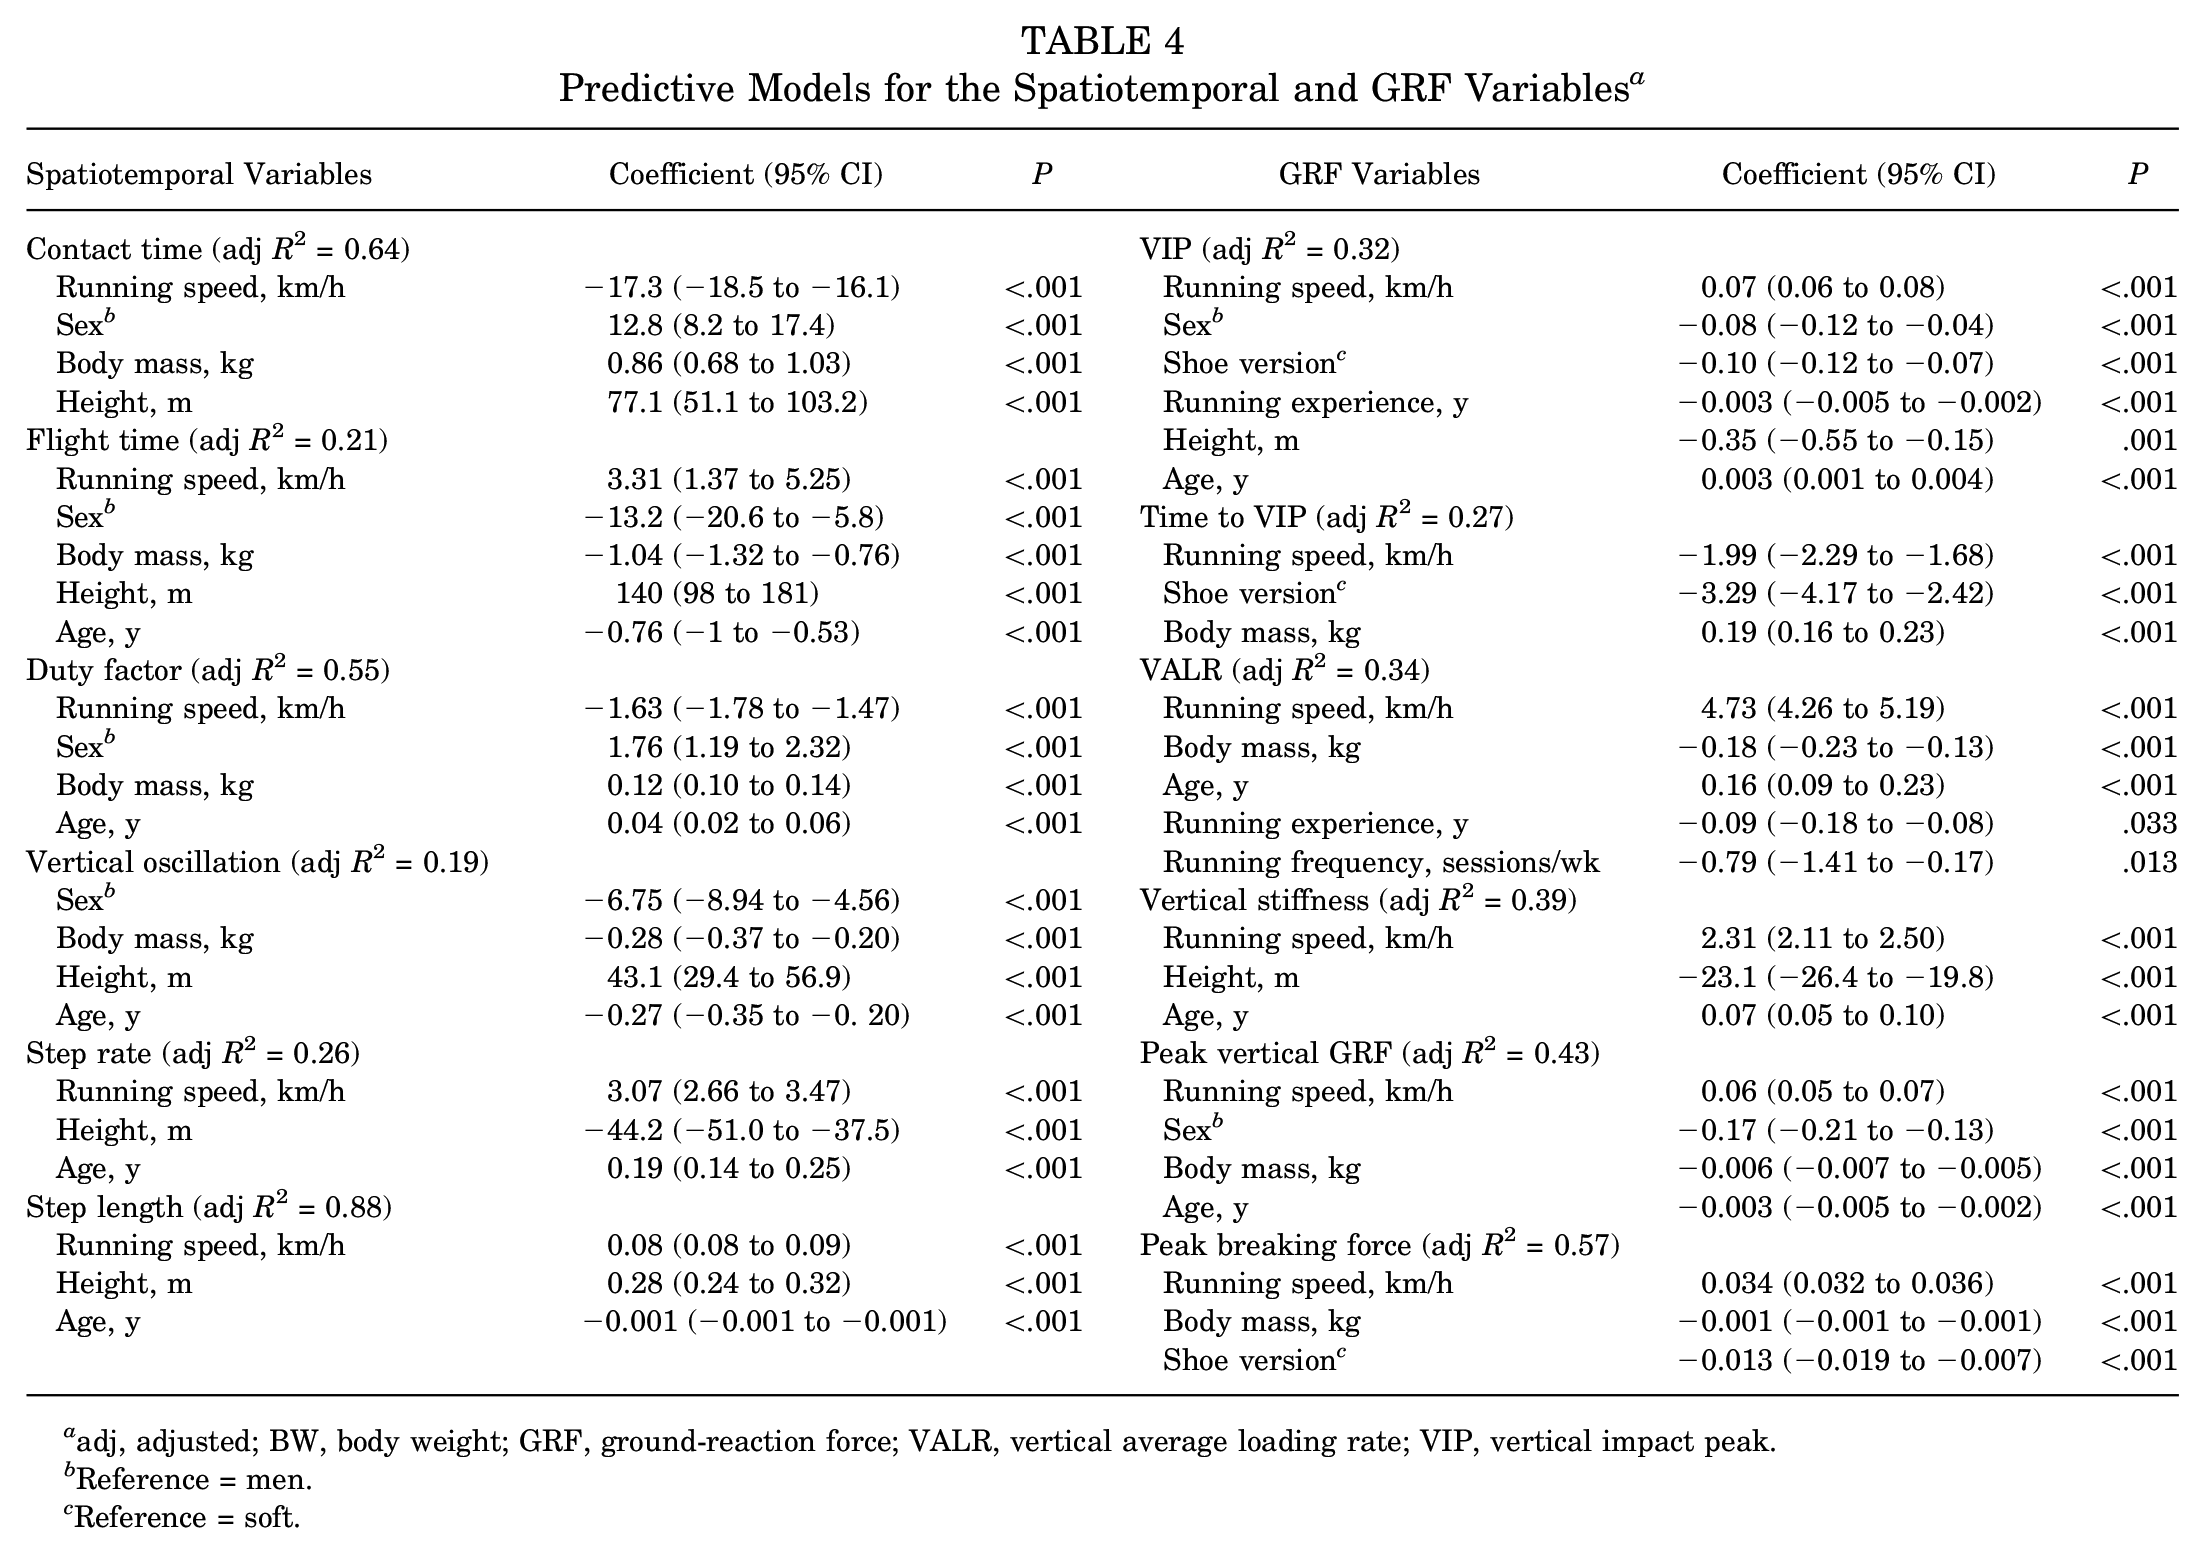
adj, adjusted; BW, body weight; GRF, ground-reaction force; VALR, vertical average loading rate; VIP, vertical impact peak.
Reference = men.
Reference = soft.
Reference regression equations that were used for the calculation of the predicted values are provided in Table 5. Supplemental Material 1 includes a spreadsheet calculator using different regression models to predict the biomechanical variables based on the runner's characteristics.
Reference Regression Equations Calculated for the Biomechanical Variables Studied a
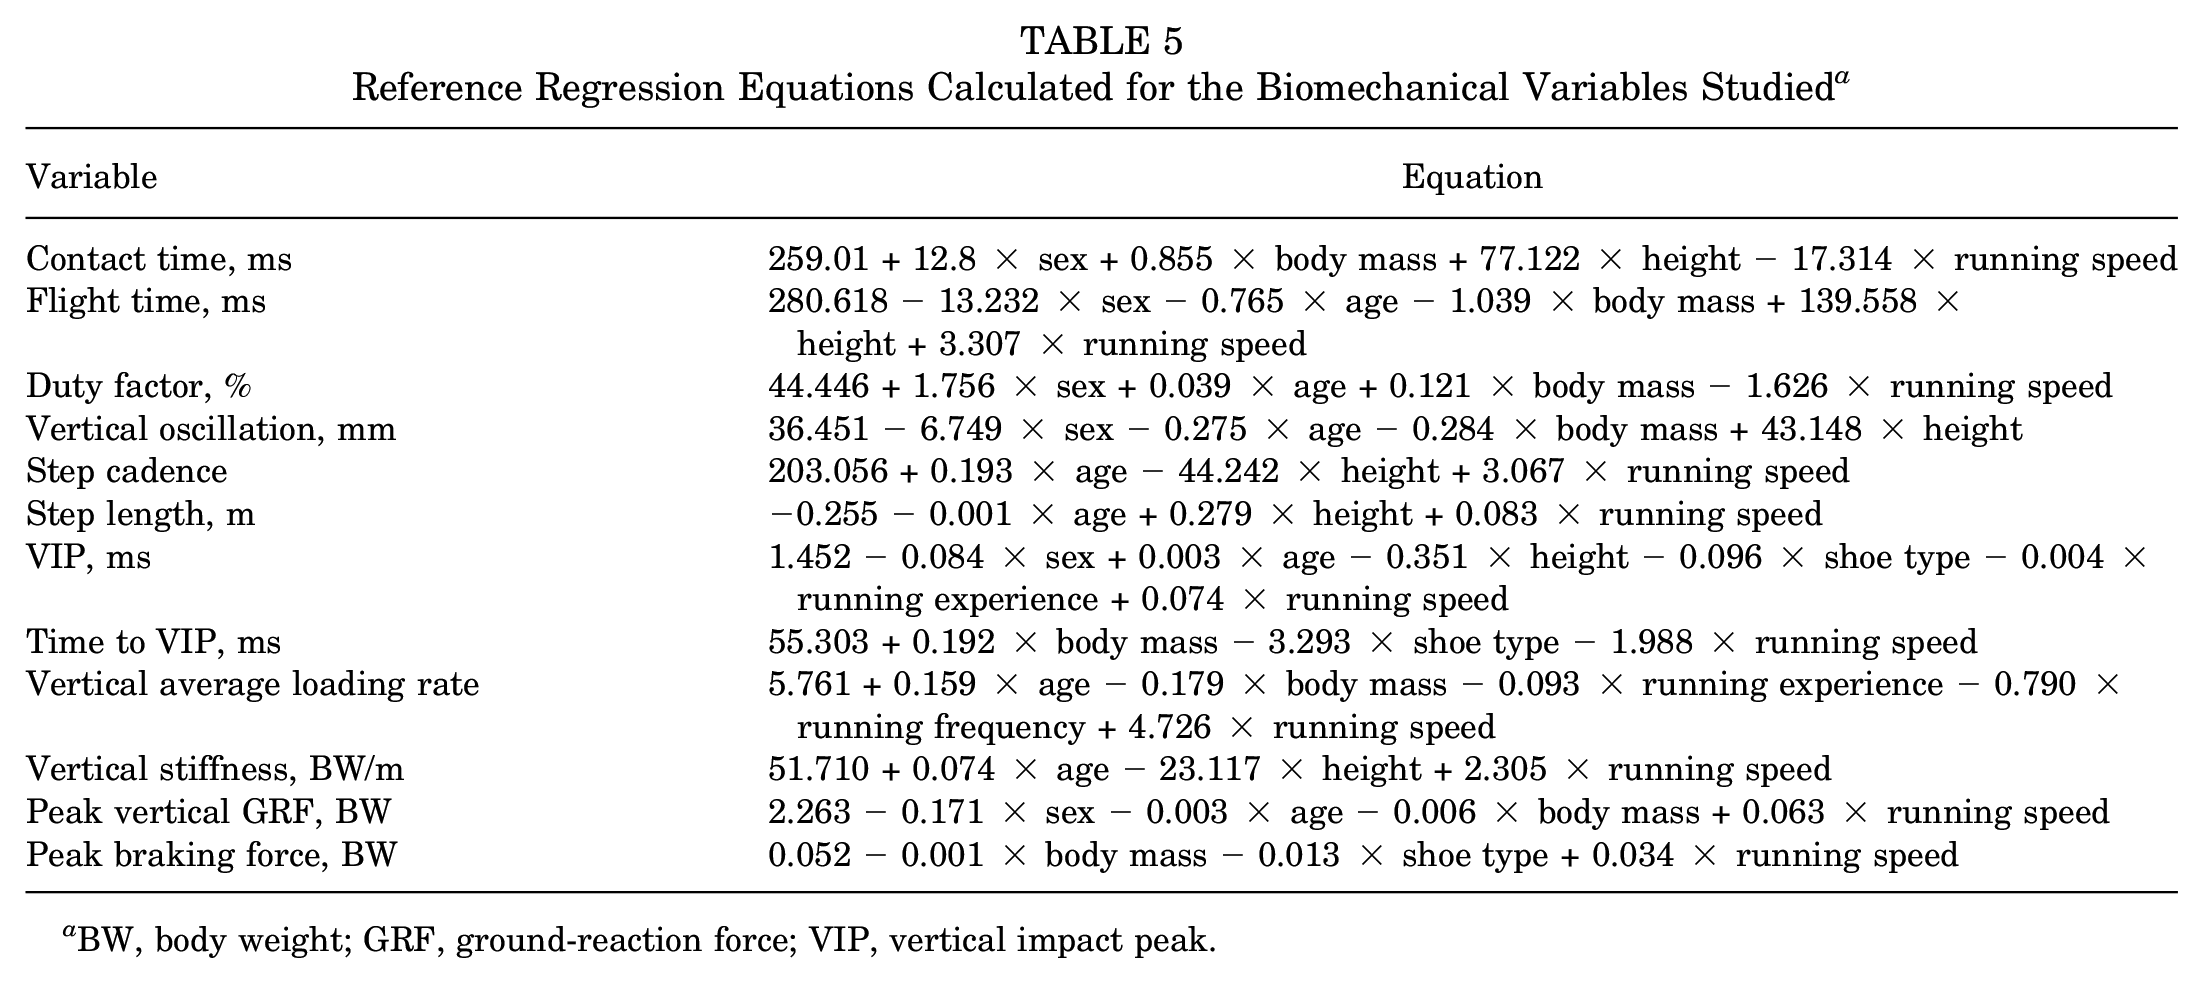
BW, body weight; GRF, ground-reaction force; VIP, vertical impact peak.
Discussion
This study presents speed- and sex-stratified reference values for spatiotemporal and kinetic variables in healthy adult recreational runners based on recordings from a treadmill instrumented with force plates. The reference dataset provided here may benefit medical doctors, physical therapists, coaches, and researchers, enabling them to compare biomechanical values in those with or without injury to the reference values determined in 860 recreational runners. We also provided percentiles for each biomechanical variable to assist clinicians and researchers in interpreting measurements obtained from tested recreational runners. The reference values can be used as targets for clinicians working with runners in cases where there is clinical suspicion of a causal relationship between atypical biomechanics and a running-related injury. Clinicians must bear in mind that the scientific evidence for the role of biomechanics in running-related injury is inconsistent and depends on the study population and the injury investigated. 6 Therefore, clinicians should carefully consider whether changing the runner's technique (toward the reference values for a given variable) might help recovery from the injury and prevent any recurrence. Notably, the reference values should not be interpreted as an optimal zone where the risk of injury is lowest in recreational runners. To the authors’ knowledge, this is the first reference dataset of spatiotemporal and kinetic variables in a large cohort of healthy adult recreational runners tested at their preferred (usual) running speed.
Reference Regression Equations
Reference values stratified according to significant explanatory variables (ie, sex and preferred running speed in this study) are useful. Still, these reference values would remain less specific than values predicted from regression equations, which can adjust for additional determinants. Based on the multivariable linear regression analyses, the reference equations presented here included 3 to 6 determinants for each spatiotemporal and kinetic variable (see Table 4 and Supplemental Material 2). Notably, shoe type was included in the reference equation for only 3 of the biomechanical variables (VIP, time to VIP, and peak breaking force), consistent with previous findings.19,22 As the participants were tested in 1 of the 2 study shoe versions (ie, greater or lower cushioning properties), 22 clinicians should consider the cushioning properties of the shoe that the patient is being tested in when performing gait analysis and record it as hard (eg, racing flat or minimalist shoe) or soft (eg, maximalist or highly cushioned shoe). Additional explanations on the use of the regression equations are provided in the spreadsheet (Supplemental Material 2).
Determinants of Running Biomechanics
Each of the 10 potential determinants was statistically correlated with several biomechanical variables (see Supplemental Table S3). However, only running speed showed high or very high correlations with these biomechanical variables, emphasizing that running speed is the primary factor to consider when assessing running biomechanics. As expected, all kinetic variables were statistically correlated with running speed. However, the only high correlation with running speed among all kinetic variables was peak braking force, consistent with previous findings. 27 One may argue that increasing running speed mainly results in increasing horizontal speed, which could explain why vertical components showed lower correlations with (horizontal) running speed than (horizontal) peak braking force. Running speed was also highly correlated with step length and contact time. The association with step length is also in agreement with a previous study. 27 Interestingly, step length was highly correlated with running speed, but step rate was not. This suggests that differences in running speed among recreational runners are primarily a result of a longer step length rather than an increased step rate. Vertical oscillation also seems stable across running speeds, as the correlation was negligible and running speed was not retained in the regression model. This observation contrasts with that in previous studies that have reported reduced vertical oscillation at greater speeds. 14 In the parent study, a subgroup of our study participants was tested at 2 fixed running speeds (10 and 12 km/h) and showed lower vertical oscillation at higher speeds. 2 The decrease in vertical oscillation is an intraindividual adaptation to running speed. One may argue that our study participants were tested at the same relative running speed, that is, their preferred running speed. This may explain the absence of interindividual variation in vertical oscillation among absolute running speeds. Sex was statistically correlated with most of the biomechanical variables (P < .05). Still, the strength of these correlations was generally low or negligible (ie, absolute r values were below 0.5, except for step length). Accordingly, sex was included in the regression models for only 6 of the 12 biomechanical variables. This means that sex difference is no longer significant after adjusting for other determinants in several multivariable models. This suggests that sex differences in running biomechanics observed in a previous study 4 are explained—at least for half of the variables investigated here—by some of the other determinants included in the present study, including age, height, body mass, running experience, running regularity, mean number of running sessions per week in the previous year, mean session distance in the previous year, running speed, and shoe version.
Among the 10 potential determinants investigated, running regularity in the previous year and mean session distance were not included in any multivariable regression models. On the other hand, running speed, age, body mass, sex, and height were included in the regression equations for many biomechanical variables. The ability of the determinants to explain the variation in the biomechanical variables largely differs among the models. The adjusted R2 was higher for step length, contact time, and peak braking force but low for vertical oscillation, flight time, and step cadence, suggesting that other determinants should be identified and considered to better predict individual values for these variables.
Reference Testing Conditions
Running is a highly complex task that can be executed in multiple ways and is influenced by many environmental (ground characteristics, slope, running shoes, etc) and personal (sex, age, fitness, prior training, etc) factors. Consequently, the question arises as to what condition can be considered “normal,” whether this is the case when testing runners under highly standardized laboratory conditions as in our study, and whether it is possible to have a reference population for every runner's profile. In this study, we aimed to provide reference values for spatiotemporal and kinetic variables in healthy adult recreational runners gathered in standard laboratory or clinical assessment conditions. While the reference values reported here are an important contribution to the clinical literature on running gait analysis and retraining, the limitations of such an approach to preventing and treating running injuries are noteworthy. Akin to the use of medical imaging in clinical decision-making, treatment options should not be based on abnormal biomechanical findings alone. Instead, retraining atypical biomechanics that are clinically correlated with the presenting complaint and patient history may be a potential option to target in conjunction with other forms of treatment (eg, strengthening, training load modification, etc). Furthermore, the mean values or those computed with the spreadsheet tool should not be seen as the ideal that all patients should aspire to. There is significant variability in “normal” values across patients, depending on factors such as anatomy, previous training history, and previous injury.
Strengths and Limitations
The main strengths of this study are the large sample size, the heterogeneity of the study population regarding running experience, training load, and age and sex balance, which support the generalizability of the study results. Furthermore, conditions for data collection were highly standardized. This study also has limitations, which call for caution when interpreting the current results. First, the reference values were obtained in recreational runners, and only few participants were tested at speeds ≥13 km/h for men (n = 22) and ≥11 km/h for women (n = 1). Furthermore, the IQR for age was 32 to 48 years. As both running speed and age influence running biomechanics, the reference values are not suited for highly competitive runners, sprinting, or people with an age far from our mean. Nevertheless, our regression equations are suggested as an approach to respond to that issue. Second, the data were collected on a motorized treadmill, influencing running biomechanics compared with overground running. 36 Third, running technique may depend on other factors not investigated here (eg, muscle mass, foot type, etc). Fourth, the participants were tested in 2 standardized, randomly allocated study shoes, with hard and soft cushioning, representing conditions that may differ from their usual footwear. However, the standardized study shoes used here had cushioning properties well within the range of what can be found on the market. Furthermore, many recreational runners may use different pairs of running shoes concomitantly, rotating between different shoe types during their training. 24 In short, a “normal” shoe condition is virtually impossible to define, suggesting that the reference values reported in this study may apply to a broad range of runners. Nevertheless, since the cushioning properties of the shoes used in the study have been previously shown to influence some of the variables of interest, results as per shoe type have been provided for those variables in Supplementary Table S1. Last, although the present study focuses primarily on spatiotemporal and kinetic variables, running kinematics may also be involved in the mechanisms that lead to the development of some injury types.
Conclusion
This is the first study to provide reference values for spatiotemporal and kinetic variables based on a large sample of healthy adult recreational runners stratified according to preferred running speed and sex. Furthermore, we present reference equations and a spreadsheet tool to predict spatiotemporal and kinetic variables based on the runner's characteristics. This information may serve as a guide for clinicians and researchers when interpreting the results obtained from their patients or study participants and can assist in developing gait retraining targets in dedicated treatment programs.
Supplemental Material
sj-pdf-1-ojs-10.1177_23259671231204629 – Supplemental material for Reference Values and Determinants of Spatiotemporal and Kinetic Variables in Recreational Runners
Supplemental material, sj-pdf-1-ojs-10.1177_23259671231204629 for Reference Values and Determinants of Spatiotemporal and Kinetic Variables in Recreational Runners by Laurent Malisoux, Christopher Napier, Paul Gette, Nicolas Delattre and Daniel Theisen in Orthopaedic Journal of Sports Medicine
Supplemental Material
sj-xlsx-2-ojs-10.1177_23259671231204629 – Supplemental material for Reference Values and Determinants of Spatiotemporal and Kinetic Variables in Recreational Runners
Supplemental material, sj-xlsx-2-ojs-10.1177_23259671231204629 for Reference Values and Determinants of Spatiotemporal and Kinetic Variables in Recreational Runners by Laurent Malisoux, Christopher Napier, Paul Gette, Nicolas Delattre and Daniel Theisen in Orthopaedic Journal of Sports Medicine
Footnotes
Acknowledgements
The authors thank Hélène Agostinis, Eric Besenius, Tom Krier, and Christopher P. Meyer (PhD) for their precious assistance with the recruitment of the study participants and data collection.
Final revision submitted May 2, 2023; accepted May 19, 2023.
One or more of the authors has declared the following potential conflict of interest or source of funding: This study was cofunded by Decathlon and the Ministry of Higher Education and Research, Luxembourg. The shoes were provided by Decathlon. A research partnership agreement was signed between Decathlon and the Luxembourg Institute of Health. N.D. was employed at Decathlon during data collection, data analysis, and manuscript preparation of the present study. AOSSM checks author disclosures against the Open Payments Database (OPD). AOSSM has not conducted an independent investigation on the OPD and disclaims any liability or responsibility relating thereto.
Ethical approval for this study was obtained from the National Ethics Committee for Research of Luxembourg (ref No. 201701/02 v1.1).
References
Supplementary Material
Please find the following supplemental material available below.
For Open Access articles published under a Creative Commons License, all supplemental material carries the same license as the article it is associated with.
For non-Open Access articles published, all supplemental material carries a non-exclusive license, and permission requests for re-use of supplemental material or any part of supplemental material shall be sent directly to the copyright owner as specified in the copyright notice associated with the article.