
Abstract
Background:
There is growing interest in nonoperative treatment for the management of Achilles tendon ruptures (ATRs). However, nonoperative treatment is limited by the risk of tendon reruptures and low satisfaction rates. Recently, atelocollagen injections have been reported to have beneficial effects on tendon healing.
Purpose:
To evaluate the beneficial effects of injected atelocollagen on Achilles tendon healing and investigate the mechanism of atelocollagen on tendon healing.
Study Design:
Controlled laboratory study.
Methods:
Percutaneous tenotomy of the right Achilles tendon in 66 rats was performed. The animals were equally divided into the noninjection group (NG) and the collagen injection group (CG). At 1, 3, and 6 weeks, the Achilles functional index, cross-sectional area, load to failure, stiffness, stress, and the modified Bonar score were assessed. Transmission electron microscopy, western blotting, and immunohistochemistry were also performed.
Results:
The Achilles functional index (–6.8 vs −43.0, respectively; P = .040), load to failure (42.1 vs 27.0 N, respectively; P = .049), and stiffness (18.8 vs 10.3 N/mm, respectively; P = .049) were higher in the CG than those in the NG at 3 weeks. There were no significant differences in histological scores between the 2 groups. Transmission electron microscopy analysis showed that the mean diameter of collagen fibrils in the CG was greater than that in the NG at 3 weeks (117.2 vs 72.6 nm, respectively; P < .001) and 6 weeks (202.1 vs 144.0 nm, respectively; P < .001). Western blot analysis showed that the expression of collagen type I in the CG was higher than that in the NG at 1 week (P = .005) and 6 weeks (P = .001).
Conclusion:
An atelocollagen injection had beneficial effects on the healing of nonoperatively treated Achilles tendon injuries. The Achilles tendon of CG rats exhibited better functional, biomechanical, and morphological outcomes compared with NG rats. The molecular data indicated that the mechanism of atelocollagen injections may be associated with an increased amount of collagen type I.
Clinical Relevance:
An atelocollagen injection might be a good adjuvant option for the nonoperative treatment of ATRs.
An Achilles tendon rupture (ATR) has become increasingly common over the past 2 decades, with a reported annual incidence of 18 per 100,000 persons.35,58 The optimal treatment method remains controversial, and both operative and nonoperative approaches have distinct advantages and disadvantages. 58 Operative treatment is generally preferred, especially in young, healthy, and active patients.23,24 Open repair allows for the direct confirmation of ATRs and accurate suturing with tension, thereby reducing the frequency of recurrent ruptures.32,41 However, large incisions lead to potential infections, adhesion, and wound-related complications, representing important limitations.25,63 The surgical complication rate ranges from 11% to 34.1% primarily because of wound problems.24,26 Hence, minimally invasive surgery including percutaneous repair and mini-open repair has been reported. 58 However, there are still concerns about the high risk of sural nerve injuries (16%) and reruptures (6.4%). 12
Because of these limitations, there is growing interest in the nonoperative treatment of ATRs. Nonoperative treatment consists of an initial period of nonweightbearing and immobilization in a cast or boot with an elevated heel wedge, followed by continued immobilization in a cast or functional brace. 58 There are distinct advantages of nonoperative treatment because it does not lead to wound complications related to surgery.6,58 However, disadvantages such as a higher rerupture rate, greater likelihood of patient dissatisfaction, and lower rate of resuming sports still remain.9,41,58 A previous study reported that nonoperative treatment with strict immobilization is associated with an 11% rerupture rate at 26 months’ follow-up. 58 Because of their hypocellularity and hypovascularity, the natural healing ability of tendons is low. 4 Hence, adjuvant treatment that accelerates Achilles tendon healing is necessary.
Collagen has been a favored material for the treatment of tendon injuries because it is a major extracellular matrix (ECM) component in tendons.20,51 Atelocollagen is a form of collagen treated with proteolytic enzymes to remove terminal telopeptides and has low immunogenicity and antigenicity.28,37 Recently, atelocollagen treatment has been reported to have beneficial effects on tendon healing.27,28,54 Histological and biomechanical studies using rabbit rotator cuff tendons 54 have revealed that atelocollagen patches enhanced tendon regeneration. A study by Müller et al 42 also reported the tendon healing effects of collagen sponges in a rat model of ATRs using open tenotomy. The authors presumed that collagen type I (COL1) sponges seemed to increase the amount of local COL1, and they suggested that the careful use of such biomaterials might be an option for tendon augmentation during Achilles tendon surgery. 42 If the collagen scaffold is solid or membranous, a surgical incision in the Achilles tendon to insert materials into the defect is required. 42 However, if gel-type collagen is used as a scaffold, it can be injected directly into the lesion, increasing cellular activity around the injected collagen site during nonoperative treatment.27,28,40
In a 2022 study by our author group, 53 we found in a rat model that Achilles tendon healing was significantly better after microscopic percutaneous tenotomy versus open tenotomy, suggesting that microscopic percutaneous tenotomy might be useful for the nonoperative treatment of ATRs. In the current study, we evaluated in a rat model whether an atelocollagen injection enhances the spontaneous healing of the Achilles tendon after an ATR. We hypothesized that an atelocollagen injection would promote the production of COL1 and enhance Achilles tendon healing.
Methods
Atelocollagen
We used injection-type products (3%, 1 mL) of highly purified type I atelocollagen (COLTRIX; Ubiosis) derived from the dermal skin of pigs. 27 Collagen was treated with pepsin to remove terminal telopeptides.
Animals and Experimental Protocols
All experimental protocols were approved by an Institutional Animal Care and Use Committee and followed the Guide for the Care and Use of Laboratory Animals. 45 Included were 66 adult male Sprague Dawley rats (10 weeks old, weighing 300-350 g) purchased from Samtako. Animals were randomly assigned to 1 of 2 groups: the noninjection group (NG; n = 33) and the collagen injection group (CG; n = 33). The study flowchart and experimental schedule are depicted in Figure 1. At 1, 3, and 6 weeks after tenotomy of the right Achilles tendon, 3 animals per group were subjected to a functional evaluation before euthanasia with an intraperitoneal injection of urethane (2 mL/kg). In each group, 4 and 3 animals were used for biomechanical and histological assessments, respectively. At 3 and 6 weeks, transmission electron microscopy (TEM) was performed on 3 animals. Western blotting and immunohistochemistry (IHC) were performed using 3 animals in each group at 1 and 6 weeks. The uninjured left Achilles tendon was harvested from 7 randomly chosen animals and used as the native tendon (control) for the biomechanical assessment (n = 4) and TEM analysis (n = 3). 42

(A) The flowchart of the experiment groups and (B-F) surgical procedures involved in this study. (B) Percutaneous tenotomy was performed under light microscopy. (C, D) After a 2-mm lateral stab incision at 5 mm proximal to the calcaneal insertion, exposure of the Achilles and plantaris tendons was confirmed. (E) Complete transection of the Achilles and plantaris tendons was performed with a scalpel blade. (F) Finally, atelocollagen was injected into the tendon gap in collagen injection group (CG) rats. The white arrow indicates the Achilles tendon and the plantaris tendon. The black arrow indicates injected atelocollagen. IHC, immunohistochemistry; NG, noninjection group; TEM, transmission electron microscopy; WB, western blotting.
Operative Procedure
Before surgery, all rats were anesthetized with 3% isoflurane in a mixture of N2O and O2 (70:30). The right leg of each rat was shaved, and the skin was sterilized using an alcohol solution. In both groups, percutaneous tenotomy was performed under light microscopy (SZ2-STB1; Olympus), as previously described. 53 Under 8× magnification, a 2-mm stab incision was made on the lateral side of the Achilles tendon using a No. 11 scalpel blade, and the fascia was cut to expose the Achilles and plantaris tendons. 59 The tendons were completely transected perpendicularly to the collagen fibers at 5 mm proximal to the calcaneal insertion. After tenotomy, 0.03 mL of atelocollagen was injected into the tendon gap in CG rats (Figure 1). No injection was administered to NG rats. The skin was closed with nylon 4-0 (Ethicon) simple sutures. Cast immobilization was not applied to the operated legs. All animals were permitted to move within their cages and had food and water access ad libitum throughout the experiment.
Functional Analysis
Functional analysis was performed using the Achilles functional index (AFI), as described in previous studies.19,31,43,53,61 The AFI was quantitatively assessed using Murrell et al’s 43 AFI method, as modified by Kurtz et al. 31 A custom-designed glass corridor (~50 cm long and ~10 cm wide) was used (Figure 2A).43,53 The hind paws of the rats were placed on a red stamp pad. The animals were then allowed to walk along a confined walkway with a white paper floor, such that they made paw prints on the paper. The tracks were measured and quantified, as described by Murrell et al,31,43 and the AFI was calculated. Measurements of print length, total spreading (distance between the first and fifth toes), and intermediary spreading (distance between the second and fourth toes) were taken. The AFI was determined using the formula by Murrell et al 43 as follows: AFI = 74(PLF) + 161(TSF) + 48(ITF) – 5, where PLF is the print length factor, TSF is the total spreading factor, and intermediary toe spreading factor (ITF) is the intermediary spreading factor.

Functional analysis. (A) A custom-designed glass corridor (~50 cm long and ~10 cm wide) was used. (B) The right hind paw of a healthy rat is shown on the left. Achilles functional index (AFI) measurements included print length (double arrow), total spreading (dotted line; distance between the first and fifth toes), and intermediary spreading (linear line; distance between the second and fourth toes). The recorded right hind paws of the noninjection group (NG) and collagen injection group (CG) at 1, 3, and 6 weeks are shown. (C) The AFI was measured until 6 weeks to assess functional recovery. Values represent the means (y-axis) for each group's samples (x-axis), with error bars representing standard deviations. Statistically significant differences between the NG and CG tendons (*), between the NG and native tendons (§), and between the CG and native tendons (#) (P < .05).
Biomechanical Analysis
The biomechanical properties were determined using published methodology for the biomechanical assessment of ATRs in rats.7,17,33,47,53,65 Each tendon was harvested with the attached calcaneal bone and musculotendinous portion. 1 Assuming an elliptical cross-section of the tendon, the tendon cross-sectional area (CSA; mm2) at the midportion of the tendon callus was calculated based on 2 perpendicular axes of thickness (major axis = a and minor axis = b) as follows: CSA = (π×a×b)/4.34,46 Each thickness was measured using a digital vernier caliper (SD500-150PRO; Sincon). The tendon with the attached calcaneal bone was wrapped in gauze soaked with saline for mechanical testing within the next few hours.1,53
The Achilles tendon was placed securely in serrated metal grips and mounted onto a mechanical testing machine (500-N EZ-SX Texture Analyzer; Shimadzu).47,53 The calcaneus was fixed with a clamp at the distal end of the specimen, and the proximal end of the specimen was clamped at the musculotendinous junction. Subsequently, the tendon was pulled in a direction perpendicular to the floor at a constant speed of 0.1 mm/s until failure. Load to failure (N), stiffness (N/mm), and stress (N/mm2) were recorded.33,42,50,53 Stiffness was plotted by measuring the linear slope of the load-displacement curve before achieving the maximum load to failure.21,53 Stress was calculated as load to failure divided by the CSA. 50 Parameter data for testing were collected from Trapezium software (Version 2.05; Shimadzu).
Histological Analysis
For the histological examination, specimens were collected from sacrificed rats as follows.33,53 A 5 × 15–mm tissue block consisting of the regenerated tendon and peritendinous tissue at 5 mm proximal to the calcaneal insertion was obtained and fixed for 24 hours in 4% paraformaldehyde diluted in phosphate-buffered saline (pH 7.4). Then, fixed tissue was dehydrated with increasing concentrations of alcohol, cleared in xylene, and embedded in paraffin wax. The paraffin blocks were cut into 5 μm–thick longitudinal sections using a tissue microtome (RM2255; Leica). A total of 3 randomly selected tissue sections from each group were deparaffinized with xylene and rehydrated with decreasing concentrations of alcohol. The sections were stained with hematoxylin and eosin, Masson trichrome, and Alcian blue. The tissue sections were examined using a digital camera connected to a light microscope (DM4; Leica).
Specimens were evaluated according to histological criteria using the Bonar score,11,38,42,47 following the standardized recommendations of Fearon et al.14,16,34 After initial analysis of the entire tendon at 100× magnification, the region with the greatest alteration in cell morphology was identified, and the following 5 main characteristics were evaluated: cell morphology, cellularity, vascularization, collagen fiber arrangement, and accumulation of ground substance. Each characteristic was graded on a scale ranging from 0 (healthy tendon tissue) to 3 (advanced changes). The total Bonar score for each specimen was calculated from the sum of these 5 characteristic grades plus 2.5 points for each finding concerning intratendinous calcification and adipocytes. Hence, a tendon exhibiting the most severe abnormality would have a score of 20, and a tendon with no observable abnormality would have a score of 0. 16
TEM Analysis
Tissue samples (1 × 1 mm) from regenerated Achilles tendons at 5 mm proximal to the calcaneal insertion were harvested and fixed with 1% glutaraldehyde at 4°C and then washed with 0.1 M phosphate buffer solution (pH 7.4) at 4°C.29,33 The washed samples were post-fixed with 1% osmium tetroxide (Electron Microscopy Sciences) in 0.1 M phosphate buffer solution for 2 hours at 4°C, dehydrated using ethanol solutions (50%, 70%, 75%, 90%, 95%, and 100%), and placed in propylene oxide. The dehydrated samples were embedded progressively in 2:1, 1:1, and 1:2 mixtures of propylene oxide and EMbed 812 resin (Electron Microscopy Sciences) and polymerized at 70°C for 24 hours. Tissue samples were sectioned at 80-nm thickness using an ultramicrotome (Leica) with diamond knives and mounted on 200 mesh copper grids. Finally, the sectioned samples were post-stained with 2% uranyl acetate and 1% lead citrate and observed using a Tecnai G2 Spirit Twin microscope (FEI) at 120 kV.
Collagen fibers in each sample (n = 3) were imaged and measured to obtain an accurate representation of the fibril diameter distribution and mean diameter.49,56 Approximately 100 collagen fibrils were measured for each sample using ImageJ software (Version 1.53; National Institutes of Health).
Western Blot Analysis
A 3 × 15–mm tissue block consisting of the regenerated tendon at 5 mm proximal to the calcaneal insertion was obtained. We examined the quantitative expression of COL1, collagen type III (COL3), tumor necrosis factor–alpha (TNF-α), interleukin-1 beta (IL-1β), vascular endothelial growth factor (VEGF), transforming growth factor–beta 1 (TGF-β1), and transforming growth factor–beta 3 (TGF-β3). From each specimen, proteins were extracted by homogenization using a PRO-PREP protein extraction solution (iNtRON Biotechnology). Homogenates were centrifuged at 15,000 rpm at 4°C for 20 minutes. The protein concentration in the homogenates was measured using a bicinchoninic acid protein assay reagent (Thermo Fisher Scientific). Proteins were separated using sodium dodecyl sulfate–polyacrylamide gel electrophoresis and transferred onto polyvinylidene fluoride membranes. The membranes were blocked with 5% skim milk in tris-buffered saline containing Tween 20 (TBST) for 30 minutes. The membranes were then incubated with the following primary antibodies at 4°C overnight: anti-COL1 antibody (1:2000; Invitrogen), anti-COL3 antibody (1:2000; Invitrogen), anti–TNF-α antibody (1:2000; Invitrogen), anti–IL-1β (1:2000; Abcam), anti-VEGF antibody (1:2000; Invitrogen), anti–TGF-β1 antibody (1:2000; Santa Cruz Biotechnology), anti–TGF-β3 antibody (1:2000; Santa Cruz Biotechnology), and anti–β-actin antibody (1:2000; Santa Cruz Biotechnology). After washing with TBST, the membranes were incubated with secondary goat anti-rabbit immunoglobulin G (IgG) Fc (1:10,000; Invitrogen) and goat anti-mouse IgG H+L (1:10,000; Invitrogen) antibodies for 2 hours at room temperature. After washing with TBST, the presence of proteins was detected using an enhanced chemiluminescence solution (Thermo Fisher Scientific) and quantified using ImageJ. For each protein, the ratio of band intensity to β-actin intensity was calculated.
Immunohistochemistry
To investigate the expression levels of COL1, COL3, VEGF, C-C chemokine receptor type 7 (CCR7), and CD163 in the Achilles tendon, sections were prepared for IHC. The expression of CCR7 and CD163 was evaluated to investigate immune cells. The sections were deparaffinized in xylene and rehydrated using an alcohol series. Antigen retrieval was performed overnight using Target Retrieval Solution (Dako) in a 40°C incubator oven. Endogenous peroxidase activity was blocked by incubating sections with 3% hydrogen peroxide (H2O2) for 30 minutes at room temperature. The diluted primary antibody was applied to the cross-sections and incubated at 4°C overnight. The primary anti-COL1 antibody (1:200; Invitrogen), anti-COL3 antibody (1:200; Invitrogen), anti-VEGF antibody (1:50; Invitrogen), anti-CCR7 antibody (1:50; Abcam), and anti-CD163 antibody (1:50; Abcam) were used. The sections were incubated in the presence of specific horseradish peroxidase–conjugated secondary goat anti-rabbit IgG and goat anti-mouse IgG antibodies (1:200; Vector Laboratories) for 2 hours. The sections were detected by avidin-biotin-peroxidase (Vector Laboratories) for 1 hour 30 minutes. The color reaction was developed using 3,3′-diaminobenzidine and hydrogen peroxide (Vector Laboratories) for 2 minutes. The sections were counterstained with hematoxylin and eosin.
Statistical Analysis
The sample size was calculated a priori by power analysis using G*Power (Version 3.1.9.7) based on data from our previous study, which used similar methods. 53 We calculated that a sample size of 6 rats (3 rats in each group) would provide a mean difference of 3.2 ± 0.9 in the histological scores, with a significance level of .05 and a power of 0.80 according to our previous study. 53
Means ± standard deviations were reported with corresponding P values. 42 Data normality was assessed using the Shapiro-Wilk test. A software-based Student t test was used to compare groups.27,42 The level of significance was set at a 2-sided P value of <.05. Statistical analyses were performed using SPSS (Version 22.0; IBM).
Results
Achilles Functional Index
Both the NG and CG exhibited continuous functional improvement from 1 to 6 weeks postoperatively (Figure 2). Compared with native tendons (–8.8 ± 10.9), the NG (–50.6 ± 21.5; P = .004) and CG (–51.8 ± 8.7; P = .006) exhibited a significantly longer paw length, narrower distance between the first and fifth toes, and reduced spreading between the second and fourth toes at 1 week. There were no significant differences between the NG and CG at 1 week (P = .931).
However, the AFI in the CG rapidly improved with healing time, such that a nearly normal gait was apparent at 3 weeks postoperatively (–6.8 ± 18.7; P = .880). In addition, the AFI in the CG showed significantly superior results compared to that in the NG (–43.0 ± 12.8; P = .040) at 3 weeks. At 6 weeks, the NG rats showed an improved AFI, and no significant differences were found between the NG and CG (–12.7 ± 3.9 vs −7.2 ± 13.7, respectively; P = .540).
Tendon CSA
In both the NG and CG, the CSA was significantly greater than that of the native tendons (5.5 ± 1.9 mm2; P < .05) at all time points. Beginning with a CSA of 16.6 ± 1.8 mm2 at 1 week postoperatively, the NG rats exhibited a continuous decrease to 13.8 ± 3.0 mm2 at 3 weeks and 9.1 ± 2.9 mm2 at 6 weeks (Figure 3). The CSA in the CG rats was 17.2 ± 3.0 mm2 at 1 week postoperatively and then continuously decreased to 14.6 ± 4.1 mm2 at 3 weeks and 14.1 ± 1.9 mm2 at 6 weeks. There was no significant difference between the 2 groups at 1 and 3 weeks. However, the CSA was significantly larger in the CG than that in the NG (14.1 ± 1.9 vs 9.1 ± 2.9 mm2, respectively; P = .015) at 6 weeks.

Biomechanical testing. Gross tendon images of the (A) noninjection group (NG) and (B) collagen injection group (CG) at 1 week postoperatively (right leg). Both groups showed continuity of the tendon. Mean values for (C) cross-sectional area, (D) load to failure, (E) stiffness, and (F) stress of rat tendons in each group. The dotted line indicates results for the native tendon (NT). Error bars indicate standard deviations. Statistically significant difference between the NG and CG tendons (*) at the same time point and between the NG or CG tendons and NTs (§) at the same time point (P < .05).
Load to Failure
Both the NG and CG exhibited a continuous increase in load to failure from 1 to 6 weeks postoperatively (Figure 3D). In the NG, load to failure was 26.7 ± 2.5 N at 1 week, after which it steadily increased to 27.0 ± 8.7 and 41.6 ± 14.4 N at 3 and 6 weeks, respectively. Compared with the NG, load to failure in the CG (1 week: 30.3 ± 12.1 N [P = .343]; 3 weeks: 42.1 ± 12.6 N [P = .049]; 6 weeks: 61.2 ± 22.0 N [P = .093]) was significantly greater at 3 weeks.
Compared with native tendons (31.4 ± 10.6 N), loads to failure in the NG and CG were comparable at 1 and 3 weeks. However, at 6 weeks, load to failure of CG tendons was significantly higher than that of native tendons (P = .025), and load to failure of NG tendons was still comparable to that of native tendons (P = .149).
Stiffness
Both the NG and CG exhibited a continuous increase in stiffness from 1 to 6 weeks postoperatively (Figure 3E). In the NG, stiffness was 8.4 ± 1.5 N/mm at 1 week and steadily increased to 10.3 ± 3.7 and 18.7 ± 3.2 N/mm at 3 and 6 weeks, respectively. Compared with the NG, stiffness in the CG (1 week: 10.4 ± 4.4 N/mm [P = .201]; 3 weeks: 18.8 ± 7.8 N/mm [P = .049]; 6 weeks: 24.8 ± 12.4 N/mm [P = .191]) was significantly higher at 3 weeks.
In both the NG and CG, tendons showed no significant difference in stiffness with that of the native tendons (20.5 ± 11.5 N/mm) at all time points. Stiffness in both groups was still less than that of native tendons at 1 and 3 weeks. At 6 weeks, stiffness of CG tendons was comparable to that of native tendons, and NG tendons still had decreased stiffness compared to native tendons.
Stress
Both the NG and CG exhibited a continuous increase in stress from 1 to 6 weeks postoperatively (Figure 3G). In the NG, stress was 1.7 ± 0.3 N/mm2 at 1 week and steadily increased to 2.0 ± 0.7 and 5.0 ± 2.3 N/mm2 at 3 and 6 weeks, respectively. Compared with the NG, stress in the CG (1 week: 1.8 ± 0.8 N/mm2 [P = .369]; 3 weeks: 3.0 ± 0.9 N/mm2 [P = .065]; 6 weeks: 4.3 ± 1.1 N/mm2 [P = .310]) did not differ significantly at any time point.
However, the CG exhibited earlier restoration of stress compared with the NG. Compared with native tendons (6.5 ± 3.6 N/mm2), stress in the CG differed significantly at 1 week postoperatively (P = .023) but was comparable at 3 weeks (P = .056). However, stress in the NG was comparable with that of the native tendons at 6 weeks (P = .256).
Histology
Both the NG and CG exhibited continuous improvement in histological scores from 1 to 6 weeks postoperatively (Figure 4). In the NG, the modified Bonar score was 10.7 ± 2.1 at 1 week, subsequently decreasing to 7.3 ± 1.2 at 3 weeks and 5.3 ± 1.5 at 6 weeks. In the CG, the modified Bonar score was 10.0 ± 1.0 at 1 week, subsequently decreasing to 7.0 ± 1.0 at 3 weeks and 5.3 ± 0.6 at 6 weeks. The histological scores were comparable between the 2 groups.
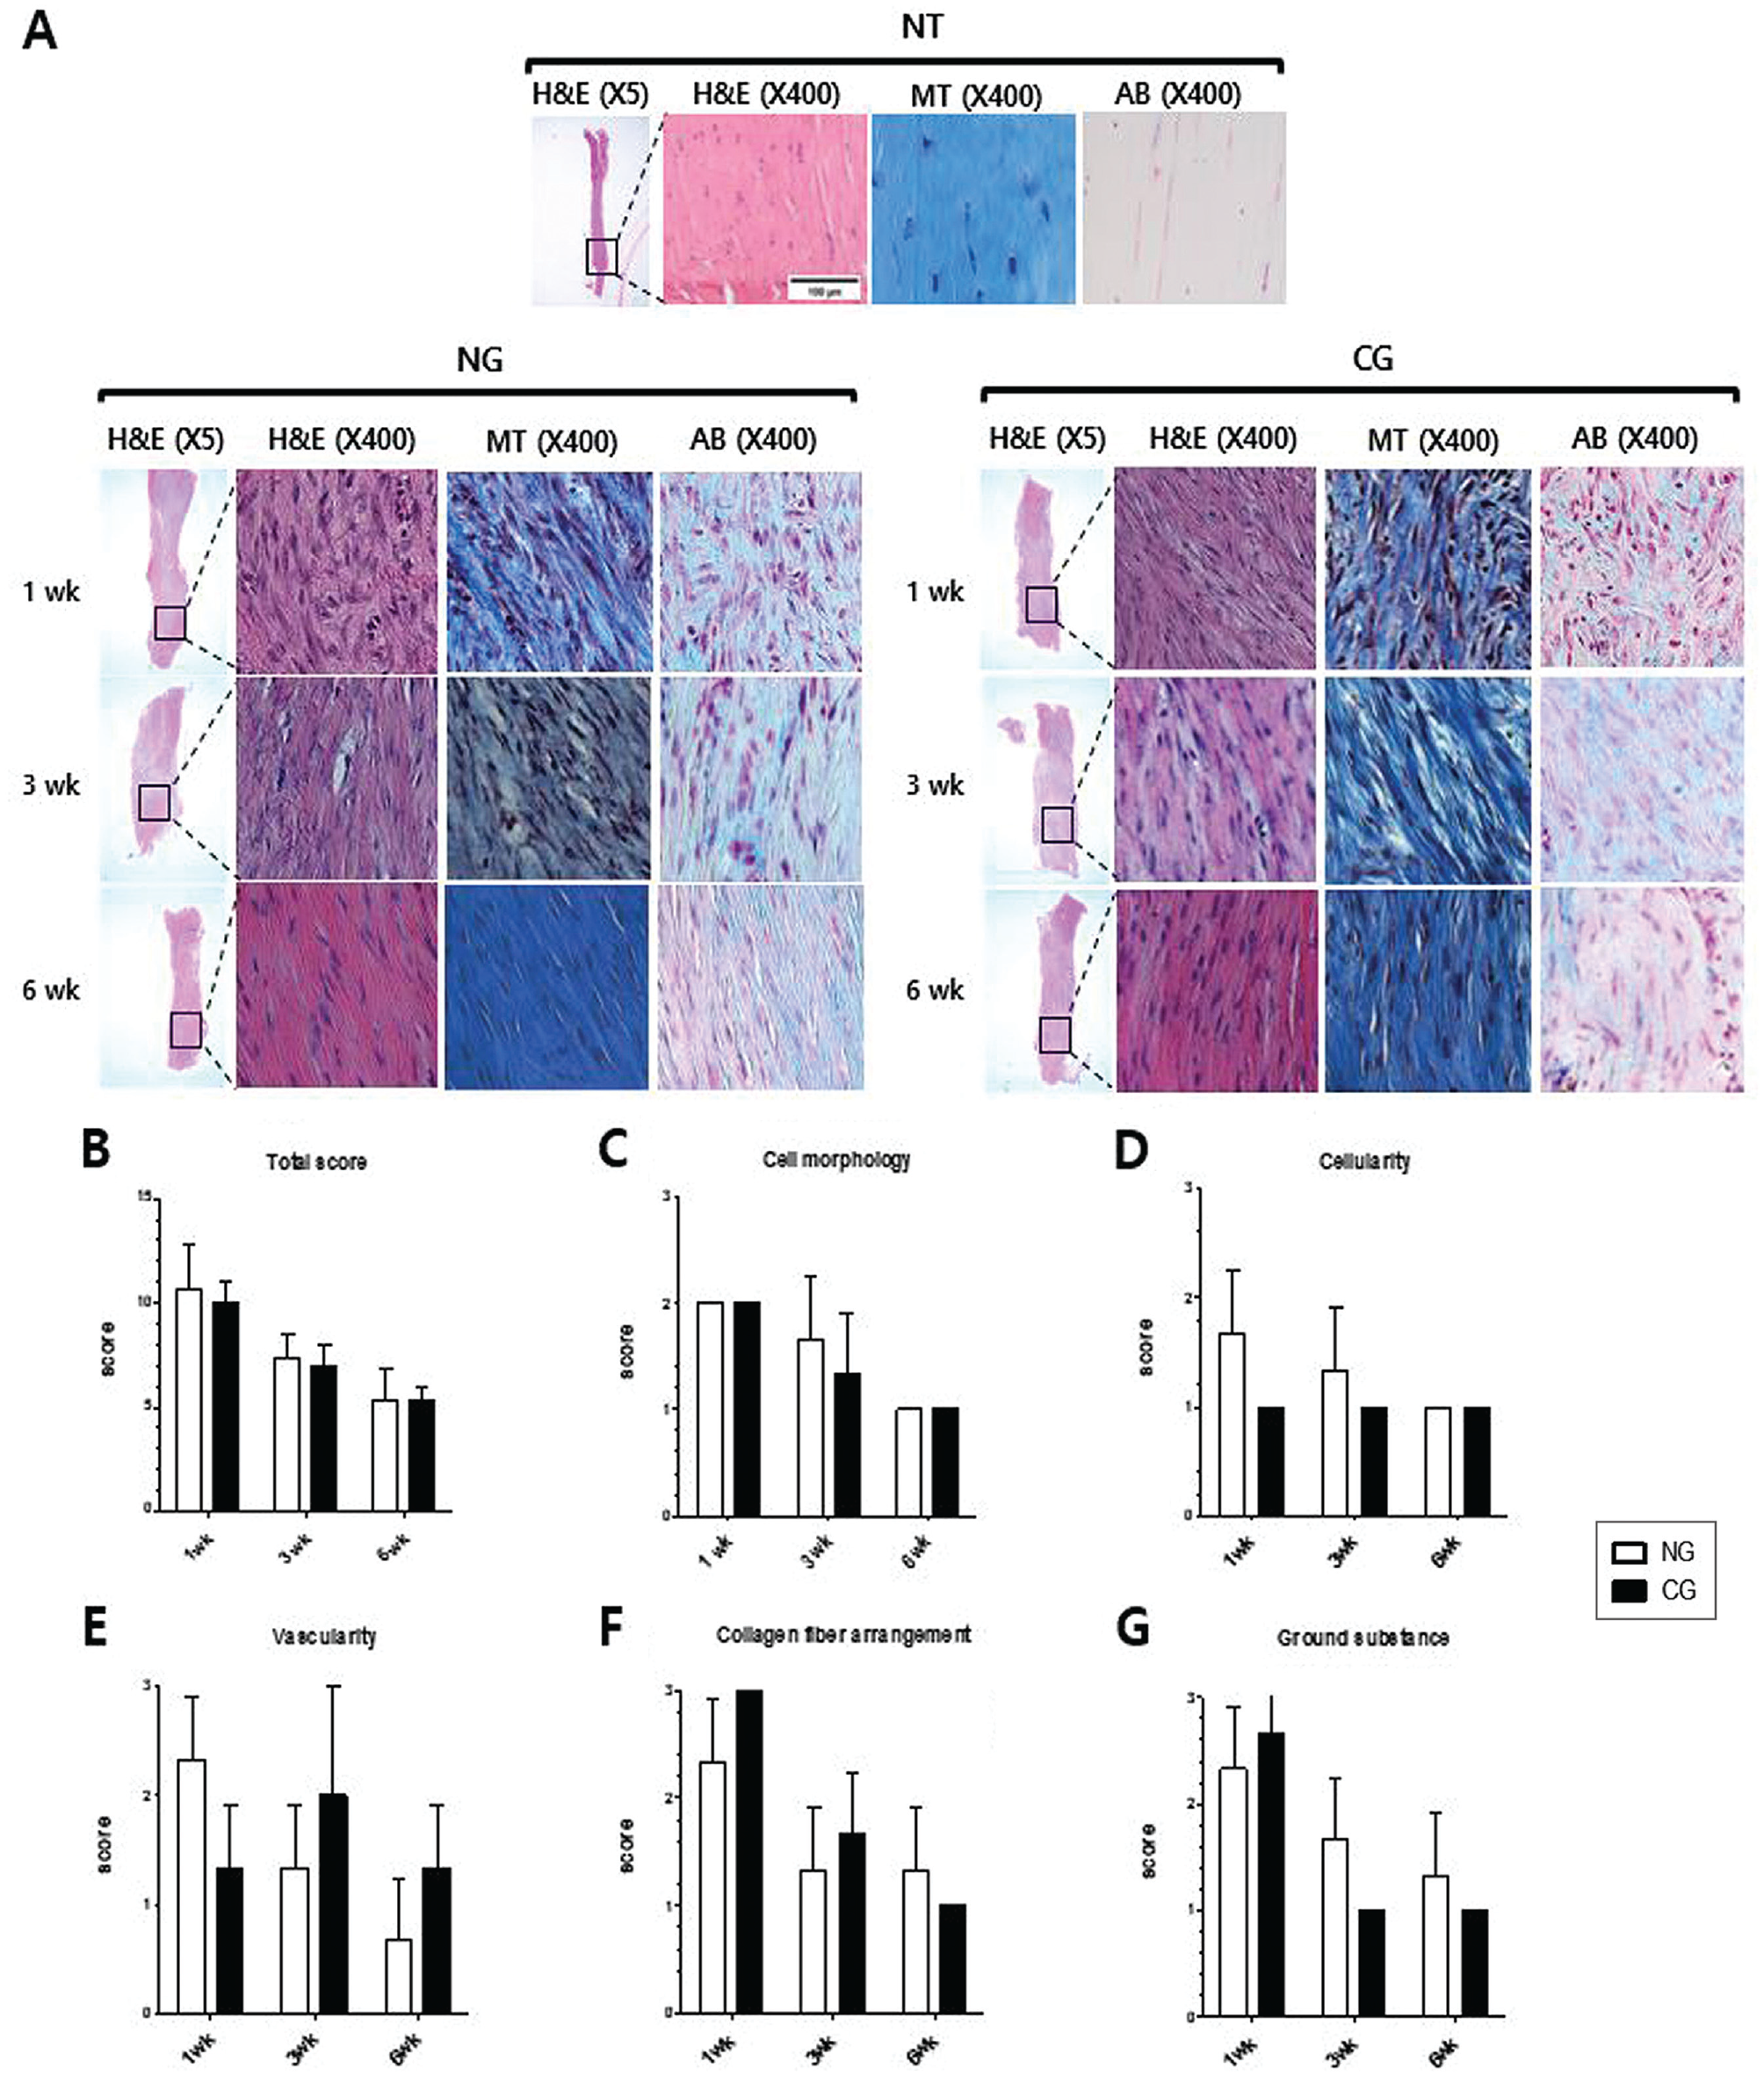
Histological analysis. (A) Microscopic images of native tendons (NTs), noninjection group (NG) tendons, and collagen injection group (CG) tendons at 1, 3, and 6 weeks. Specimens were evaluated by histological criteria according to the modified Bonar score. The region with the greatest alteration in cell morphology was identified and evaluated. Magnification of hematoxylin and eosin staining (H&E; 5× and 400×), Masson trichrome staining (MT; 400×), and Alcian blue staining (AB; 400×). Histological evaluation results of (B) total score, (C) cell morphology, (D) cellularity, (E) vascularity, (F) collagen fiber arrangement, and (G) accumulation of ground substance using the modified Bonar score.
Transmission Electron Microscopy
Figure 5A shows the distribution of collagen fibril diameters in healing tendon tissue in the NG and CG. Both groups exhibited an increase in collagen fibril diameters from 3 to 6 weeks postoperatively. The distribution of collagen fibril diameters within each group was not uniform. In the NG, the mean diameter of collagen fibrils was 72.6 ± 58.2 nm at 3 weeks, subsequently increasing to 144.0 ± 84.2 nm at 6 weeks (Figure 5, B and C). Compared with the NG, the mean diameter of collagen fibrils in the CG (3 weeks: 117.2 ± 91.0 nm [P < .001]; 6 weeks: 202.1 ± 83.0 nm [P < .001]) was significantly greater at 3 and 6 weeks. The mean diameter in both groups exhibited no significant difference with native tendons (154.9 ± 31.9 nm; P > .05) at 3 and 6 weeks.

Transmission electron microscopy (TEM) analysis. (A) TEM images of native tendons (NTs), noninjection group (NG) tendons, and collagen injection group (CG) tendons at 3 and 6 weeks and frequency of collagen fibril diameters in each group. Mean diameter of collagen fibrils in the NG and CG at (B) 3 weeks and (C) 6 weeks. TEM results showed an enlarged diameter of collagen fibrils in the CG compared with the NG. ***Statistically significant difference between the NG and CG (P < .001).
Western Blotting
Western blot analysis revealed that COL1 expression was significantly higher in the CG than that in the NG at 1 week (P = .005) and 6 weeks (P = .001) (Figure 6). COL1 expression in the CG showed comparable results with native tendons at 1 week (P = .104) and 6 weeks (P = .069). The NG revealed significantly lower COL1 expression than native tendons (P = .043) at 1 week. The NG showed an increase of COL1 from 1 to 6 weeks, and the CG showed a decrease of COL1 from 1 to 6 weeks. There was no significant difference in COL3 expression between the 2 groups at 1 week (P = .208). COL3 expression at 6 weeks in the CG was significantly higher than that in the NG (P = .011) and showed comparable results with native tendons (P = .055). Both groups showed a decrease of COL3 from 1 to 6 weeks.
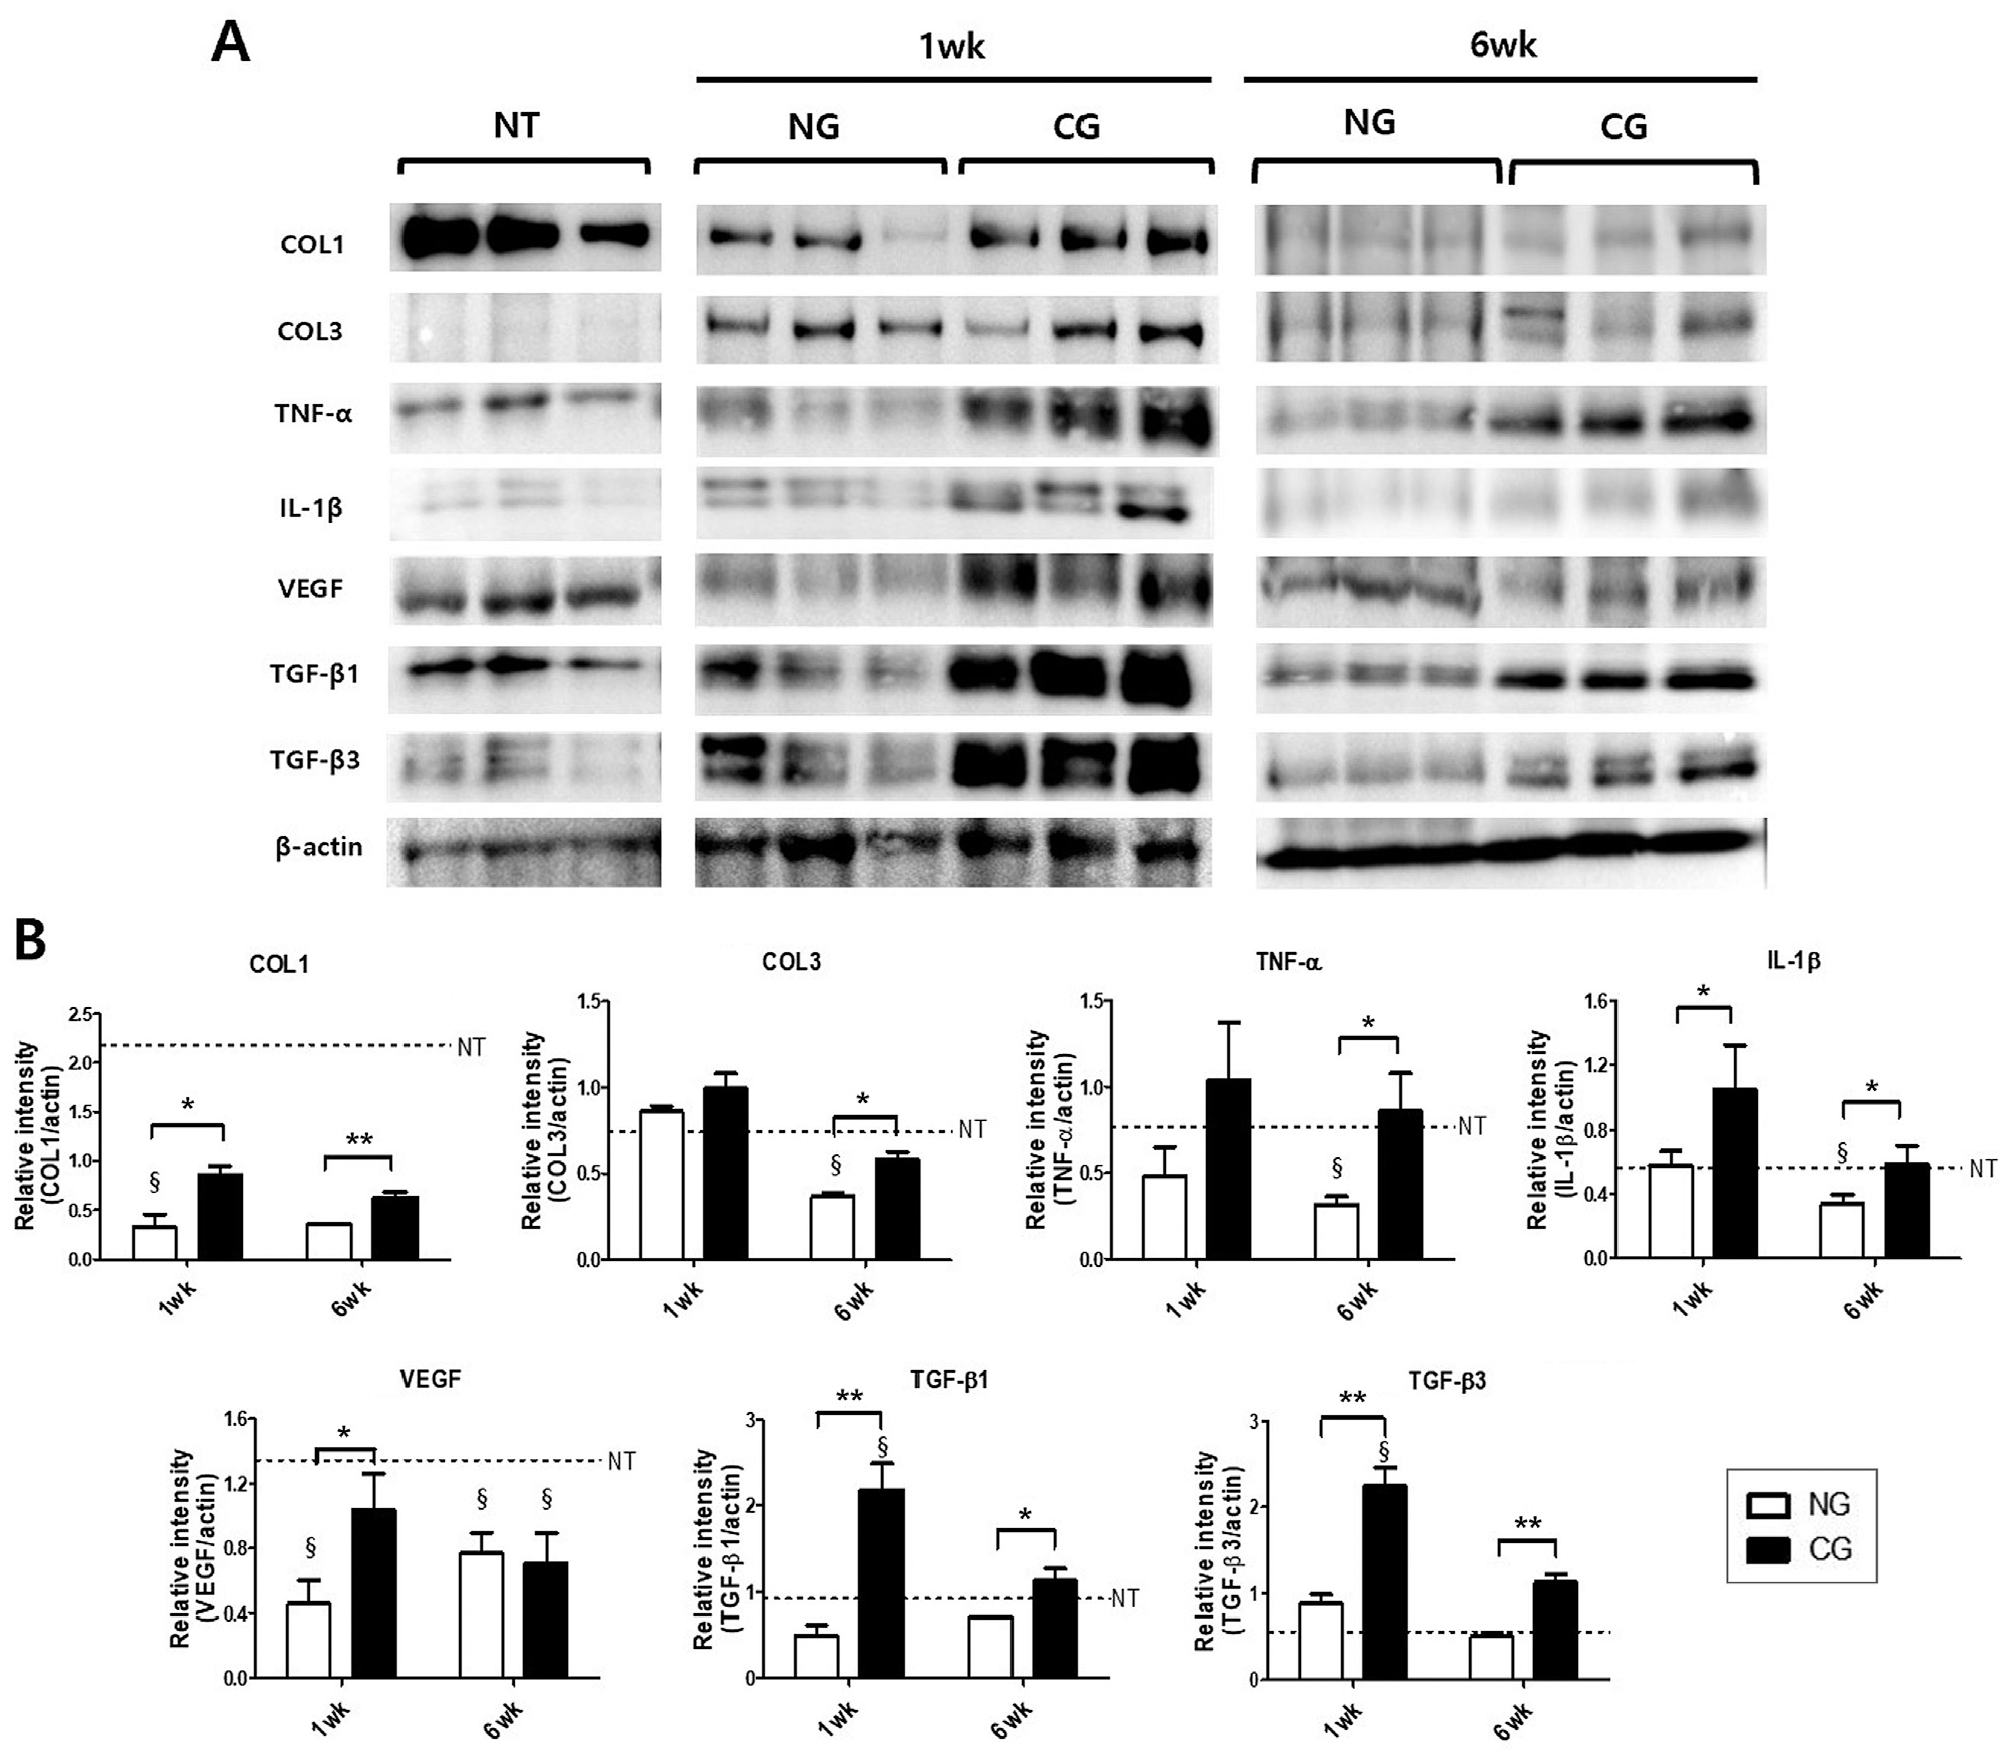
Western blot analysis. (A) Representative western blot bands of collagen type I (COL1), collagen type III (COL3), tumor necrosis factor–alpha (TNF-α), interleukin-1 beta (IL-1β), vascular endothelial growth factor (VEGF), transforming growth factor–beta 1 (TGF-β1), transforming growth factor–beta 3 (TGF-β3), and β-actin. (B) For each protein, the ratio of band intensity to β-actin intensity was calculated. Values represent the means (y-axis) for each group's samples (x-axis). Error bars indicate standard deviations. Statistically significant difference between groups at the same time point (*P < .05, **P < .01) and compared with the native tendon (NT) at the same time point (§) (P < .05). CG, collagen injection group; NG, noninjection group.
TNF-α expression in the CG was significantly higher than that in the NG at 6 weeks (P = .046). IL-1β expression in the CG was significantly higher than that in the NG at 1 week (P = .045) and 6 weeks (P = .031). VEGF expression in the CG at 1 week was significantly higher than that in the NG (P = .021) and showed comparable results with native tendons (P = .114). TGF-β1 expression in the CG was significantly higher than that in the NG at 1 week (P = .001) and 6 weeks (P = .006). TGF-β3 expression in the CG was significantly higher than that in the NG at 1 week (P = .001) and 6 weeks (P = .001).
Immunohistochemistry
Collagen synthesis and organization were evaluated with IHC for COL1 and COL3. IHC revealed that COL1 expression was higher in the CG than that in the NG at 1 and 6 weeks (Figure 7). COL3 expression was higher in the CG than that in the NG at 6 weeks. VEGF expression in the CG at 1 week was higher than that in the NG. Immune cells were investigated with CCR7 and CD164. CCR7 expression in both groups showed a decrease from 1 to 6 weeks. CCR7 expression showed no significant differences between the 2 groups at 1 and 6 weeks. CD163 expression in both groups showed an increase from 1 to 6 weeks. CD163 expression showed no significant differences between the 2 groups at 1 and 6 weeks.

Immunohistochemistry (IHC). Representative IHC images of (A) collagen type I (COL1), (B) collagen type III (COL3), (C) vascular endothelial growth factor (VEGF), (D) C-C chemokine receptor type 7 (CCR7), and (E) CD163 at 1 and 6 weeks. 200× magnification. CG, collagen injection group; NG, noninjection group.
Discussion
The most important finding of this study was that COL1 expression was significantly higher in the CG rats than that in the NG rats at 1 and 6 weeks, as revealed by western blotting and IHC. CG rats showed earlier restoration of the Achilles tendon and exhibited improved functional, biomechanical, and ultrastructural morphological outcomes than NG rats. The 2 groups showed comparable histological results. The findings of this study support our hypothesis that an atelocollagen injection enhances spontaneous healing of the Achilles tendon.
The quantification of functional return is a vital tool in the evaluation of tendon healing. In the present study, paw print parameters and the AFI indicated sharp functional reductions at 1 week postoperatively, which subsequently improved. Both groups exhibited nearly normal gait at 6 weeks. These results were consistent with previous studies.36,43 At 3 weeks postoperatively, the CG rats showed a significant improvement in the AFI with a nearly normal gait and exhibited a superior AFI compared with the NG rats. We presume that the earlier functional recovery in the CG rats might have resulted from the rapid restoration of biomechanical properties in the Achilles tendon.5,44,53 Previous analyses of the biomechanical properties of the Achilles tendon during healing have indicated that the rate of functional recovery is similar to the rate of mechanical recovery.5,43,53
Macroscopic analysis at 1 week postoperatively revealed that the tendons in both groups presented as soft, glistening, and pearl-white longitudinally arranged structures with continuity. No gap in the tendon callus or infection sign was apparent in either group at any time point. There was almost no macroscopic difference in the presence of adhesions between the 2 groups. The tendon CSA and mechanical properties (ie, load to failure and stiffness) are important parameters for evaluations during the healing process.33,42,52,53 In both groups, the CSA was significantly higher than that in native tendons at all time points and showed a continuous decrease from 1 to 6 weeks postoperatively. In addition to collagen fibers, the tendon ECM is composed of many other components including ground substance, elastic fibers, and inorganic components. 15 Ground substance comprises hyaluronan, proteoglycans, structural glycoproteins, and a wide variety of other molecules. 15 We presume that the decreasing trend of the CSA might have resulted from a reduction in hydrated ground substance, although collagen fibrils were enlarged during tendon regeneration from 3 weeks to 6 weeks. The CSA was significantly larger in the CG than that in the NG at 6 weeks. The larger CSA of CG tendons may be caused by increased collagen fibril diameters, as corroborated by TEM analysis. It is controversial whether a larger CSA indicates beneficial effects of a certain treatment method, but a recent study by Müller et al 42 showed that the CSA of the tendons receiving collagen sponges remained higher than the control group during the entire period of the study (1, 2, and 4 weeks), and they interpreted a larger CSA in the collagen sponge group as a favorable biomechanical parameter. They described the following: “tendons receiving the collagen inserts were much stronger after 1 and 2 weeks than control tendons, showing significantly higher loads to failure at 1 week, in agreement with these CSA.”
In both groups, load to failure, stiffness, and stress showed a continuous increase from 1 to 6 weeks postoperatively. Tendons with increased stiffness may exhibit more efficient force transfer. 42 Load to failure and stiffness were significantly greater in the CG than those in the NG at 3 weeks. The CG also showed greater load to failure than the native tendons at 6 weeks. The rapid restoration of collagen fibers might have induced the early recovery of load to failure and stiffness in the CG, as tendon biomechanical properties crucially depend on the high degree of COL1 organization in the ECM.20,60 Stress, calculated as load to failure divided by the CSA, which indicates the efficiency of load transfer per unit area, also showed earlier recovery in CG tendons compared with NG tendons at 3 weeks. However, neither group could reach the mean stress value of the native tendons until 6 weeks. The results might be explained by the significantly larger CSA of the NG and CG tendons compared with the native tendons. Additional experiments with longer time periods (>6 weeks) will be needed to investigate whether these biomechanical parameters tend to normalize to native tendons in both groups.
The histopathological changes associated with a tendon injury include cellular changes, collagen disruption, vascular proliferation, and enhanced ground substance levels.11,16,38,53 Both groups exhibited continuous improvement in histological scores from 1 to 6 weeks postoperatively. The modified Bonar score was comparable between the 2 groups. The changes in cellular morphology in both groups were extensive and distinctive in the present study.11,16,53 Round and enlarged nuclei with visible cytoplasm were apparent at 1 week postoperatively, with inconspicuous elongated spindle-shaped nuclei without apparent cytoplasm being gradually observed at 6 weeks postoperatively. These findings indicate that fibroblasts proliferated or migrated into the defect and synthesized a new ECM (primarily collagen and ground substance) during the inflammatory phase. 47
Because cross-sections can show the diameter and distribution of collagen fibrils, TEM is a useful method for evaluating the ultrastructure of tendons.18,53,62 Recently, it has become a valuable approach for evaluating tendon morphology from tissue to the collagen fiber level.18,53,62 The smallest structural unit of collagen fibers is a fibril, whose diameter ranges from a few nanometers to about 500 nm.15,66 Collagen fibrils gather to form collagen fibers, and collagen fibers combine to form fascicles.15,39 Compared with the NG tendons, the mean diameter of collagen fibrils in the CG tendons was significantly higher at 3 and 6 weeks. Increased COL1 expression in the CG might have induced the earlier restoration and maturation of collagen fibers, leading to superior biomechanical and functional results in CG tendons compared with NG tendons.
COL1 is the most abundant molecule in the tendon ECM, accounting for approximately 95% of total collagen, followed by COL3. 15 In the inflammatory and reparative phases, COL3 is increased relative to COL1. 15 The 1- and 6-week time points in our study seem to correspond to the inflammatory and remodeling phases, respectively. 15 Western blotting in the present study revealed a decrease of COL3 from 1 to 6 weeks in both groups. The NG showed an increase and the CG showed a decrease of COL1 from 1 to 6 weeks. The initial steep rise of COL1 in CG tendons at 1 week and a relative decrease at 6 weeks may be mainly caused by exogenous atelocollagen injected into the lesion area. The most important finding was that the CG showed a significantly higher expression of COL1 than the NG at both 1 and 6 weeks. These results were confirmed by IHC. The increase of COL1 in the CG might have accelerated tendon regeneration. Additional studies with longer time periods (>6 weeks) could potentially reveal the continual increase of COL1 expression and decrease of COL3 expression through the replacement of COL3 by COL1 with further maturation of tendon healing.
The exact mechanism by which an atelocollagen injection has an effect on TNF-α, IL-1β, VEGF, and TGF-β has not yet been elucidated. However, it has been demonstrated that initially, certain inflammatory cytokines, such as IL-1β, are produced by invading inflammatory cells. 15 Later, tissue repair is facilitated by a number of growth factors released at the injury site. 15 TNF-α and IL-1β are proinflammatory cytokines that stimulate scarring and fibrosis. 57 Western blotting in the present study revealed a decrease of TNF-α and IL-1β from 1 to 6 weeks in both groups. Compared to the NG, the CG showed higher TNF-α expression at 6 weeks and higher IL-1β expression at 1 and 6 weeks. Further investigation is required to demonstrate how atelocollagen treatment has an effect on these inflammatory cytokines and how these results have an influence on tendon healing.
The increased expression of growth factors such as VEGF and TGF-β is particularly prominent in the early phases of healing, and these growth factors are important in tendon healing.57,64 Compared to the NG, the CG showed higher VEGF expression at 1 week on western blotting and IHC. VEGF promotes angiogenesis during tendon regeneration. 49 Atelocollagen treatment might have induced the release of VEGF, which resulted in the acceleration of angiogenesis in the early phases of tendon healing. Compared to the NG, the CG showed higher TGF-β1 and TGF-β3 expression at both 1 and 6 weeks on western blotting. TGF-β is known to stimulate the production of the ECM, including COL1 and COL3, as well as tendon cell migration and mitogenesis.30,64 High levels of TGF-β expression and activity are found throughout the course of tendon healing. Among the TGF-β isoforms, previous studies have shown that TGF-β1 is a major mediator in the healing phase and that this factor promotes collagen production, angiogenesis, and ECM formation.13,30,64 In addition, TGF-β1 affects fibroblastic activity and inhibits the enzymatic degradation of matrix molecules, which provide structural and biochemical support and accelerate growth and healing.10,30 Yoon et al 64 found improved biomechanical and histological outcomes in rotator cuff healing through the sustained release of TGF-β1 in a rabbit model. However, we should also partly consider that Achilles tendon healing accelerated by TGF-β1 in the present study may be scar-mediated healing, as TGF-β1 helps to increase COL3 production and is related to the formation of fibrovascular scarring, which is composed primarily of COL3. TGF-β3 is well known for its antifibrotic effects.8,48 Previous studies have also demonstrated the potential effects of TGF-β3 on the tendinogenic differentiation of stem cells. 3 Recently, Cetik et al 8 reported the effectiveness of TGF-β3 on Achilles tendon healing in a rat model. The higher expression of these TGF-β isoforms in CG rats might have had a more favorable effect on tendon regeneration than that in NG rats. Further studies are warranted to investigate the exact effect of atelocollagen on these growth factors.
Classically activated (M1) macrophages are proinflammatory and stimulate scarring and fibrosis.55,57 Alternatively activated (M2) macrophages are anti-inflammatory and effective at clearing excess ECMs. CCR7 and CD163 were evaluated as M1 and M2 phase markers, respectively. 55 Both groups showed a decrease of CCR7 expression and an increase of CD163 expression from 1 to 6 weeks. There were no significant differences between the 2 groups regarding the expression of CCR7 and CD163 at 1 and 6 weeks. Previous studies have reported that M1 cells predominate early, whereas M2 macrophages accumulate later in a tendon injury model, and this was supported by the present study. 57 However, TNF-α and IL-1β were not consistent with the data of the M1 phase marker in the present study, and exact relationships among M1 and M2 phase markers and proinflammatory and anti-inflammatory cytokines in tendon healing after atelocollagen treatment need to be demonstrated.
Based on the results of the present study, an atelocollagen injection might be a good adjuvant option for the nonoperative treatment of ATRs. The ECM of tendons consists mainly of COL1 (>95%), COL3, collagen type V, proteoglycans, elastin, and fibronectin.20,51 Hence, it seems reasonable to use biomaterials composed of COL1. COL1 also induces cell migration and improves cell viability in a stable matrix structure. 2 The therapeutic effect of exogenous collagen injected into the lesion area is based on the restoration of proper fiber biostructures. This leads to tissue regeneration, improved motor function, and load resistance. 22 As an adjuvant to nonoperative treatment, an injection of gel-type collagen may be the most appropriate method because it does not require any skin incision, in contrast to the sponge 42 and patch 54 or other scaffolds. Kim et al 28 demonstrated that an intratendinous atelocollagen injection for the nonoperative treatment of partial-thickness rotator cuff tears led to improvements in functional outcomes and decreased tear sizes. Most importantly, an injection of atelocollagen in tendon gaps is simple and easy to perform. 27 Ultrasonography can be a useful tool to find and confirm the Achilles tendon gap for accurate injections of atelocollagen. 28
To the best of our knowledge, this is the first in vivo experimental study to investigate the effects of an atelocollagen injection for the nonoperative treatment of ATRs. The other strength of the study is our multipronged functional, 43 biomechanical, 47 histological, 16 ultrastructural morphological,18,62 and molecular 53 approach to evaluate the tendon healing effect of collagen injections.
Limitations
There were some limitations to our study. First, its duration was relatively short, and further studies with longer time periods are warranted to reveal the long-term effects of collagen injections on tendon healing. This study was designed with an observation period of 6 weeks, possibly limiting the significance of the further progression of biomechanical and molecular properties. Additional experiments will be needed to determine whether biomechanical (including tendon CSA and stiffness), histological, ultrastructural, and molecular parameters normalize to native tendons. Second, animals were not immobilized, as is often done for human patients. Also, injections were given at the time of the tendon injury, which may not easily translate to the clinical setting. Third, the exact mechanisms by which a collagen injection affects molecular, cellular, and matrix changes in tendon repair remain unknown, and further studies using gene analysis may provide novel insights. Moreover, clinical studies of atelocollagen injections in patients with ATRs will be needed in the future to evaluate whether collagen also supports the healing potential of human tendons.
Conclusion
In the current study, COL1 expression was found to be significantly higher in the CG tendons than that in the NG tendons. As a result, the Achilles tendon of CG rats exhibited earlier recovery and better functional, biomechanical, and morphological outcomes compared with NG rats. As an atelocollagen injection seems to increase the amount of COL1 and enhance tendon regeneration without adverse reactions, it might be a good adjuvant option for the nonoperative treatment of ATRs.
Footnotes
Final revision submitted May 10, 2023; accepted May 19, 2023.
One or more of the authors has declared the following potential conflict of interest or source of funding: Funding for this study was provided by the National Research Foundation of Korea (grants RS-2023-00211971 and 2022R1F1A1074656). AOSSM checks author disclosures against the Open Payments Database (OPD). AOSSM has not conducted an independent investigation on the OPD and disclaims any liability or responsibility relating thereto.
Ethical approval for this study was obtained from Konyang University (No. 21-05-A-01).