
Abstract
Background:
Internal impingement is a common cause of shoulder pain and dysfunction in baseball pitchers.
Purpose/Hypothesis:
The purpose of this study was to determine if the amount of rest days between outings, the number of innings pitched in each outing, and the number of batters faced in each outing are risk factors for internal impingement in professional baseball pitchers. It was hypothesized that a higher workload would significantly increase a pitcher’s risk of developing internal impingement.
Study Design:
Case-control study; Level of evidence, 3.
Methods:
All professional (Major and Minor League) baseball pitchers who were diagnosed with internal impingement between 2011 and 2017 were identified using the Major League Baseball’s Health and Injury Tracking System. A separate player usage data set was used to determine workload. The authors compared workload variables (days of rest, innings pitched, and batters faced per game) between each of 4 injury-exposure groups (pitchers with documented internal impingement <2, <6, <12, and >12 weeks after a game) and a control group of pitchers with no internal impingement using Student t tests or Mann-Whitney U tests. In a within-pitcher paired analysis of the injury groups, the workload variables during 3 acute periods (<2, <6, and <12 weeks preinjury) were compared with the baseline values (>12 weeks preinjury).
Results:
Overall, there were 624 professional baseball pitchers diagnosed with internal impingement during the study period. Compared with pitcher games (n = 213,964), pitchers in all 4 injury-exposure groups had significantly more innings pitched per game (P ≤ .003 for all) and faced significantly more batters per game (P < .001 for all). There were significantly more starting pitchers in each of the injury-exposure groups when compared with the controls (P < .001 for all). However, when comparing acute and baseline workloads in the pitchers diagnosed with internal impingement, there were no significant differences in the number of innings pitched, batters faced, or days of rest.
Conclusion:
This analysis revealed significantly greater pitcher workload and percentage of starting pitchers in professional baseball players diagnosed with internal impingement when compared with healthy controls. However, this injury did not seem to be associated with an acute increase in workload.
Internal impingement has become one of the most common causes of shoulder pain and dysfunction in overhead athletes, specifically in baseball pitchers. 4 Internal impingement involves abnormal glenohumeral contact during shoulder motion that causes the undersurface of the rotator cuff, commonly the posterior supraspinatus and infraspinatus, to become pinched between the humeral head and glenoid. 11,12,16 This can result in a partial-thickness, articular-sided rotator cuff tear or a posterosuperior labral tear. 13 The exact reason for this abnormal contact between the humeral head and glenoid has not yet been definitively identified. Some believe it may be caused by posterior capsular tightness or anterior capsular laxity that leads to abnormal decentering humeral translation when the shoulder is brought into abduction and maximal external rotation. 5,18 The posterior capsule can become tight as a result of repetitive trauma sustained during the deceleration phase of the throwing cycle, where the posterior capsule sees a tremendous amount of stress as it attempts to decelerate the arm. 17 Similarly, the anterior capsule can become lax as pitchers work to gain external rotation. This stress causes the posterior capsule to become less pliable and more rigid, thereby contributing to internal impingement. This pathology subsequently damages the rotator cuff. Surgical treatment of rotator cuff injuries in pitchers is often career-ending. 4 Prevention strategies are thus critical.
Previous studies have evaluated potential risk factors for shoulder pain in baseball pitchers of all levels of competition and found that increased workload is a potential risk factor for generalized shoulder pain. 8,9 Most studies, however, have looked at risk factors for shoulder pain in general and not specifically at risk factors for internal impingement. It is critical to determine the modifiable risk factors for internal impingement in order to decrease the number of these injuries in baseball pitchers. Some studies have found a loss of shoulder internal rotation (which may be a proxy for posterior capsular tightness) or total arc of motion to be a risk factor for internal impingement. 22,23 Correction of this loss of motion often resolves symptoms of internal impingement. 21 –23 No study to date has evaluated individual workload as a risk factor for internal impingement.
The purpose of this study was to determine if the amount of rest between outings, innings pitched in each outing, and batters faced in each outing, as well as being a starting pitcher, are risk factors for internal impingement in professional baseball pitchers. We hypothesized these factors would significantly influence a pitcher’s risk of developing internal impingement.
Methods
This study was performed with institutional review board approval. Two deidentified data sets of player information were provided by Major League Baseball (MLB). The first was a list of all injuries reported in the MLB Health and Injury Tracking System (HITS) database for the 2011 through 2017 seasons. HITS is a centralized database that contains deidentified player information; it was developed as a league-wide injury surveillance system in 2010 to record player injuries and injury time. 19 HITS has been used in several prior studies and has been found to be a reliable source of information. 1,2,6,7 The second data set was a record of player usage between 2011 and 2017. Each player was assigned a unique identification (ID) that linked the 2 data sets.
The first data set was reviewed, and the player ID and player usage data for all injuries described or classified as internal impingement were retrieved; duplicates were removed. The player usage data set included the injury game date, whether a pitcher was a starter or a reliever, the number of innings pitched per outing, and the number of batters faced per outing for each pitcher. From these, the number of days between the injury game and the game prior were calculated to determine the days of rest before each game for each pitcher. Gaps of >175 days were excluded to avoid rest between seasons.
Each injury game for each pitcher was considered an independent injury exposure (pitcher game). Each pitcher game was then classified into 1 of the following pitcher-exposure groups: (1) a pitcher who did not have internal impingement, (2) a pitcher who had internal impingement <2 weeks after the game, (3) a pitcher who had internal impingement <6 weeks after the game, (4) a pitcher who had internal impingement <12 weeks after the game, (5) a pitcher who had internal impingement within another period (>12 weeks after the game), or (6) a pitcher who had internal impingement before the game. The final group was excluded to avoid data related to rehabilitation after injury. Pitchers who never had a diagnosis of internal impingement were classified as controls.
Statistical Analysis
All analyses were conducted in Excel Version 16 (Microsoft) and SPSS Version 26 (IBM). All data were evaluated for normality using the Kolmogorov-Smirnov test, and parametric and nonparametric tests were used as indicated. We compared workload variables (days of rest, innings pitched, and batters faced per injury game) between each of the 4 injury-exposure groups and the control group using Student t tests and Mann-Whitney U tests as appropriate based on data normality. To determine whether an acute change in rest and workload altered injury risk, we conducted a paired analysis within the injury-exposure groups, comparing the workload variables during 3 different acute time points (<2, <6, and <12 weeks preinjury) with a baseline workload (>12 weeks preinjury) using paired-samples Student t tests and related-samples Wilcoxon signed-rank tests, as appropriate. We also compared the percentage of starters within each of the injury-exposure groups to the percentage of starters in the control group using the chi-square test and calculated relative risk ratios. Statistical significance was set at P < .05.
Results
During the 7-year period of the study, there were 1167 cases of internal impingement recorded in the MLB HITS database, which accounted for 3.5% of the 33,592 injuries within the data set. After the elimination of duplicates, this provided 1002 unique cases of internal impingement. These 1002 cases included 624 (62%) pitchers and 378 (38%) position players, 681 (68%) right-sided injuries and 321 (32%) left-sided injuries, and 795 (79%) right-handed throwers and 207 (21%) left-handed throwers. At the time of injury, 368 players (37%) were on Major League teams and 634 (63%) were on Minor League teams. The players had a mean (± SD) age of 26 ± 4 years at the time of the injury. These injuries resulted in a mean of 46 ± 95 days missed. Position players were not included in the remainder of the analysis; thus, we evaluated 624 pitchers.
Of the 1,046,755 pitcher games, 19% (202,747) involved a pitcher who had internal impingement at some point during his career; 0.3% of injuries (3271) were <2 weeks before the injury, 0.9% (9055) were <6 weeks before the injury, 1.5% (15,228) were <12 weeks before the injury, and 7.5% (78,002) were >12 weeks before the injury. The control group consisted of 213,964 pitcher games. Of the included pitcher games, 28.1% (77,230/275,139) involved a starting pitcher.
Days of Rest
There were no significant differences in days of rest before a game between the 4 injury-exposure groups and the control group (Table 1). In the within-pitcher paired analysis, there were no significant differences in days of rest between any of the acute time points when compared with the baseline preinjury value (Table 2). In addition, there was no clear dose-response relationship between days of rest and the percentage of pitchers diagnosed with internal impingement >12 weeks after a game (Figure 1).
Comparison of Workload Variables Between Controls and Pitchers Who Developed Internal Impingement <2, <6, <12, and >12 Weeks After a Game a

a Data are presented as mean ± SD. Boldface P values indicate a statistically significant difference between groups (P < .05, Mann-Whitney U test).
Comparison of Workload Variables Between Baseline (>12 weeks preinjury) and Acute (<2, <6, and <12 weeks preinjury) Workload in Pitchers With Internal Impingement a
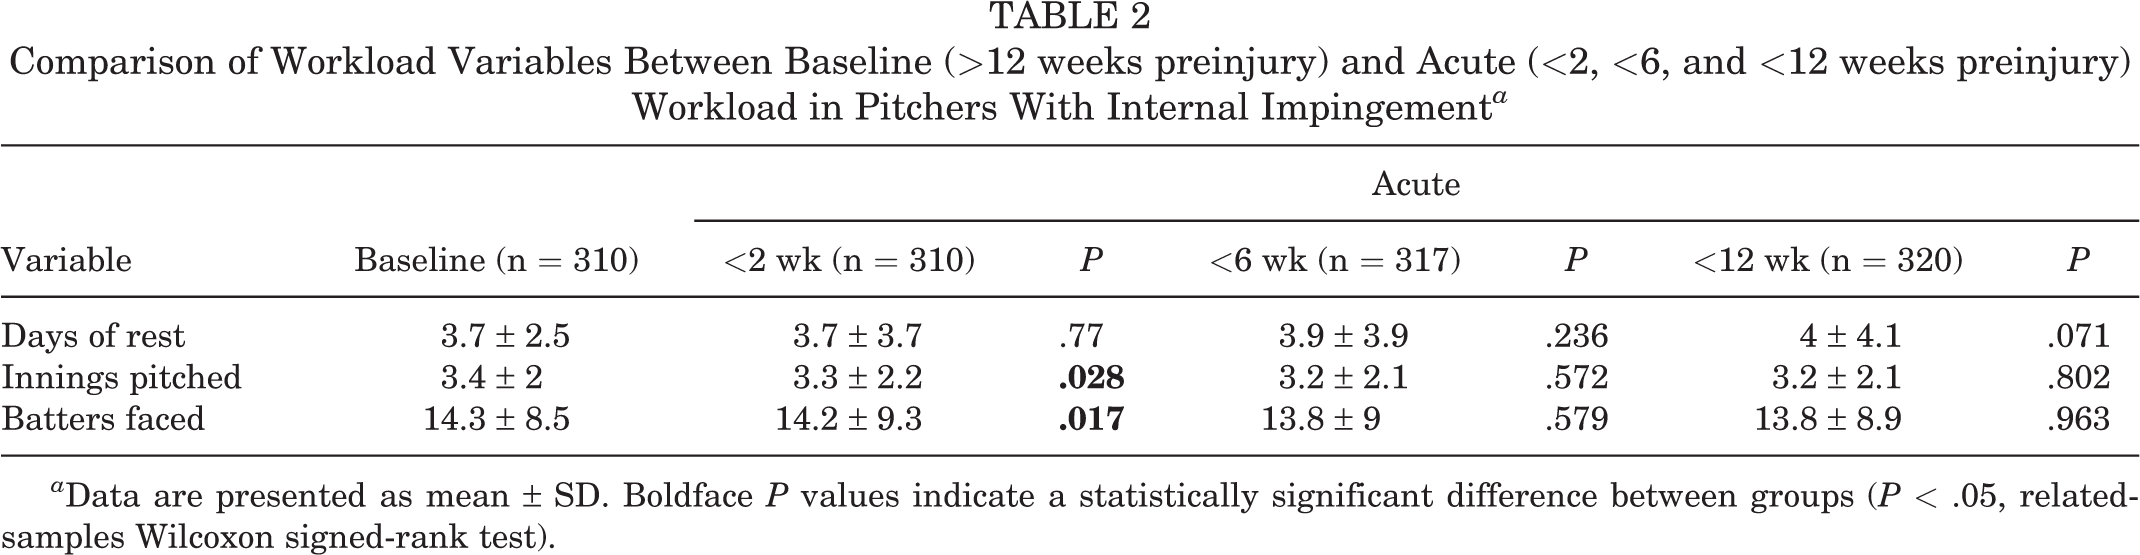
a Data are presented as mean ± SD. Boldface P values indicate a statistically significant difference between groups (P < .05, related-samples Wilcoxon signed-rank test).

Percentage of pitchers with internal impingement >12 weeks after an injury game according to the number of days of rest before the game.
Innings Pitched
There were significantly more innings pitched per game in all 4 of the injury-exposure groups when compared with the control group (P ≤ .003 for all) (Table 1). While there were fewer innings pitched when comparing player games <2 weeks before internal impingement to baseline workload (P = .028), there were no significant differences when comparing pitcher games <6 and <12 weeks before internal impingement versus baseline (P = .572 and .802, respectively) (Table 2). A dose-response relationship was found between innings pitched and pitchers with internal impingement >12 weeks after the game, such that there was a 1.4-fold increase in the percentage of pitchers with subsequent internal impingement after ≥7 innings pitched versus 1 inning pitched (Figure 2).

Percentage of pitchers with internal impingement >12 weeks after an injury game according to the number of innings pitched during the game.
Batters Faced
There were significantly more batters per game in all 4 of the injury-exposure groups when compared with the control group (P < .001 for all) (Table 1). While there were significantly fewer batters faced when comparing within-pitcher games <2 weeks before internal impingement versus baseline (P = .017), there was not a significant difference at <6 and <12 weeks when compared with baseline values (P = .579 and .963, respectively) (Table 2). There was a clear dose-response relationship between batters faced and the percentage of pitchers with internal impingement >12 weeks later, in that pitchers who faced >30 batters had a 1.8-fold increase in the likelihood of subsequent internal impingement >12 weeks later as compared with those who faced <15 batters (Figure 3).

Percentage of pitchers with internal impingement >12 weeks after an injury game according to the number of batters faced during the game.
The control group consisted of 27% starting pitchers. When compared with the control group, there were significantly more starting pitchers in each of the injury groups (P < .001 for all) (Table 3).
Comparison of Starting Pitcher Percentage Between Controls and Pitchers Who Developed Internal Impingement <2, <6, <12, and >12 Weeks After a Game a
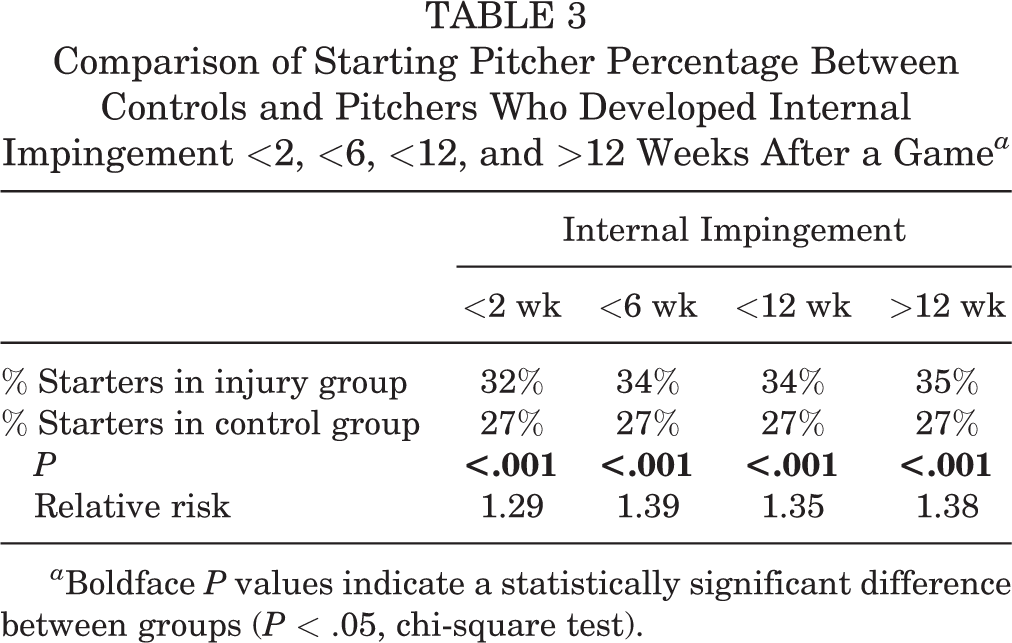
a Boldface P values indicate a statistically significant difference between groups (P < .05, chi-square test).
Discussion
Our hypotheses were confirmed, as pitchers with a higher number of innings pitched per outing (P ≤ .003), those who faced more batters per outing (P < .001), and more starting pitchers (P < .001) were diagnosed with internal impingement within 12 weeks of injury when compared with healthy controls. However, within the 624 pitchers with impingement evaluated, there were no significant differences in the numbers of innings pitched, batters faced, or days of rest in the acute workload period (<12 weeks of injury) when compared with their baseline workload. These findings overall suggest that excess workload over time is a more important risk factor than acute workload for the development of internal impingement.
Shoulder pain is an extremely common cause of pain and disability in baseball pitchers. 10 One of the most common causes of shoulder pain in these overhead athletes is internal impingement. 18,20 Internal impingement often occurs during the transition from the late cocking to the acceleration phase in the pitch cycle when the shoulder is in abduction and maximal external rotation. 15 During this motion, the undersurface of the rotator cuff may become compressed between the greater tuberosity and glenoid labrum. 5,14 Over time, this compression can lead to articular-sided rotator cuff tears. Camp et al 3 reported on all injuries that occurred in MLB players between 2011 and 2016. 3 These authors found that internal impingement was the eighth most common injury in baseball, as 1055 players were diagnosed with internal impingement and missed a combined 23,279 days because of this injury. The median number of days missed due to a diagnosis of internal impingement was 26 days. Furthermore, 65% of these injuries occurred in pitchers. As such, it is clear that internal impingement is a pervasive injury in professional baseball, and efforts to mitigate injury risk in these athletes are imperative to keep these players on the field.
The study findings indicated that increased workload was associated with an increased risk of internal impingement. In particular, in games before an internal impingement injury, pitchers faced more batters and pitched more innings than in games that were not before an internal impingement injury. However, we did not find any significant differences in workload variables between an acute increase in workload compared with baseline workload. As such, based on this study, internal impingement appears to be something that pitchers develop because of a high workload relative to other pitchers over the course of their career, and not due to an acute increase in workload. One interesting finding is that visual inspection of our data suggests that the risk of internal impingement begins to increase after 15 batters faced or 3 innings pitched per game. These findings indicate there may be a “sweet spot” for the number of innings pitched and batters faced per game where injury risk is the lowest, and this may be about 3 innings and 11 to 15 batters faced per game.
These results suggest that current pitching practices where a starting pitcher goes deep into games and relievers come in for 1 to 2 innings may not be optimal from an injury risk reduction standpoint. Our findings suggest that pitching fewer innings per game more frequently could help reduce the risk of internal impingement, although more detailed studies are needed to verify these results. This would require a major shift in the pitching rotation for most teams. Furthermore, this suggested change does not account for performance, so it is unclear if this shift would improve or hurt performance. A pilot study would therefore be worthwhile to see if these data reliably translate to the field. Should this hypothesis translate appropriately, this shift could be a step in the right direction as it pertains to injury prevention in professional baseball players.
Limitations
While the physicians, trainers, and therapists who enter information into the data sets that were used in this study take great care in entering information correctly, it is possible that there were inaccuracies during information entry as there is no imaging used to confirm this diagnosis and there can be varying levels of impingement. However, even if this did occur, it is unlikely that this would have significantly affected the results given the size of the data sets. It is possible that a pitcher could have developed internal impingement in a game before the one listed as their injury game but was able to continue pitching for 1 or more games until reporting the injury. It is also possible that different team physicians used different diagnostic criteria for impingement, and they may have included or excluded players based on their specific diagnostic criteria.
Conclusion
Our analysis revealed significantly greater pitcher workload and percentage of starting pitchers in professional baseball players diagnosed with internal impingement when compared with healthy controls. However, this injury did not seem to be associated with an acute increase in workload.
Footnotes
Acknowledgment
The authors acknowledge the Professional Baseball Athletic Trainers Society for their continued efforts in updating the Major League Baseball injury database and their care of these athletes.
Final revision submitted April 15, 2023; accepted May 3, 2023.
One or more of the authors has declared the following potential conflict of interest or source of funding: P.N.C. has received education payments from Active Medical; consulting fees from DePuy/Medical Device Business Services, DJO, and Responsive Arthroscopy; nonconsulting fees from Arthrex and DePuy; and royalties from DePuy. B.J.E. has received research support from Arthrex, DePuy, Linvatec, Smith & Nephew, and Stryker; education payments from Arthrex, Linvatec, and Smith & Nephew; consulting fees from Arthrex and DePuy; and nonconsulting fees from Arthrex. AOSSM checks author disclosures against the Open Payments Database (OPD). AOSSM has not conducted an independent investigation on the OPD and disclaims any liability or responsibility relating thereto.
Ethical approval for this study was obtained from the University of Utah (reference No. 00114699).