
Abstract
Background:
During opening-wedge, high-tibial osteotomy (OWHTO), various methods of managing the superficial medial collateral ligament (sMCL) can be performed to obtain a sufficient medial side opening.
Purpose/Hypothesis:
The purpose of this study was to evaluate the outcomes of distal sMCL release during OWHTO. It was hypothesized that distal sMCL release would not cause valgus instability.
Study Design:
Case series; Level of evidence, 4.
Methods:
This retrospective study included 77 patients who underwent OWHTO between January 1, 2018, and October 31, 2019, and completed serial radiological assessments including weightbearing line ratio (WBLR), medial proximal tibial angle (MPTA), coronal translation, total tibial plateau inclination (TTPI), valgus medial joint-space width (valgus-MJSW), valgus joint-line convergence angle (valgus-JLCA), varus lateral joint-space width (varus-LJSW), and varus joint-line convergence angle (varus-JLCA) on standing whole-leg and varus-valgus stress radiographs. Subgroup analysis of pre- to postoperative changes in radiologic parameters was performed according to TTPI (group 1: <25th percentile, group 2: 25th-75th percentile, group 3: >75th percentile) and Ahlbäck osteoarthritis classification (group 1: Ahlbäck grade 1, group 2: Ahlbäck grades 2 and 3).
Results:
The mean time to final follow-up was 34.6 ± 6.4 months. The WBLR and coronal translation did not change significantly over the follow-up period. The valgus-MJSW at 6 months postoperatively was significantly wider than that preoperatively and at 1 year postoperatively (P < .001). The varus-LJSW at 6 months postoperatively was significantly wider compared with preoperatively and 1 year postoperatively (P < .001), and the varus-LJSW at 1 year postoperatively was wider than that found preoperatively. Coronal translation was significantly more reduced for patients in TTPI group 1 versus group 3 (P = .019). There was no significant differences according to the Ahlbäck groups. All clinical outcomes improved at final follow-up compared with preoperative values (P ≤ .002).
Conclusion:
The study findings indicated that sMCL release did not cause valgus instability or valgus overcorrection at 1 year postoperatively, and improved clinical outcomes were seen at the final follow-up compared with preoperative status after OWHTO with sMCL release.
Opening-wedge high tibial osteotomy (OWHTO) is a commonly performed operation for patients with medial unicompartmental osteoarthritis with varus deformity. 19 OWHTO is a type of alignment correction surgery that shifts the load from the medial to the lateral compartment by modifying the alignment from varus to slightly valgus. 3 During the procedure, strain on the superficial medial collateral ligament (sMCL) increases because the opening is performed at the proximal portion of the distal attachment of the ligament. 16 Therefore, various methods of managing sMCL, such as keeping it left intact, subperiosteal elevation, partial or complete release, or transection, are performed at the osteotomy level to obtain a sufficient medial side opening. 1,3,4,9,18
The release of the sMCL can cause valgus instability, so it should be performed minimally. 12 In addition, patients with large latent valgus laxity or severe varus deformity require large correction that could lead to unexpected overcorrection in OWHTO. 8 Therefore, a more accurate alignment correction could be achieved by surgical planning that considers not only the alignment but also the soft tissue balance, which can be measured by the difference between preoperative lateral and medial joint space with a varus-valgus stress (VVS) radiograph. 5,11 Although the effect of sMCL release remains controversial, it is known that the medial joint opening decreases after plate fixation. 15,17
The aim of this study was to verify whether distal sMCL release would produce a negative effect on the outcome of OWHTO using a serial assessment of standing whole-leg radiographs and VVS radiographs. It was hypothesized that distal sMCL release would not cause valgus instability and OWHTO with distal sMCL release would produce improved outcomes compared with preoperative status.
Methods
Study Patients
This institutional review board-approved retrospective study included patients who underwent OWHTO between January 1, 2018, and October 31, 2019. All patients who underwent OWHTO had a diagnosis of varus medial compartmental primary osteoarthritis with hip-knee-ankle angle >5° or medial compartmental osteonecrosis. The inclusion criteria were as follows: (1) medial unicompartmental osteoarthritis and (2) genu varus deformity of the lower limb. Initially, 103 knees were identified. Knees were excluded based on the following criteria: (1) revision OWHTO (2 knees); (2) double osteotomy, including distal femoral osteotomy (1 knee); (3) simultaneous ligament reconstruction that required concomitant sagittal plane modification (2 knees); (4) displaced lateral hinge fracture (3 knees); and (5) lack of complete serial radiological (standing whole-leg and VVS radiographs) and clinical assessments (18 knees). Ultimately, 77 knees were included.
Radiologic Parameters
Standing whole-leg radiographs were taken preoperatively and at 6 weeks, 6 months, and 1 year postoperatively and used to determine the weightbearing line ratio (WBLR), medial proximal tibial angle (MPTA), total tibial plateau inclination (TTPI), and coronal translation. The WBLR was calculated from the width of the tibial plateau medial to the weightbearing line (WBL), which was drawn from the center of the femoral head to the center of the superior articular surface of the talus (Figure 1A, a) and the entire width of the tibial plateau (Figure 1A, b) (with a medial tibial edge at 0% and the lateral tibial edge at 100%). The MPTA was defined as the medial angle formed by a line of the mechanical tibial axis and a line tangent to the joint surface of the proximal tibial plateau (Figure 1B, α). The TTPI was defined as the angle between the medial tibial plateau extension line and lateral tibial plateau extension line (Figure 1B, β). 14 Coronal translation was expressed as the distance between the lines perpendicular to the ground through the most lateral margins of the lateral femoral condyle and the lateral tibial condyle; a positive value indicates that the line through the lateral tibial condyle was lateral to the line through the femoral condyle (Figure 1C). 2
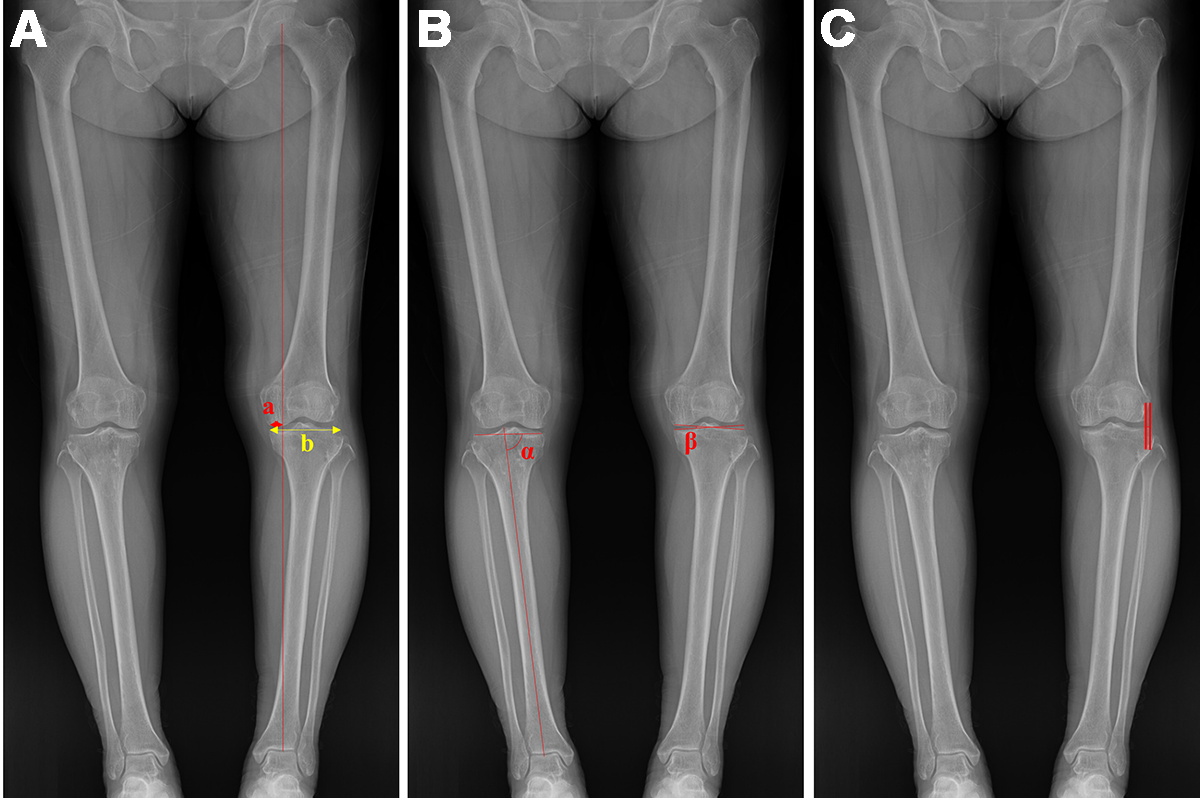
Measurements on whole-leg radiographs. (A) WBLR (a/b), calculated from the width of the tibial plateau medial to the WBL (a) and the entire width of the tibial plateau (b). (B) MPTA (α), and TTPI (β). (C) Coronal translation (distance between parallel lines). MPTA, medial proximal tibial angle; TTPI, total tibial plateau inclination; WBL, weightbearing line; WBLR, WBL ratio.
Preoperatively and at 6 months and 1 year postoperatively, patients underwent VVS radiographs using a Telos SE arthrometer (Telos) with a 6.8-kg force on a fully extended knee. The following parameters were assessed: valgus medial joint-space width (valgus-MJSW), varus lateral joint-space width (varus-LJSW), valgus joint-line convergence angle (valgus-JLCA), and varus joint-line convergence angle (varus-JLCA). Two lines connecting the distal femoral articular surfaces and the proximal tibial articular surfaces were drawn, and the length of the perpendicular line from the proximal tibial articular surface to the lowest point of the medial femoral condyle on the valgus stress radiographs was defined as the valgus-MJSW (Figure 2A, a). The varus-LJSW was measured as the length of the perpendicular line from the proximal tibial articular surface to the lowest point of the lateral femoral condyle on the varus stress radiographs (Figure 2B, b). The difference between the VVS radiographs (VVD; defined as varus-LJSW minus valgus-MJSW) was also calculated. The VVD was positive when varus-LJSW was larger than valgus-MJSW, and negative when valgus-MJSW was larger than varus-LJSW. The valgus-JLCA (Figure 2B, α) and varus-JLCA (Figure 2B, β) were defined as the angle between the lines tangential to the articular surface of the distal femur and the proximal tibia.

Measurements on (A) valgus and (B) varus stress radiographs: valgus-MJSW (a), varus-LJSW (b), valgus-JLCA (α), varus-JLCA (β). JLCA, joint-line convergence angle; LJSW, lateral joint-space width; MJSW, medial joint-space width.
Preoperative Planning of Osteotomy
Standing whole-leg radiographs were used during preoperative planning. The planned WBLR was determined according to the status of the medial compartment. The most common target WBL usually ranged between 60% and 65%. First, 3 lines from the center of the femoral head to the tibial plateau of 55%, 60%, and 65% WBL were drawn in the standing whole-leg radiograph. Second, a line was drawn from the starting point of the osteotomy (3.5 cm below the joint line) to the safe zone. The hinge point was determined at the 85% point of this osteotomy line because an incomplete osteotomy was usually performed to protect the lateral hinge. Third, a line connecting the hinge point and the center of the ankle joint was drawn. Fourth, 3 lines were drawn from the hinge point to the first 3 lines at the same length as the third line. The angles between the third and fourth lines were the correction angles. The distal portion of the osteotomy was rotated as the correction angle, and the image was saved as a Digital Image Communication in Medicine (DICOM) file. The image was retransferred to the measuring system, and the height of the opening gap defined as the preoperatively planned correction degree was measured after it was confirmed whether the WBL was crossing at the 55%, 60%, or 65% point. The target WBLR was adjusted laterally with 1% intervals up to 5% considering meniscus (complex tear, root tear, and meniscus remaining after previous meniscectomy), cartilage (degree and width of the cartilage defect), and Kellgren-Lawrence grade.
The preoperative VVS radiographs were checked and adjusted for planning. The final target of the opening gap was determined by subtracting the VVD from the correction degree, considering medial soft tissue contracture and valgus laxity. 5
Surgical Technique Focusing on Soft Tissue Management
All surgical procedures were performed by a single senior surgeon (Y.S.L.). An incision was made 1 cm anterior to the posterior medial border of the tibia in a longitudinal direction. The pes anserinus was incised with a reverse L-shape from the superior border and retracted toward the posteromedial direction. The anterior border of the sMCL was identified and mobilized from the tibial attachment. Using a periosteal elevator, the sMCL was elevated posteriorly until the posteromedial cortex was identified. Subsequently, sMCL release was advanced distally along with checking the manual VVS test. Distal sMCL release was performed until a symmetrical valgus MJSW and varus LJSW was obtained when manual varus-valgus force was applied intraoperatively (Figure 3). A biplanar osteotomy was performed, and correction was performed at the most posterior gap. The amount of correction or control of the tibial slope was adjusted to the most posterior portion of the opening gap. Fixation was performed using a locking plate that was devised for the OWHTO. Plate fixation was performed by compressing the MCL, and the pes anserinus was repaired over the plate.

Intraoperative images showing (A) the pes anserinus with a reverse L-shape incision, (B) identification of the anterior border of sMCL and mobilization from tibial attachment, (C) posterior elevation of sMCL until tibial posteromedial cortex is identified, and (D, E) checking symmetric ligament balance during sMCL release with (D) varus and (E) valgus stress. sMCL, superficial medial collateral ligament.
Postoperative Evaluation
Clinical outcomes were evaluated with the new Knee Society Score (KSS) and Western Ontario and McMaster Universities (WOMAC) scores preoperatively and at the final follow-up. These outcomes were obtained by a research assistant who was blinded to the operation through a questionnaire to patients. The new KSS was subdivided into clinical and functional scores; for both scores, a higher score on a scale of 0 to 100 indicated a better outcome. The WOMAC included pain (0-20 scale), stiffness (0-8 scale), and function (0-68 scale) scores; a lower score on the 0 to 96 scale indicated a better outcome.
The changes in radiologic parameters (WBLR, MPTA, coronal translation, valgus-MJSW, varus-LJSW, VVD, varus-JLCA, and valgus-JLCA) from preoperatively to the various postoperative time points were evaluated. All radiological measurements were performed using the Picture Archiving and Communication System digital radiographic software (INFINITT Version 5.0.9.2). Two orthopedic surgeons (S.J.S. and H.W.J.) conducted the measurements twice, with at least 10 weeks intervals. The intrarater and interrater reliabilities of the measurements were assessed with the intraclass correlation coefficient.
Statistical Analysis
Repeated-measures analysis of variance was used to evaluate the changes in radiologic parameters on standing whole-leg and VVS radiographs. A paired t test was used to compare the preoperative and final follow-up clinical outcomes.
Subgroup analysis was performed according to TTPI, in which patients were divided into 3 groups (group 1, <25th percentile; group 2, 25th-75th percentile; group 3, >75th percentile). Subgroup analysis was also performed according to Ahlbäck osteoarthritis classification, in which patients were divided into 2 groups (group 1, Ahlbäck grade 1; group 2, Ahlbäck grades 2 and 3). The 1-way analysis of variance and Student t test were used to evaluate the changes in radiologic parameters from preoperatively to 1-year postoperatively according to the TTPI and Ahlbäck groups.
Statistical significance was set at P < .05. Data were analyzed using SPSS Version 28.0 (IBM). A post hoc power analysis of the study was performed using G* Power Version 3.1.9.7 (Erdfelder Faul Buchner).
Results
The inter- and intraobserver reliabilities for the measurement of radiographic parameters indicated satisfactory agreement, with mean intraclass correlation coefficient values of 0.87 (range, 0.85-0.89) and 0.89 (range, 0.87-0.91), respectively. According to the post hoc power analysis, the statistical power of this study was 0.99, with an effect size of 0.40 (according to our result of stress radiograph), and an alpha value of 0.05. In the subgroup analysis according to TTPI and Ahlbäck classification, the statistical power was 0.48 and 0.66, respectively.
The patient characteristics and final clinical outcomes are summarized in Tables 1 and 2. The mean time to final follow-up was 34.6 ± 6.4 months. All clinical outcomes improved at the final follow-up compared with preoperative values (P ≤ .002).
Patient Characteristics a

a Values are presented as number or mean ± SD. BMI, body mass index; KSS, Knee Society Score; OA, osteoarthritis; TTPI, total tibial plateau inclination; WOMAC, Western Ontario and McMaster Universities.
Comparison of Clinical Outcomes From Preoperative to Final Follow-up a

a Values are presented as mean ± SD. P values indicate statistically significant difference between times (P < .05). KSS, Knee Society Score; WOMAC, Western Ontario and McMaster Universities.
Serial changes in radiologic parameters on standing whole-leg radiographs are summarized in Table 3. The preoperative WBLR (16.24% ± 8.05%) was significantly smaller than postoperative 6 weeks (61.35% ± 6.34%), 6 months (60.74% ± 6.27%), and 1 year (58.81% ± 7.38%) (P < .001). There were no significant differences in WBLR between the 6-week, 6-month, and 1-year postoperative images. The preoperative MPTA (83.93° ± 2.41°) was also significantly smaller than postoperative 6 weeks (92.38° ± 2.90°), 6 months (92.29° ± 2.89°), and 1 year (91.43° ± 3.03°) (P < .001), with no significant differences between 6 weeks, 6 months, and 1 year postoperatively. The preoperative coronal translation (5.98 ± 1.70 mm) was significantly larger than that at postoperative 6 weeks (4.59 ± 1.56 mm), 6 months (4.66 ± 1.55 mm), and 1 year (4.93 ± 1.58 mm) (P < .001), with no significant differences between postoperative 6 weeks, 6 months, and 1 year.
Serial Changes in Radiologic Parameters on Standing Whole-Leg Radiographs a

a Values are presented as mean ± SD. P values indicate statistically significant difference between times (P < .05). MPTA, medial proximal tibia angle; postop, postoperative; preop, preoperative; WBLR, weightbearing line ratio.
Serial changes in radiologic parameters on VVS radiographs are summarized in Table 4. The valgus-MJSW at 6 months postoperative (7.13 ± 1.32 mm) was significantly wider than preoperative (6.65 ± 1.23 mm) and postoperative 1 year (6.58 ± 1.14 mm) (P < .001). However, there were no significant differences in valgus-MJSW between preoperative and 1 year postoperatively. The varus-LJSW at 6 months postoperative (9.14 ± 1.64 mm) was significantly wider compared with preoperatively (7.49 ± 1.57 mm) and 1 year postoperatively (8.12 ± 1.42 mm) (P < .001), and the varus-LJSW at postoperative 1 year after operation was wider than the preoperative value. The VVD at 6 months (2.01 ± 1.11 mm) and 1 year (1.54 ± 1.84 mm) postoperative were larger than the preoperative period (0.84 ± 1.05 mm) (P < .001) because of more increased varus-LJSW compared with valgus-MJSW. However, there was no significant difference in VVD between 6 months and 1 year postoperatively.
The varus-JLCA at 6 months postoperative (6.92° ± 1.92°) after the operation was larger than the preoperative (5.76° ± 2.13°) and 1 year postoperative (5.78° ± 1.74°) (P < .001). There was no difference between the preoperative and 1 year postoperative in the varus-JLCA. The valgus-JLCA at 1 year postoperative (-1.11° ± 1.12°) was larger than preoperative (-2.01° ± 1.16°) and 6 months postoperative (-2.02° ± 1.56°) (P < .001). However, there was no statistical difference between preoperative and 6 months postoperative. A representative case that shows the overall change patterns of the radiologic parameters is shown in Figure 4.
Serial Changes in Radiologic Parameters on VVS Radiographs a

a Values are presented as mean ± SD. P values indicate statistically significant difference between times (P < .05). JLCA, joint-line convergence angle; LJSW, lateral joint-space width; MJSW, medial joint-space width; postop, postoperative; preop, preoperative; VVD, varus-LJSW minus valgus-MJSW; VVS, varus-valgus stress.

(A) Standing whole-leg and (B) varus-valgus stress radiographs from preoperatively to 1 year postoperatively showing the overall changes in radiologic parameters in a representative patient. JLCA, joint-line convergence angle; LJSW, lateral joint-space width; MJSW, medial joint-space width; MPTA, medial proximal tibia angle; postop, postoperative; preop, preoperative; TTPI, total tibial plateau inclination; WBLR, weightbearing line ratio.
Subgroup Analysis According to TTPI and Ahlbäck Groups
The mean TTPI was 4.90° ± 1.72°. Results of the subgroup analysis according to TTPI are summarized in Table 5. The change in coronal translation in group 1 (-1.38 ± 0.89 mm) was significantly reduced compared with group 3 (-0.48 ± 0.84 mm) (P = .019). The change in VVD in group 2 (1.18 ± 1.43 mm) was significantly larger than that in group 3 (-0.35 ± 2.94 mm) (P = .020). Other parameters were not significantly different between the groups. A representative case with a large TTPI, which shows the overall change patterns of parameters, is shown in Figure 5.
Subgroup Analysis by TTPI of Preoperative to 1-Year Postoperative Changes in Radiologic Parameters a

a Values are presented as mean ± SD. Group 1 = TTPI <25th percentile; group 2 = TTPI in 25th to 75th percentile; group 3 = TTPI >75th percentile. Boldface P values indicate statistically significant difference between groups (P < .05). JLCA, joint-line convergence angle; LJSW, lateral joint-space width; MJSW, medial joint-space width; MPTA, medial proximal tibial angle; TTPI, total tibial plateau inclination; VVD, varus-LJSW minus valgus-MJSW; WBLR, weightbearing line ratio.

(A) Standing whole-leg and (B) varus-valgus stress radiographs from preoperatively to 1 year postoperatively showing the overall changes in radiologic parameters in a representative patient with large TTPI (group 1). Despite a slight overcorrection, coronal translation was hardly reduced. JLCA, joint-line convergence angle; LJSW, lateral joint-space width; MJSW, medial joint-space width; MPTA, medial proximal tibia angle; postop, postoperative; preop, preoperative; TTPI, total tibial plateau inclination; WBLR, weightbearing line ratio.
In the subgroup analysis, according to the Ahlbäck classification, the change in the WBLR compared with the preoperative status in group 1 (39.88% ± 7.17%) was significantly smaller than that in group 2 (47.86% ± 9.23%) (P < .001). Other parameters were not significantly different between the groups (Table 6).
Subgroup Analysis by Ahlbäck Classification of Preoperative to 1-Year Postoperative Changes in Radiologic Parameters a

a Values are presented as mean ± SD. Group 1 = Ahlbäck grade 1; group 2 = Ahlbäck grades 2 and 3. Boldface P value indicates statistically significant difference between groups (P < .05). JLCA, joint-line convergence angle; LJSW, lateral joint-space width; MJSW, medial joint-space width; MPTA, medial proximal tibial angle; VVD, varus-LJSW minus valgus-MJSW; WBLR, weightbearing line ratio.
Discussion
The release of the sMCL increased the valgus-MJSW at 6 months after OWHTO; however, the increased valgus-MJSW width decreased to a level similar to preoperative values at 1 year postoperatively. The postoperative WBLR also did not change over time during the follow-up period. Thus, release of sMCL did not cause negative effects such as valgus instability or overcorrection, as verified by serial assessment of the radiologic parameters on standing whole-leg and VVS radiographs. Furthermore, postoperative clinical improvement on KSS and WOMAC scores was seen compared with preoperative values. Therefore, our hypotheses were verified in terms of the effects of sMCL release.
The effect of valgus or varus laxity after OWHTO has been addressed. 13 Kim et al 6 reported that transection of the sMCL during OWHTO did not increase valgus laxity and showed desirable clinical and radiological outcomes. Tsai et al 20 reported that the medial compartment pressure, as represented by the JLCA, continued to decrease and became stable in 3 to 6 months despite its immediate large increase postoperatively. In addition, the change in JLCA could be larger in patients with large latent valgus instability or severe varus deformity requiring a large correction, which could lead to an unexpected overcorrection in OWHTO. This implies that the postoperative JLCA change should be considered from the preoperative surgical planning. 8,10 Kim et al 7 reported that a novice surgeon could have a similar level of surgical accuracy in OWHTO to that of an expert by using the “alignment adjustment under valgus stress technique” protocol. In this study, we considered soft tissue factors by planning the target of the opening gap. We determined the target by subtracting the VVD from the correction degree.
As a serial assessment of standing whole-leg radiographs, the WBLR did not show significant differences between 6 weeks, 6 months, and 1 year postoperatively. Contrarily, the serial assessment in VVS radiographs, the valgus-MJSW that represents valgus laxity, was increased at 6 months postoperatively compared with the preoperative period. However, the valgus-MJSW decreased at 1 year postoperative compared with preoperative values. It is assumed that the healing of the released medial soft tissue can occur during the follow-up period. In addition, varus-LJSW also increased after OWHTO. This can be explained by the fact that the strained lateral soft tissue became redundant as coronal translation reduced after OWHTO. Even when the WBLR changed from varus to slight valgus alignment after the operation, the WBLR decreased minimally over time. On VVS radiographs, valgus-MJSW and varus-LJSW increased at 6 months postoperative compared with preoperative values; however, it was recovered at 1 year postoperatively.
In the subgroup analysis according to TTPI, the reduction in coronal translation decreased as TTPI increased. This implies that increased TTPI can hinder the reduction of the laterally subluxated tibia. The serial changes in the WBLR, valgus-MJSW, and varus-LJSW did not differ according to the TTPI. In the subgroup analysis according to the Ahlbäck classification, there were no significant differences except for the change in the WBLR. It is assumed that Ahlbäck grades 3 and 4 are advanced osteoarthritis that do not work well with OWHTO. Therefore, the status of the medial joint space must be evaluated to acquire proper correction.
Strengths and Limitations
There are several strengths to this study. It comprehensively analyzed the effect of sMCL release during OWHTO by the serial assessment of radiologic parameters with not only standing whole-leg but also VVS radiographs. In addition, strategies based on medial soft tissue contracture or varus laxity, represented by varus-JLCA and valgus-JLCA, were suggested. The subgroup analysis according to TTPI suggests that the lack of reduction in coronal translation should be identified from the first step of planning.
This study had some limitations. First, this study did not directly compare with a control group that did not undergo sMCL release. Therefore, it has not been established whether performing sMCL release results in better radiological or clinical outcomes than not doing it. Second, in this study, sMCL release was performed only before osteotomy, and no additional release was performed thereafter. Therefore, the different opening gaps were not estimated in the final step of the operation. Third, VVS radiographs were only taken preoperatively and 6 months and 1 year postoperatively, so we could not assess immediate postoperative status and long-term follow-up. However, VVS after immediate operation can harm patients, which made us reluctant to conduct VVS testing in that timeframe. In addition, stability after OWHTO maintains a steady status after 1 year. 17 Therefore, we did not perform VVS radiographs after 1 year. Fourth, the same method for sMCL release was performed in all cases. However, the degree of release was adjusted by checking the manual stability test during the operation.
Conclusion
The study findings indicated that sMCL release did not cause valgus instability or valgus overcorrection at 1 year postoperatively, and improved clinical outcomes were seen at final follow-up compared with preoperative status after OWHTO with sMCL release.
Footnotes
Final revision submitted April 7, 2023; accepted April 26, 2023.
One or more of the authors has declared the following potential conflict of interest or source of funding: this work was supported by the National Research Foundation of Korea (NRF) grant funded by the Korean government (MSIT; grant 2021R1A2C1092657). AOSSM checks author disclosures against the Open Payments Database (OPD). AOSSM has not conducted an independent investigation on the OPD and disclaims any liability or responsibility relating thereto.
Ethical approval for this study was obtained from Seoul National University Bundang Hospital (B-2112-727-102).