
Abstract
Background:
Despite increased recognition of coexisting tibial and talar osteochondral lesions (OCLs), the risk factors influencing clinical outcomes remain unclear.
Purpose:
To report clinical follow-up results after arthroscopic microfracture surgery in patients with OCLs of the distal tibial plafond and talus and assess possible factors affecting these clinical outcomes.
Study Design:
Case series; Level of evidence, 4.
Methods:
A total of 40 patients with coexisting talar and tibial OCLs who underwent arthroscopic microfracture surgery were included. For analysis, the study used the American Orthopaedic Foot & Ankle Society (AOFAS) scale, Karlsson-Peterson scale, and visual analog scale (VAS) for pain for clinical evaluations on the day before surgery, 12 months after surgery, and at the last follow-up. A stepwise regression model and Spearman rank correlation were used to assess possible factors affecting these clinical outcomes.
Results:
The median follow-up time was 34.5 months (interquartile range [IQR], 26.5-54 months). At the final follow-up, the cohort included 40 patients (26 men and 14 women) with a mean age of 38.8 years (range, 19-60 years). The median AOFAS score increased from 57.5 (IQR, 47-65) before surgery to 88 (IQR, 83-92.5) at the final follow-up, the median Karlsson-Peterson score increased from 48 (IQR, 38.5-67) to 82 (IQR, 76-92), and the median VAS score improved from 5 (IQR, 4-6) to 1 (IQR, 0-2). All scale scores showed significant differences between the preoperative and final follow-up evaluations (P < .001). In the stepwise regression model and Spearman rank correlation analysis, the grade of tibial OCL had a significant independent effect on the final postoperative AOFAS scores of the patients (β = –0.502, P = .001; r = –0.456, P = .003). The size of the tibial lesion also had a significant independent effect on the final postoperative Karlsson-Peterson scores of the patients (β = –0.444, P = .004; r = –0.357, P = .024).
Conclusion:
Arthroscopic microfracture treatment for coexisting talar and tibial OCLs can achieve good short- to midterm clinical outcomes. The grade and size of tibial OCLs are the main risk factors affecting the prognostic functional scores of such patients.
The ankle joint is a common site for osteochondral lesions (OCLs). Evidence in the literature suggests that the incidence of OCL of the talus varies from 16% to 63% in patients with acute and chronic ankle instability. 10,17,27,31 OCLs of the distal tibial plafond are rare compared with talar OCLs, with a reported incidence between 2.6% and 31% in different studies. 19,21,24 These lesions are causes of chronic ankle pain and are often associated with a traumatic origin, including ankle fractures or ankle sprains. 5,26 Because of the limited self-repair ability of cartilage, these lesions are rarely able to heal spontaneously and often require surgical management.
To date, the consensus and guidelines for the treatment of talar OCLs have been relatively clear, and a variety of surgical techniques, including arthroscopic debridement, transmalleolar drilling, and autologous osteochondral transplantation, have been reported. 18,25 For talar OCLs with smaller defect areas, bone marrow stimulation techniques such as arthroscopic microfracture treatment have achieved encouraging results in midterm follow-ups. 29 Further studies have found that the grade and size of injury and concurrent injury (eg, lateral ankle instability and the presence of a coexisting tibial OCL) are important predictors of postoperative function and are often used to guide further management. 7,8,20,29
The frequency with which talar and tibial OCLs co-occur was previously reported and varied from 15.8% to 45%. 13 Despite the increased recognition of tibial OCL with the increased use of ankle arthroscopy, reports on the clinical outcomes and disease progression in patients with coexisting talar and tibial OCLs remain limited to date. 11,21,24,30 The factors affecting the prognostic function of patients with talar and tibial OCLs are still unclear.
The objective of this study was to report short- to midterm clinical follow-up results after arthroscopic microfracture surgery in coexisting talar and tibial OCLs and to assess possible factors affecting these clinical outcomes. Based on previous studies of risk factors for OCLs of the talus, we hypothesized that the grade and size of tibial OCLs would be the main risk factors affecting the prognoses of patients and that arthroscopic microfracture surgery could improve the functional prognosis of coexisting talar and tibial OCLs.
Methods
Patient Enrollment
The study protocol received ethics committee approval. From January 2013 to December 2018, of the 482 patients with ankle OCLs who underwent arthroscopic surgeries performed by the same senior sports medicine surgeon (M.W.), patients with coexisting talar and tibial OCLs were selected for enrollment in the cohort. Enrollment was completed on December 28, 2018, and the last follow-up was completed during February 2021. The study inclusion and exclusion criteria are shown in Table 1, and the Strengthening the Reporting of Observational Studies in Epidemiology diagram of the patient selection process is shown in Figure 1.
Inclusion and Exclusion Criteria a
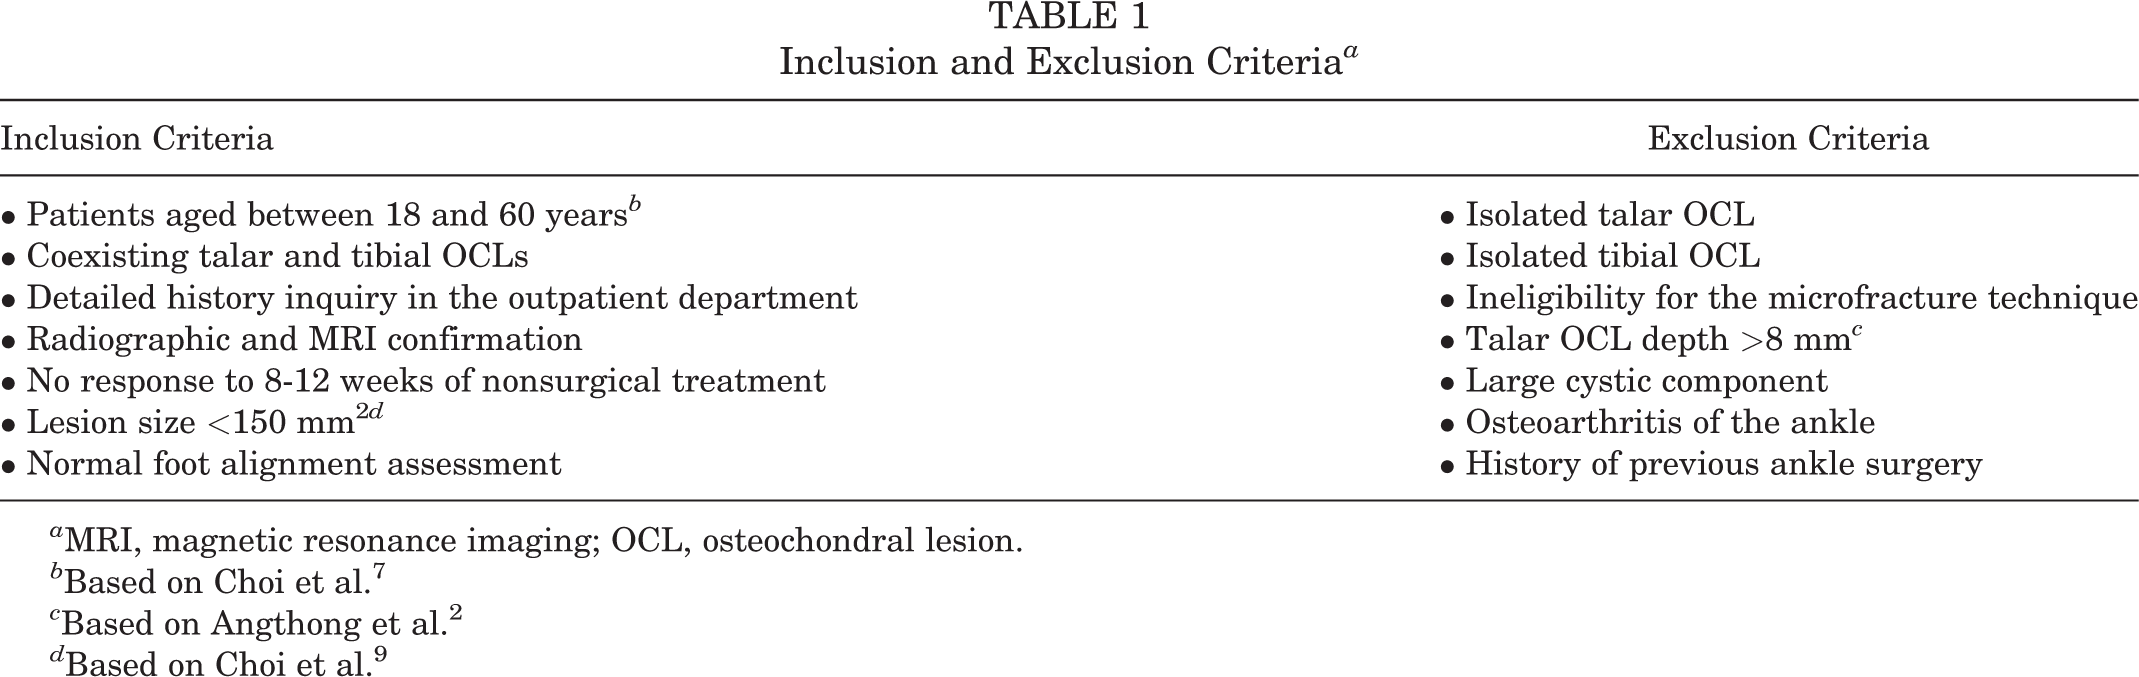
a MRI, magnetic resonance imaging; OCL, osteochondral lesion.
b Based on Choi et al. 7
c Based on Angthong et al. 2
d Based on Choi et al. 9

Strengthening the Reporting of Observational Studies in Epidemiology diagram of patient selection. OCL, osteochondral lesion.
Surgical Technique
The patient was placed in the supine position. Standard anteromedial and anterolateral portals were used for arthroscopic access, and microfracture was performed. Debridement of impingement areas, synovectomy, and loose body removal were performed as needed. The edges of the OCL were resected using a spinal curet and smoothed with a 2.9-mm resector. A curet was also used to remove any cystic lining. Microfracture was performed within the crater. The subchondral plate was breached to a depth of 4 mm, with 4 mm between each microfracture, until bleeding was visualized. The same microfracture technique was used for tibial OCLs. The actual stripped area was recorded using the method described earlier. Detailed descriptions of 2 typical cases are shown in Supplemental Material 1, available separately.
Other concomitant ligament injuries, if they existed, were also treated during the operation. Modified Broström-Gould ligament surgery was performed for patients with anterior talofibular ligament (ATFL) injury. In brief, a curvilinear incision was made in the site anterior to the lateral malleolus. The incision was extended from the anterior distal lateral malleolus to the level of the peroneal tendon. The joint capsule interval was then recognized at the anterior border of the fibula, an ankle arthrotomy was performed, and the underlying ATFL remnant was identified and exposed. Two 2.3-mm suture anchors (Smith & Nephew) were used instead of a transosseous suture. Then, the proximal extensor retinaculum was exposed and moved from the attachment to the distal fibula to make sure that the ATFL repair could be further reinforced. When the ATFL was sutured, the ankle joint was kept in neutral dorsiflexion and slight eversion for a tension-free repair. Finally, range of motion was checked once again, and an anterior drawer test and talar tilt were assessed to ensure sufficient ankle stability.
Elastic fixation with the TightRope (Arthrex) was performed for patients with a combined distal tibiofibular syndesmosis injury. A 3.5-mm hole was drilled through 4 cortices just proximal to the tibiofibular joint, with the ankle in neutral position. A guide needle with pull-through sutures was passed through the hole from the lateral side. The oblong button was flipped to rest on the medial cortex of the tibia. The sutures were tightened until the lateral button fit firmly on the cortex, or on the plate when present. Three half-hitches secured the fixation. 28
Postoperative Rehabilitation
All patients underwent standardized rehabilitation and specialist care after surgery. Rehabilitation was initiated on the first postoperative day. As with the rehabilitation methods used in our previous studies, patients were instructed to perform plantarflexion and dorsiflexion exercises and isometric exercises of ankle joint muscle strength every day. 35 All patients wore a protective brace for the first 4 weeks and then progressed to partial weightbearing for 6 weeks, with gradual removal of the brace between weeks 11 and 12. Subsequent rehabilitation was focused on balance and joint proprioception with walking, balance, and mobility training. Patients usually returned to daily activities within 4 to 6 months postoperatively. 30
Evaluation of OCLs
During arthroscopy, the talar and tibial OCLs were classified according to the Ferkel and Cheng classification 6 (Table 2). The widest point of the lesion in 2 planes was measured under arthroscopic visualization using a custom-made probe with a scale (1.0 mm), and the lesion size was calculated. Measurements were performed independently by 2 senior sports medicine surgeons (M.W. and W.Q.) and reassessed if the difference exceeded 0.5 mm until a consensus was reached. 35,36 The talar and tibial surfaces were divided into 9 zones from 1 to 9 to overlay on a 3 × 3 grid (zone 1 on the top left square and zone 9 on the bottom right square) to describe the OCL location 13,14 ; if multiple zones were involved, the center zone of the injury area or the location of a subchondral bone cyst was recorded for statistical analysis. When multiple lesion sites were noted in the tibia or talus, the location of the largest lesion was included in the analysis. 19 Kissing lesions were defined as talar and tibial OCLs found in the same region during arthroscopic exploration. 19
All patients underwent magnetic resonance imaging (MRI) (uMR570, 1.5 T; United Imaging) of the affected ankle to evaluate lesions before the operation, 6 months and 12 months after the operation, and at the last follow-up. MRI has high sensitivity and specificity in diagnosing OCLs in the ankle joint. 12,23 The scanning sequence included T1- and T2-weighted imaging with turbo spin-echo fat suppression. No special coils were used. The grade of talar OCL was evaluated on MRI according to the Hepple classification 16 (Table 2). Since no specific imaging evaluation system is currently available for tibial OCLs, we also used the Hepple classification to evaluate tibial lesions. A panel including the senior sports medicine surgeon (M.W.), sports medicine surgeon (Y.W.), and a senior radiologist not involved in this study came to a consensus for the classification of each patient.
OCL Classification During Arthroscopy and on MRI a

a MRI, magnetic resonance imaging; OCL, osteochondral lesion.
Clinical Outcomes and Evaluation
The American Orthopaedic Foot & Ankle Society (AOFAS) scale, Karlsson-Peterson scale, and visual analog scale (VAS) for pain were employed to evaluate the patients on the day before surgery, 12 months after surgery, and at the last follow-up. The scale scores were measured by 2 independent observers (J.L., Q.Q.).
Surgery-related complications included infection, unhealed OCLs, postoperative ankle stiffness, lower limb nerve injury, and deep vein thrombosis. Complications were assessed when patients returned to the outpatient department.
Statistical Analysis
Statistical analysis was performed using SPSS Version 22 (IBM Corp). Normally distributed data are presented as the mean (range), and nonnormally distributed data are expressed as the median (interquartile range [IQR]) according to the results of the Kolmogorov-Smirnov normality test. The chi-square test was used for categorical data. The Friedman M test was used to evaluate the patients’ pre- and postoperative AOFAS, Karlsson-Peterson, and VAS scores. The Student t test was used to compare the age; body mass index (BMI); lesion size; and AOFAS, Karlsson-Peterson, and VAS scores of the 2 subgroups of patients who underwent additional ligament repair with the remaining patients to avoid bias from the ligament repair procedure.
A stepwise regression model was used to examine the impact of the patient and OCL characteristics on postoperative clinical outcome scores and to determine the direction and degree of the impact. Spearman rank correlations were calculated to assess associations between independent variables. The independent variables were divided into categorical variables and continuous variables. A list of the modeled variables is shown in Table 3. P < .05 was considered statistically significant.
Independent Variables Analyzed in the Stepwise Regression Model a
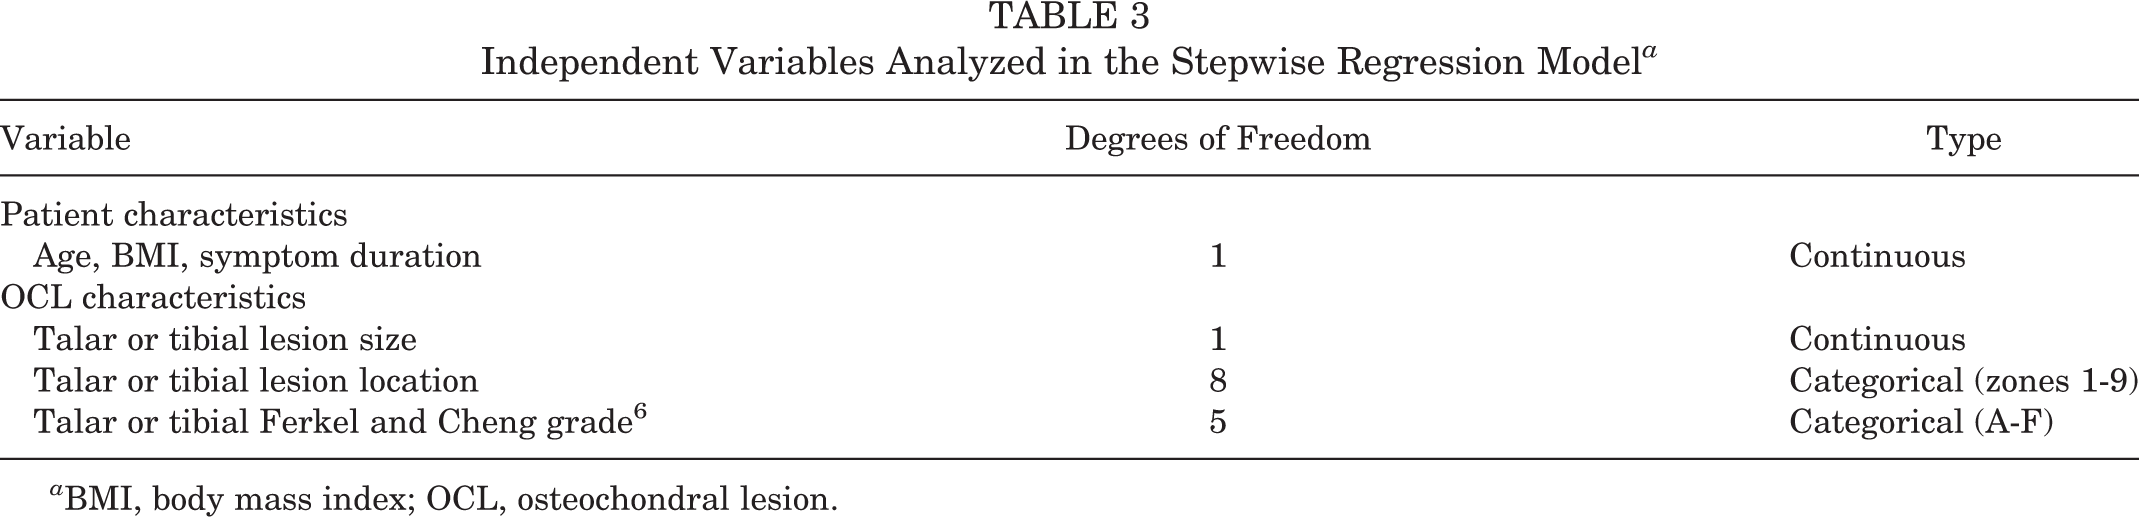
a BMI, body mass index; OCL, osteochondral lesion.
Results
Patient Evaluation and Follow-up
Of the 482 patients with ankle OCLs who underwent arthroscopic surgery, 40 patients were enrolled in this study cohort, and their basic characteristics are listed in Table 4. No patients had surgical complications such as wound nonunion, infection, superficial peroneal nerve injury, or deep vein thrombosis immediately after surgery. At the final follow-up, a 42-year-old male patient underwent a second microfracture surgery of the talus at 22 months after the operation because of gradually increasing pain during activity. No other complications were reported. All postoperative evaluations of patients were completed on the outpatient visit (by M.W., Y.W., and X.Y.). Six patients did not undergo MRI at the last follow-up for various reasons.
Baseline Characteristics of the Patients (N = 40) a

a Data are reported as mean ± SD (range) or median [interquartile range] unless otherwise indicated. BMI, body mass index.
Arthroscopic Findings
The median lesion size of the talar OCL in the 40 patients was 48.5 mm2 (IQR, 20.0-76.5 mm2), and the median size of the tibial OCL was 24.0 mm2 (IQR, 16.0-48.0 mm2). The results of the Ferkel and Cheng classification are shown in Table 5.
Classification of the Talar and Tibial Osteochondral Lesions

The distribution of the sites of the talar and tibial OCLs is shown in Figure 2. Fifteen cases (37.5%) had kissing lesions, 11 (73.3%) of which occurred in zone 4, while 2 (13.3%) occurred in zone 2 and 2 (13.3%) occurred in zone 7.
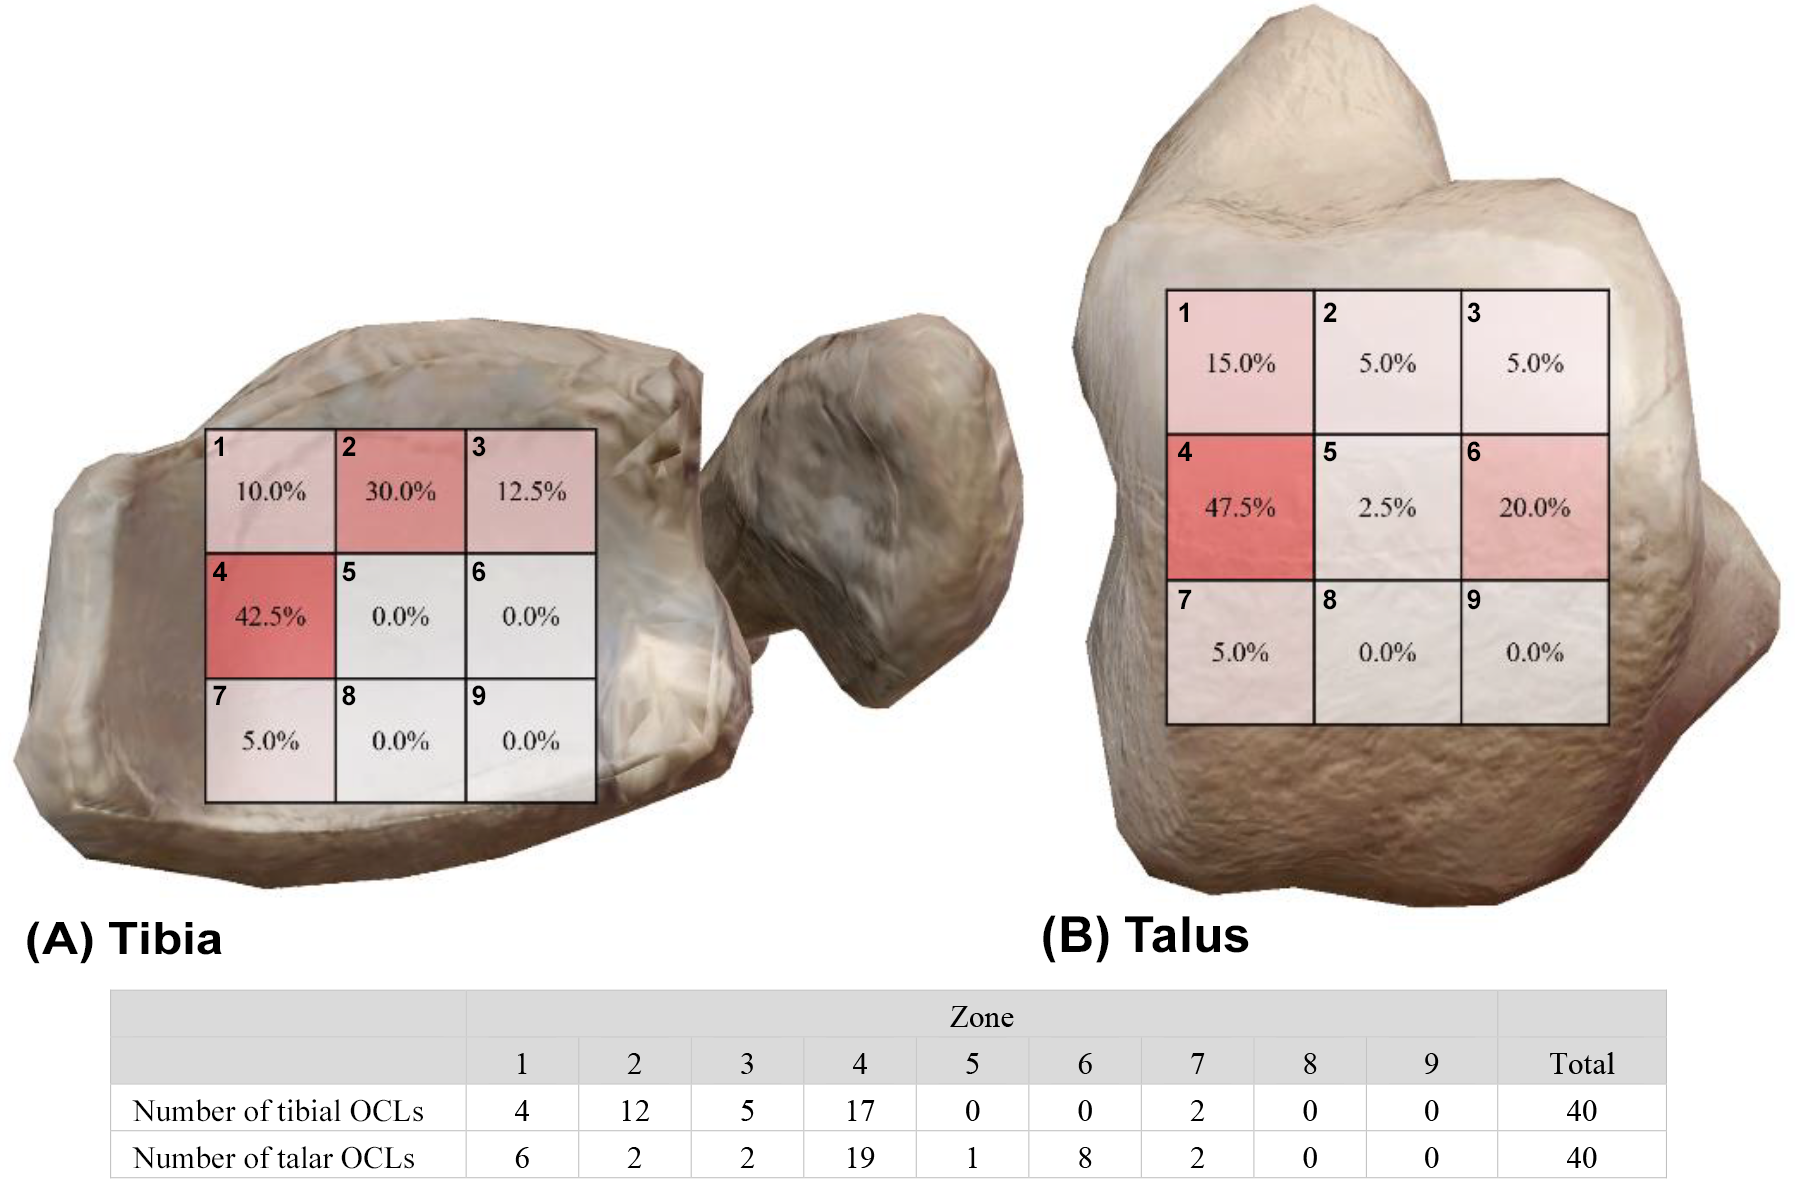
Heatmap of the locations of (A) tibial OCLs (medial view) and (B) talar OCLs (lateral view). The numbers in the grid represent the incidence of OCLs in this area, where a darker color corresponds to a higher incidence. OCL, osteochondral lesion.
A total of 38 of 40 ankles (95%) showed concomitant injuries on arthroscopic evaluations (Table 6). Of these patients, 27 patients had concomitant ligament injuries, including 23 cases of ATFL injury, 1 case of distal tibiofibular syndesmosis injury, and 3 cases of both. All injuries were treated accordingly.
Results of Concomitant Injuries in Patients a

a ATFL, anterior talofibular ligament.
MRI Evaluation Results
The classification of MRI results is shown in Table 7. Compared with preoperatively, the MRI appearance of talar OCLs was significantly improved at 6 months (χ2 = 41.46; P < .001) and 12 months (χ2 = 43.50; P < .001) after surgery. The tibial osteochondral injury's appearance was also significantly improved at 6 months (χ2 = 21.06; P < .001) and 12 months (χ2 = 28.67; P < .001) compared with the preoperative results.
Of the 40 patients, 34 (85%) had MRI results at the last follow-up, and the rest failed to undergo MRI for various reasons. At the last follow-up, the results of MRI evaluation of OCL in both the talus (χ2 = 47.44; P < .001) and the tibia (χ2 = 33.40; P < .001) were significantly different from the preoperative results. Also, there was no statistical difference between the MRI results for tibial and talar OCLs (χ2 = 0.476; P = .924).
MRI Results of the Patients by the Hepple Staging Systema
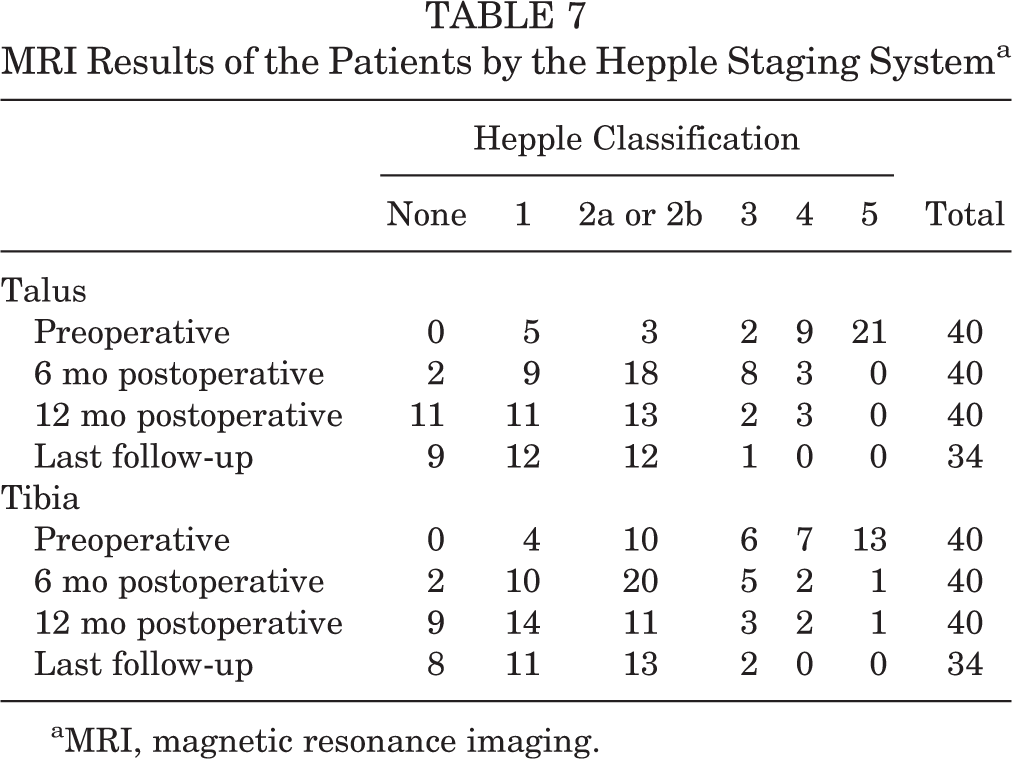
aMRI, magnetic resonance imaging.
Clinical Outcomes
Compared with the preoperative scores, the median AOFAS and Karlsson-Peterson scores were significantly improved at the last follow-up. Significant differences were also found in the AOFAS and Karlsson-Peterson scores of the patients before the operation, 12 months after the operation, and at the last follow-up at each time point (Table 8). The median VAS score improved from 5 (IQR, 4-6) before surgery to 1 (IQR, 0-2) at the last follow-up. The median VAS scores at 12 months after surgery were statistically different from the preoperative scores (P < .001) but were not statistically different from the scores at the last follow-up (P = .108).
Clinical Results a

a Data are reported as median [interquartile range]. Bolded P values indicate a statistically significant difference (P < .05). AOFAS, American Orthopaedic Foot & Ankle Society; postop, postoperative; preop, preoperative; VAS, visual analog scale.
In the stepwise regression, the grade of tibial OCLs was a significant independent variable influencing the final postoperative AOFAS scores, showing a negative correlation (B = –3.439; P = .001). The size of tibial lesions was also a significant independent variable that negatively affected the final postoperative Karlsson-Peterson score (B = –14.132; P = .004) (Table 9). Other variables were not significant in either score, such as age, BMI, duration of symptoms, and location of OCL.
Stepwise Regression Results of the AOFAS and Karlsson-Peterson Scales a
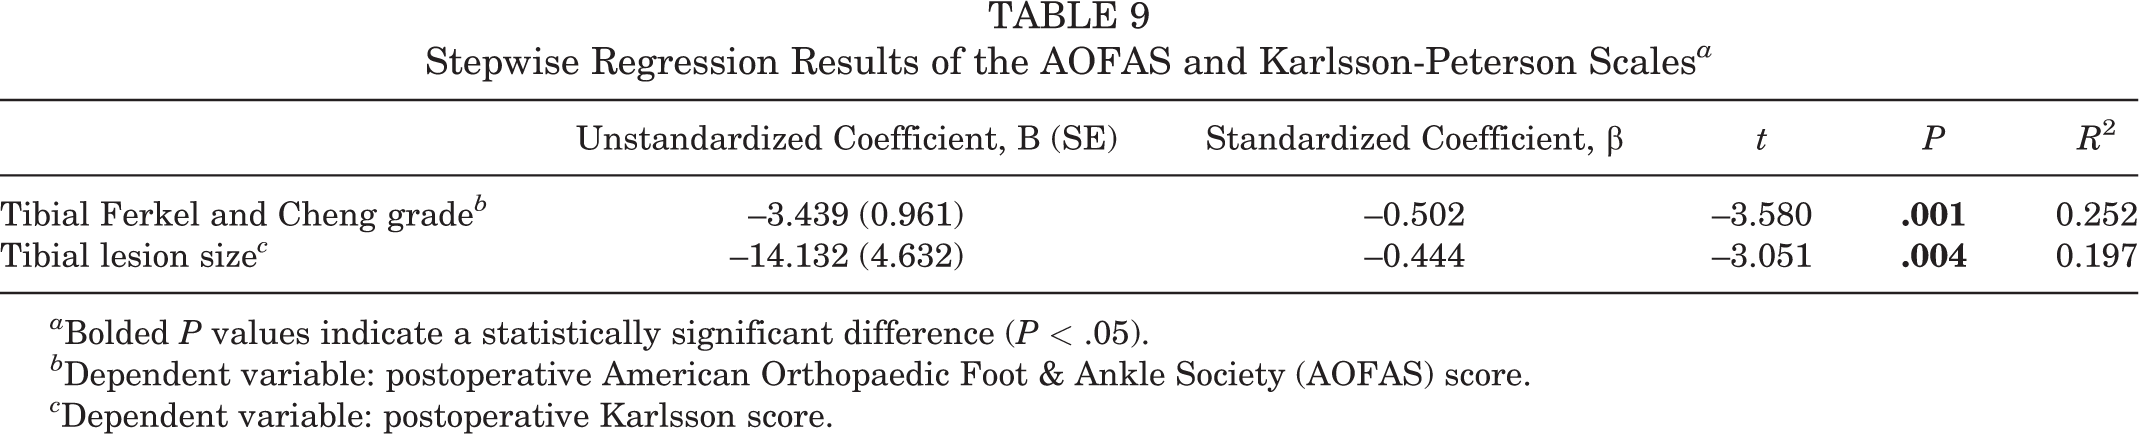
a Bolded P values indicate a statistically significant difference (P < .05).
b Dependent variable: postoperative American Orthopaedic Foot & Ankle Society (AOFAS) score.
c Dependent variable: postoperative Karlsson score.
In the Spearman rank correlation analysis, the classification of tibial OCLs was negatively correlated with the postoperative AOFAS scores (r = –0.456; P = .003), and the size of the tibial lesions was negatively correlated with the postoperative Karlsson-Peterson scores (r = –0.357; P = .024). Other independent variables including age, BMI, duration of symptoms, and size and location of talar OCLs were not significantly associated with the postoperative scores on either scale (P > .05). The detailed statistical results are listed in Supplemental Material 2.
Considering previous studies suggesting that additional ankle pathologies such as instability and trauma may affect the incidence, natural history, or treatment outcomes of tibial OCL, 1 we used additional ligament repair surgery as a stratification criterion and tested for homogeneity between the 2 subgroups. Student t test results showed that there were no significant differences in all characteristics between the 2 subgroups (Table 10).
Characteristics and Clinical Scores Between Subgroups a

a Data are reported as mean ± SD. AOFAS, American Orthopaedic Foot & Ankle Society; BMI, body mass index; postop, postoperative; preop, preoperative; VAS, visual analog scale.
Discussion
The main finding of this study is that microfracture treatment of coexisting talar and tibial OCLs was associated with significant improvements in AOFAS, Karlsson-Peterson, and VAS pain scores and achieves satisfactory results at short- to midterm follow-up. The grade and size of the tibial OCL are the main risk factors affecting the patients’ functional scores with this type of injury, and these results verified our hypotheses.
In our study, the highest frequency of talar OCLs occurred in zone 4 (47.5%), which is consistent with previous studies. The zonal incidence of tibial OCL varies widely among researchers. Cuttica et al 11 reported that 30.8% (4/13) of injuries occurred in zone 3, and Elias et al 13 (21%; 8/38) and Ross et al 30 (22.6%; 7/31) reported the most frequent site of occurrence to be in zone 4. Others indicated that tibial OCLs were most common in zones 2, 4, and 5 (19.2; 5/26 in each zone) 19 or zones 1, 2, and 3 (18.75%; 3/16 in each zone). 21 Our study found that zone 4 was the region with the highest incidence of tibial OCL (42.5%; 17/40), followed by zone 2 (30.0%; 12/40). In general, the location of tibial OCL reported in different studies remains relatively variable, which may be related to the rarity of this lesion, with the research involving tibial OCL often including cases ranging from a few to dozens of cases.
The design of each study varied. Some studies were based on patients’ MRI results, some were based on the surgeon’s intraoperative arthroscopic exploration, while others combined both. Considering the inherent heterogeneity of the studies and because the size of a lesion measured by MRI cannot accurately reflect arthroscopic measurement results for talar OCL, 36 transverse comparisons among studies are difficult. Although the origin of OCLs is not yet clear, the correlation between trauma and ankle instability and the occurrence of OCLs is widely recognized. 27,34 With rupture of the lateral ankle ligament, patients may experience impingement between the medial malleolus and the medial talar facet joints and may have different wear patterns on the medial and lateral sides of the talus because the talus is in a subluxated position during movement. 32 –34 Additionally, the anterior and posterior regions of the lateral and medial positions of the tibia were 18% to 37% harder than the corresponding sites in the talus, and the cartilage on the site corresponding to zone 4 of the tibia was softer. 3 Therefore, these factors are potentially responsible for the high incidence of OCLs in tibial zone 4.
In this study, the microfracture technique demonstrated satisfactory clinical results for the treatment of talar and tibial OCLs. Similar clinical efficacy was also reported by Mologne and Ferkel, 24 Ross et al, 30 Cuttica et al, 11 and Irwin et al. 19 A notable feature of this study was that we analyzed the impacts of various factors on clinical outcomes of this type of lesion, including the characteristics of patients and OCLs. We found that the grade and size of tibial OCL were the main negative factors affecting AOFAS and Karlsson-Peterson scores. This finding is similar to previous findings regarding talar OCL 20,29 and may suggest that lesion size and severity affect the outcome after surgical repair.
In a second-look study of talar OCL, the mean AOFAS score differed significantly between patients in Ferkel and Cheng stages A to C and patients in stage D, and the mean AOFAS score had a strong correlation with grading results. 20 The size of talar OCL has also been widely studied and recognized to be a predictor of clinical outcomes after bone marrow stimulation. Previous studies suggested that microfracture surgery is applicable for talar lesions with an area <150 mm2, 9 and recent studies adjusted the ideal size of the lesion area to <100 mm2 or <10 mm in diameter. 15,29 Because of the lack of evidence in the literature, no similar treatment guidelines or consensus regarding tibial OCL is currently available. Ross et al 30 and Irwin et al 19 suggested no significant correlation between lesion area and functional score improvement. We speculated that 2 factors may cause this difference between their results and ours. First, our sample size was comparatively larger. Second, the lesion size included in our study was relatively small (the median areas of the talar and tibial injuries were 48.5 and 24.0 mm2, respectively), which allowed all our patients to undergo microfracture techniques and may avoid the potential impact of different surgical techniques on functional outcomes noted in previous studies. In addition, from a histological perspective, mineralized bone, bone marrow, and periosteum are innervated by unmyelinated and myelinated nerve fibers. A higher metabolic rate and degree of vascularization in an area of mineralized bone correspond to a higher density of sensory and sympathetic fibers. 22,34 The blood supply and the distribution of nerve fibers in the distal tibia are markedly greater than those in the talar dome, 34 which may explain our findings: in patients with coexisting lesions, the grade and size of tibial OCL have a greater impact than the grade and size of the talar OCL on functional scores. Based on these findings, we recommend that the tibial side warrants close attention to achieve good postoperative functional results in patients with coexisting tibial and talar OCLs.
Limitations
The present study, although carefully designed and thoroughly documented, still has limitations. First, our study was retrospective and included only patients who underwent surgeries, which presents some selection bias; also, the relatively small size of the OCLs and the relatively short follow-up period of the patients included in our study limit the generalizability of the current conclusions. Furthermore, patients with good postoperative healing after surgical treatment are less likely to undergo second-look arthroscopic exploration, which precluded us from visually evaluating cartilage healing, but we obtained as many postoperative MRI scans as possible to evaluate postoperative healing, partially compensating for our limitations. Notably, 38 patients (95%) had concomitant injuries including soft tissue impingement, ATFL injury, syndesmosis widening, and osteophyte formation in our study, and these patients received additional treatment, which may have caused systematic errors. Although some researchers believe that the presence of arthrosis does not affect the improvement rate of AOFAS scores in tibial OCL, 4 these concomitant injuries in coexisting talar and tibial OCLs are still rarely studied. Thus, we compared the additional ligament surgery subgroup and the nonligament surgery subgroup to minimize bias. Despite these limitations, this study reveals the risk factors for postoperative function in patients with concurrent talar and tibial OCLs, and the completeness of these detailed data may support future studies for the development of consensus or guidelines for the treatment of tibial OCLs.
Conclusion
Arthroscopic microfracture treatment of concurrent talar and tibial OCLs can achieve good short- to midterm clinical outcomes. The grade and size of tibial OCLs are the main risk factors affecting the functional scores of such patients.
Supplemental material for this article is available at https://journals.sagepub.com/doi/full/10.1177/23259671231172977#supplementary-materials.
Supplemental Material
Supplemental Material, sj-pdf-1-ojs-10.1177_23259671231172977 - Clinical Outcomes After Arthroscopic Microfracture Treatment of Coexisting Talar and Tibial Osteochondral Lesions
Supplemental Material, sj-pdf-1-ojs-10.1177_23259671231172977 for Clinical Outcomes After Arthroscopic Microfracture Treatment of Coexisting Talar and Tibial Osteochondral Lesions by Yu Wei, Xing Yun, Jianing Song, Wei Qi, Jia Li, Yujie Liu, Qi Quan and Min Wei in Orthopaedic Journal of Sports Medicine
Footnotes
Acknowledgment
The first author, Y.W., would like to thank Ruyi, the family cat, for providing moments of tranquility that have allowed him to conduct research over the past 3 years. The corresponding author, Q.Q., would like to thank the coffee shop on the corner.
Final revision submitted February 10, 2023; accepted February 26, 2023.
The authors declared that they have no conflicts of interest in the authorship and publication of this contribution. AOSSM checks author disclosures against the Open Payments Database (OPD). AOSSM has not conducted an independent investigation on the OPD and disclaims any liability or responsibility relating thereto.
Ethical approval for this study was obtained from the Chinese People’s Liberation Army General Hospital (study ID S2020-185-01).
References
Supplementary Material
Please find the following supplemental material available below.
For Open Access articles published under a Creative Commons License, all supplemental material carries the same license as the article it is associated with.
For non-Open Access articles published, all supplemental material carries a non-exclusive license, and permission requests for re-use of supplemental material or any part of supplemental material shall be sent directly to the copyright owner as specified in the copyright notice associated with the article.