
Abstract
Background:
An appropriate tunnel position, tunnel angle, and tunnel-graft angle are important factors for maintaining the stability and mechanical properties of a posterior cruciate ligament (PCL) graft.
Purpose:
To evaluate the association between tunnel position, tunnel angle, graft signal intensity ratio (SIR), and graft thickness after remnant-preserving PCL reconstruction.
Study Design:
Cross-sectional study; Level of evidence, 3.
Methods:
Included were patients who had undergone remnant-preserving single-bundle PCL reconstruction using a tibialis anterior allograft between March 2014 and September 2020 and who had minimum 12-month postoperative magnetic resonance imaging scans. Tunnel position and angle were evaluated via 3-dimensional computed tomography, and their association with graft SIR on both the femoral and the tibial sides was determined. Graft thickness and SIR at 3 areas of the graft were evaluated and compared, and their association with tunnel-graft angle was also determined.
Results:
Overall, 50 knees (50 patients; 43 male, 7 female) were included. The mean time to postoperative magnetic resonance imaging was 25.8 ± 15.8 months. The mean SIR of the graft’s midportion was higher compared with that of the proximal and distal portions (P = .028 and P < .001, respectively), and the SIR of the proximal portion was higher compared with that of the distal portion (P = .002). The femoral tunnel-graft angle was more acute than the tibial tunnel-graft angle (P = .004). A more anteriorly and distally located femoral tunnel led to a less acute femoral tunnel-graft angle (P = .005) and a decreased SIR of the proximal portion (P = .040), and a more laterally located tibial tunnel was associated with a less acute tibial tunnel-graft angle (P = .024) and a reduced SIR of the distal portion (P = .044). The mean thicknesses of the graft’s midportion and distal portion were larger than that of the proximal portion (P < .001). The SIR of the graft’s midportion was positively correlated with its thickness (r = 0.321; P = .023).
Conclusion:
The SIR of the proximal portion of the graft around the femoral tunnel was higher than that of the distal portion around the tibial tunnel. An anteriorly and distally positioned femoral tunnel and a laterally positioned tibial tunnel resulted in less acute tunnel-graft angles that were associated with decreased signal intensity.
Most studies on posterior cruciate ligament (PCL) reconstruction (PCLR) have reported concerns such as residual laxity and lower activity levels than before the injury.14,23,29 Proper tunnel positioning has been proposed to improve stability and clinical outcomes and to overcome these inferior outcomes.21,27 The proper placement of the tibial tunnel is also important because its location can directly affect stability. 7
An acute angle between a PCL graft and a tunnel may result in increased shear stress, internal graft pressure, and early graft failure. 8 In comparison with anterior cruciate ligament reconstruction, the PCL graft takes sharp turns when it exits the tibial and femoral tunnels. 14 This acute angle of the graft at the tunnel exit, called the “killer turn,” is considered a possible cause of PCL graft failure.29,30
As a noninvasive tool, magnetic resonance imaging (MRI) plays a crucial role in evaluating reconstructed grafts and monitoring the graft status after cruciate ligament reconstruction.5,22 Graft signal intensity has been described as a critical marker of graft healing and maturation. 3 High signal intensity on MRI likely indicates a decrease in the mechanical properties of a reconstructed graft.17,20
Therefore, this study was performed to evaluate the effect of tunnel position and angle on graft signal intensity in remnant-preserving PCLR. We hypothesized that the tunnel position and angle on the tibial side would affect signal intensity to a greater extent than those on the femoral side.
Methods
Patient Selection
A total of 104 consecutive patients who underwent PCLR from March 2014 to September 2020 were enrolled in this retrospective study. All operative procedures were performed by a senior surgeon (Y.S.L.) using the arthroscopic transtibial PCLR approach. Patients who were diagnosed with a PCL injury, underwent remnant-preserving PCLR or combined PCL–posterolateral corner sling (PLCS) reconstruction, and underwent MRI ≥1 year after surgery were included. The exclusion criteria were as follows: (1) peri-knee fracture or osteotomy (11 cases), (2) anterior cruciate ligament reconstruction (12 cases), (3) revision PCLR (5 cases), and (4) no postoperative MRI (26 cases). Ultimately, 50 patients were included in this retrospective analysis (Figure 1). This study was approved by our institutional review board, and the requirements for informed consent were waived, considering the retrospective study design and the use of anonymized data.

Flowchart of patient enrollment. ACLR, anterior cruciate ligament reconstruction; MRI, magnetic resonance imaging; PCL, posterior cruciate ligament; PCLR, PCL reconstruction.
Surgical Technique
A routine arthroscopic examination was performed using standard anteromedial and anterolateral portals. Posteromedial and posterolateral portals were also established for observation of and approach to the posterior compartment. The posteromedial and posterolateral compartments were connected through a trans-septal portal. A 1-cm longitudinal skin incision was made medial to the tibial tuberosity, and a guide sleeve was inserted. A drill guide (RetroConstruction Drill Guide Set; Arthrex) was oriented at 50° to the tibia and inserted via the anteromedial portal. The PCL fovea landmark technique was used with the trans-septal portal, and retrograde reaming was performed using a FlipCutter drill (Arthrex). For the femoral tunnel, an arthroscope was introduced from the anterolateral portal, and a PCL femoral guide (RetroConstruction Drill Guide Set) was introduced through the anteromedial portal. It was placed at the site of the PCL remnant on the medial femoral condyle, and a longitudinal skin incision was made along the medial border of the vastus medialis muscle at the level of the patella’s superior pole. After soft tissue was dissected, the entrance to the tunnel was marked on the medial femoral cortex without removing the remnant PCL. The tip was positioned 5 or 6 mm proximal to the distal border of the articular cartilage of the medial femoral condyle, which was at the 1-o’clock position in the right knee and at the 11-o’clock position in the left knee. Outside-in femoral drilling was performed. For the graft material, a looped tibialis anterior tendon was used as an allograft (9- or 10-mm diameter). The looped end of the graft was passed through the femoral tunnel, advanced through the space between the remnant PCL and medial femoral condyle, and then passed into the tibial socket posterior to the remnant PCL (Figure 2).

(A) Preparation of a tibialis anterior tendon allograft for posterior cruciate ligament (PCL) reconstruction. (B) As viewed from the anterolateral portal in a right knee, the femoral graft (asterisk) is located inside remnant PCL tissue. (C) As viewed from the posteromedial portal in a right knee, the tibial graft (asterisk) is positioned over remnant PCL tissue.
After passing the graft, tibial suspensory fixation was performed using TightRope RT (Arthrex). The graft was tensioned manually on the femoral side. As tension was being applied to the graft, the knee was positioned at 90° of flexion. Then, the graft was fixed on the femoral side with an interference screw (BioComposite screw; Arthrex), and post-tie augmentation was performed using a spiked washer and screw.
Evaluation of Tunnel Position and Angle Via Computed Tomography
Femoral and tibial tunnel positions were analyzed using 3-dimensional (3D) computed tomography (CT) (SOMATOM Definition [Siemens] or MX8000, Brilliance 64, or Brilliance iCT [Philips]). The CT protocol involved a tube voltage of 120 kV, tube current of 200 mAs, slice thickness of 3 mm, and standard resolution. 3D CT was conducted on the day after surgery. Using INFINITT software (Version 5.0.9.2; INFINITT), 2 orthopaedic fellows not involved in the surgical procedures (S.Y.P. and H.S.N.) made measurements at 2 separate time points, 6 weeks apart. Coronal reconstructions were performed parallel to the line joining the posterior femoral condyle, whereas sagittal reconstructions were conducted parallel to the lateral femoral condyle. Then, 3D surface models were produced using Somaris/7 syngo CT 2008G (syngo CT Workplace version VA20A; Siemens).
The quadrant method was used to localize the position of the femoral tunnel. 6 The femoral tunnel position was evaluated on the lateral wall of the medial femoral condyle via 3D CT. A rectangular frame was applied to the 3D CT image of the medial femoral condyle by placing the superior border at the intercondylar notch roof (Figure 3A). The x-axis was aligned along the Blumensaat line. The inferior border of this rectangle was a line tangential to the distal subchondral bone contour of the condyle. The y-axis was perpendicular to the x-axis. The location of the femoral tunnel was expressed as a percentage from the center of the tunnel to the deepest subchondral bone contour (x-axis) and the intercondylar notch roof (y-axis). An increase in the x-axis meant that the femoral tunnel was located more distally and anteriorly, and an increase in the y-axis meant that the femoral tunnel was located more distally and posteriorly.

(A) The total sagittal diameter of the medial femoral condyle was measured along the Blumensaat line, the height of the intercondylar notch was measured from the Blumensaat line to a line tangent to the distal subchondral bone contour of the condyle, and the location of the femoral tunnel was expressed as a percentage from the center of the tunnel (0%) to the deepest subchondral bone contour (x-axis) and the intercondylar notch roof (y-axis). (B-D) The tibial tunnel position. The sagittal distance was measured as the ratio of the (B) distance between the center of the tibial tunnel aperture and the posterior edge of the PCL fovea (S) to the (C) distance between the posterior border of the tibial spine and the posterior edge of the posterior cruciate ligament (PCL) fovea (TS). The coronal distance was measured as the ratio of the (D) distance between the center of the tibial tunnel aperture and the medial edge of the PCL fovea (C) to the (E) distance between the lateral edge and the medial edge of the PCL fovea (TC).
The tibial tunnel position was evaluated using 2 parameters 15 : (1) S/TS, where “S” is the sagittal tibial tunnel distance (measured from the center of the tibial tunnel aperture to the posterior edge of the PCL fovea) and “TS” is the total sagittal distance (measured from the posterior border of the tibial spine to the posterior edge of the PCL fovea) (Figure 3, B and C), and (2) C/TC, where “C” is the coronal tibial tunnel distance (measured from the center of the tibial tunnel aperture to the medial edge of the PCL fovea) and “TC” is the total coronal distance (measured along the coronal dimension of the PCL fovea from medial to lateral) (Figure 3, D and E).
Subsequently, digital imaging and communications in medicine data were extracted from the INFINITT picture archiving and communication system and imported into OsiriX (Version 3.8; http://www.osirix-viewer.com). The imported MRI base image was transformed into an arbitrary plane aligned with the tunnel direction using a 3D multiplanar reconstruction tool. The femoral coronal angle was measured from the oblique coronal plane that was accurately realigned parallel to the femoral tunnel axis supported by sagittal imaging. The femoral coronal angle consisted of a line connecting the knee joint line and the axis of the tunnel in the oblique coronal plane (Figure 4A). The femoral sagittal angle was measured from the oblique sagittal plane that was accurately realigned parallel to the femoral tunnel axis supported by axial imaging. The femoral sagittal angle consisted of a line perpendicular to the femoral axis and the axis of the femoral tunnel in the oblique sagittal plane (Figure 4B).
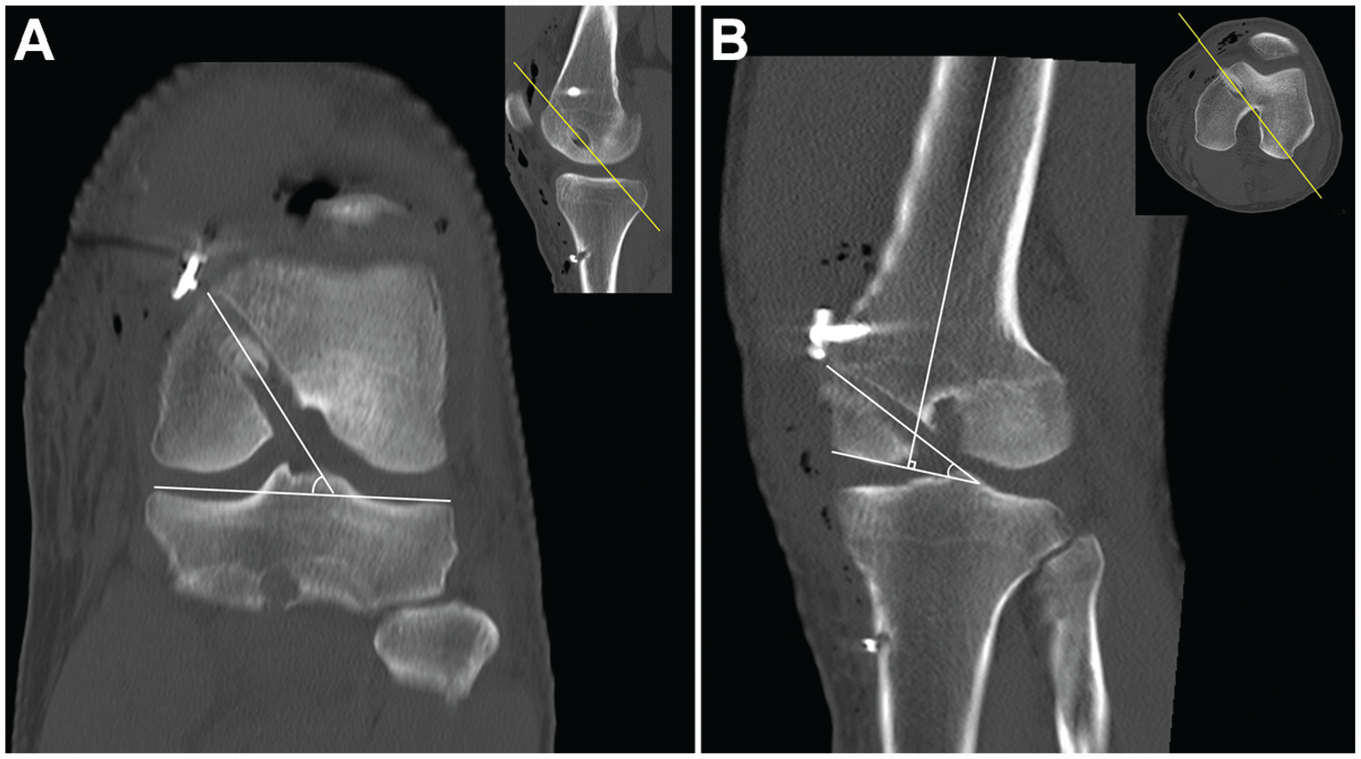
(A) The femoral coronal angle consisted of a line connecting the knee joint line and the axis of the tunnel in the oblique coronal plane. (B) The femoral sagittal angle consisted of a line perpendicular to the femoral axis and the axis of the femoral tunnel in the oblique sagittal plane.
The tibial coronal angle was measured from the oblique coronal plane that was accurately realigned parallel to the tibial tunnel axis supported by sagittal imaging. The tibial coronal angle consisted of a line connecting the tibial plateau and the axis of the tunnel (Figure 5A). The tibial sagittal angle was measured from the oblique sagittal plane that was accurately realigned parallel to the tibial tunnel axis supported by axial imaging. The tibial sagittal angle consisted of a line perpendicular to the tibial axis and the axis of the tunnel (Figure 5B).
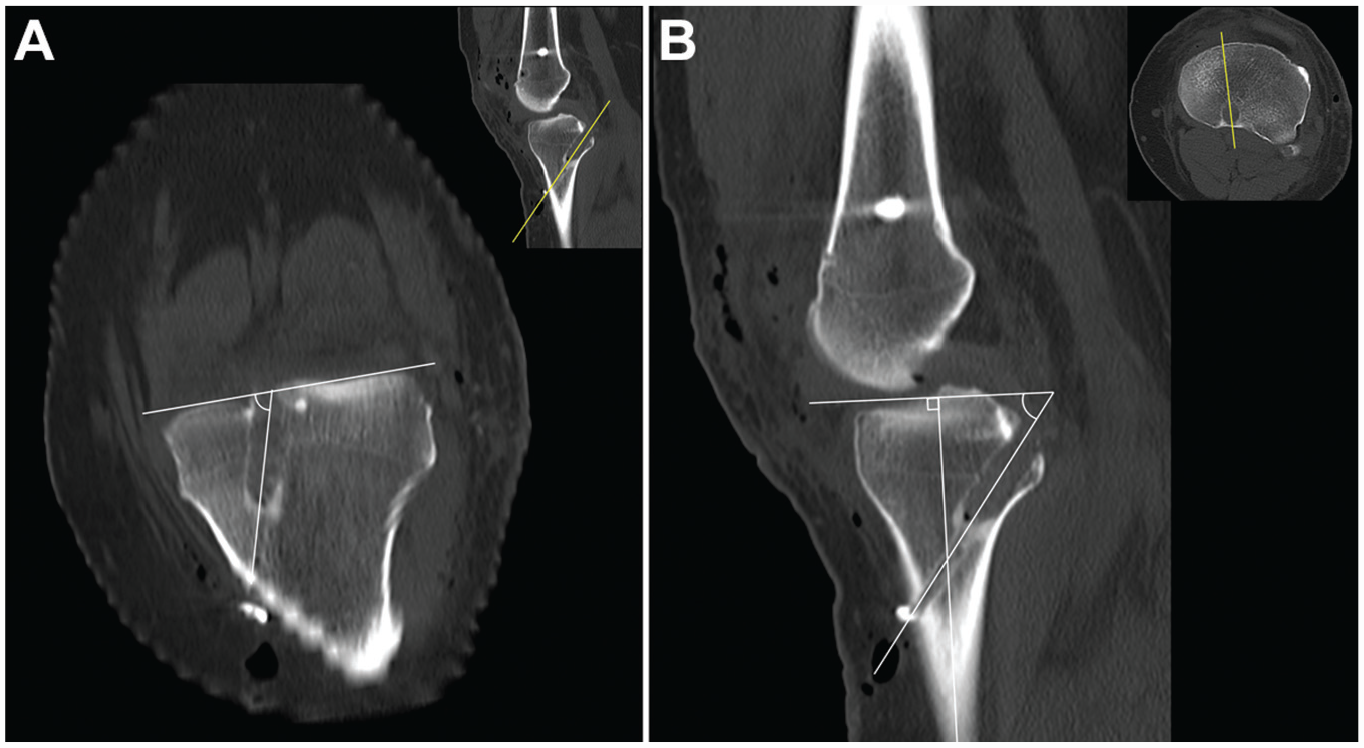
(A) The tibial coronal angle consisted of a line connecting the tibial plateau and the axis of the tunnel in the oblique coronal plane. (B) The tibial sagittal angle consisted of a line perpendicular to the tibial axis and the axis of the tunnel in the oblique sagittal plane.
Evaluation of Signal Intensity, Graft Angle, and Graft Thickness Via MRI
Postoperative MRI scans were obtained using a 3.0-T magnetic resonance scanner (Achieva; Philips) with a dedicated knee coil. MRI was performed in the standardized position, with the affected knee fixed with an immobilizing device and the lower limb fully extended and neutrally rotated in a supine position. The MRI protocol included coronal, sagittal, and axial sequences. Each sequence included T1-, T2-, and proton density–weighted images with or without fat suppression. The mean time to postoperative MRI was 25.8 ± 15.8 months.
Signal intensity was evaluated by obtaining measurements in 7 regions of interest with 0.05-cm2 circular markings on the sagittal image: (1) femoral aperture (FA), (2) middle of the proximal graft (MP), (3) distal to the proximal graft (DP), (4) proximal to the distal graft (PD), (5) middle of the distal graft (MD), (6) tibial aperture (TA), and (7) quadriceps tendon at 1 cm proximal to the patella (Figure 6).

Signal intensity was measured in 7 regions of interest with 0.05-cm2 markings (white circles) on the sagittal image: (1) femoral aperture (FA), (2) middle of the proximal graft (MP), (3) distal to the proximal graft (DP), (4) proximal to the distal graft (PD), (5) middle of the distal graft (MD), (6) tibial aperture (TA), and (7) quadriceps tendon at 1 cm proximal to the patella (white dotted circle).
The signal intensity ratio (SIR) was calculated for each graft region by using the following formula to quantify the normalized signal intensity of the PCL graft: SIR = Signalpcl/Signalquadriceps.18,19,26 Quadriceps signal measurements were made at 1 cm from the base of the patella, which was arbitrarily determined to normalization. Graft thickness was measured by the length of a line perpendicular to the direction of each graft at FA, MP, DP, PD, MD, and TA. The variables of SIR and graft thickness were simplified to the mean values of the 2 points for the proximal portion, midportion, and distal portion of the graft. The proximal portion was defined as the mean value of FA and MP, the midportion of the graft was defined as the mean value of DP and PD, and the distal portion was defined as the mean value of MD and TA.
The tunnel-graft angles were measured from the oblique sagittal plane that were realigned parallel to the femoral and tibial tunnel directions, and the centers of the extra- and intra-articular apertures of the femoral and tibial tunnels were shown using OsiriX: (1) the femoral tunnel-graft angle (Af-Proximal) between the central axis of the femoral tunnel and the proximal portion of the graft and (2) the tibial tunnel-graft angle (At-Distal) between the central axis of the tibial tunnel and the distal portion of the graft (Figure 7).2,28

The femoral tunnel-graft angle (Af-Proximal) consisted of a line between the central axis of the femoral tunnel and the axis of the proximal portion in the oblique sagittal plane, and the tibial tunnel-graft angle (At-Distal) consisted of a line between the central axis of the tibial tunnel and the axis of the distal portion in the oblique sagittal plane.
Clinical and Stability Evaluations
For the clinical evaluation, the subjective and objective scores of the International Knee Documentation Committee (IKDC) and the Lysholm score were obtained preoperatively and postoperatively. For the stability evaluation, the side-to-side difference was examined using Telos stress radiography (Telos) with the knee at 90° of flexion and exposed to 150-N posterior stress. From the reference line on the medial tibial plateau, perpendicular lines were drawn tangentially to the midpoint between the posterior contour of the medial and lateral femoral condyles and tibial condyles. The distance between these 2 points was then measured (middle-middle method). 13
Statistical Analysis
Data were statistically analyzed using the SPSS statistical package (Version 25.0; IBM) and described as the mean ± SD for continuous variables. The paired t test and Wilcoxon signed-rank test were used to compare the clinical and stability outcomes preoperatively and postoperatively. The Kolmogorov-Smirnov test was used to confirm the normality of distributions for all continuous variables. Differences in categorical and continuous variables were examined using the Pearson chi-square test and Student t test, respectively. Correlation analysis was performed to evaluate the relationship between the clinical outcomes, stability outcomes, and SIR of the graft. Univariate regression analysis and multivariate stepwise regression analysis were conducted to further assess the independent correlated factors of the mean SIRs of the proximal portion, distal portion, and whole graft. Statistically significant variables from univariate analysis were used in multivariate stepwise regression analysis. The interobserver and intraobserver reliabilities of the measurements were analyzed using the intraclass correlation coefficient. Data with P < .05 were considered statistically significant.
Results
A total of 50 knees (50 patients; 43 male, 7 female) were finally included in this study. They underwent PCLR (26 cases) and combined PCL-PLCS reconstruction (24 cases). The mean age at the time of surgery was 36.4 ± 12.5 years, the mean follow-up period was 39.3 ± 18.5 months, and the mean time from injury to surgery was 14.7 ± 25.0 months. The intraclass correlation coefficients for intraobserver and interobserver agreements ranged between 0.803 and 0.846 for the evaluation of the SIR, between 0.822 and 0.871 for the MRI evaluation, between 0.812 and 0.856 for the radiographic evaluation, and between 0.843 and 0.884 for the CT evaluation. Analysis of the 3 areas of the graft revealed that the mean thicknesses of the graft’s midportion and distal portion were significantly larger than that of the proximal portion (P < .001). The IKDC subjective and objective scores, Lysholm scores, and side-to-side differences of all patients had significant postoperative improvements. Tunnel factors, graft characteristics, and clinical outcomes are summarized in Table 1.
Tunnel and Graft Characteristics as Well as Clinical and Stability Outcomes a

Data are reported as mean ± SD unless otherwise indicated. Af-Proximal, femoral tunnel–proximal graft angle; At-Distal, tibial tunnel–distal graft angle; CT, computed tomography; C/TC, ratio between the coronal tibial tunnel distance and the total coronal distance; IKDC, International Knee Documentation Committee; MRI, magnetic resonance imaging; S/TS, ratio between the sagittal tibial tunnel distance and the total sagittal distance.
Signal Intensity of Grafts Via MRI
The mean SIR of the whole graft was 2.1 ± 1.3. The mean SIRs of the proximal portion, midportion, and distal portion were 2.0 ± 1.2, 2.8 ± 2.0, and 1.1 ± 0.8, respectively. The mean SIR of the midportion was higher than that of the proximal and distal portions (P = .028 and P < .001, respectively). The SIR of the proximal portion was higher than that of the distal portion (P = .002). There was no difference in the mean SIR of the proximal portion, midportion, distal portion, and whole graft between the isolated PCLR and combined PCL-PLCS reconstruction groups.
For the correlation analysis, the SIR of the graft’s midportion was positively associated with the thickness of the midportion (r = 0.321; P = .023). The SIR of the graft was not significantly associated with patient age, height, weight, thickness of the other portions of the graft, or clinical and stability outcomes.
Signal Intensity Versus Tunnel Position and Angle
Regression analysis of the SIR of the proximal and distal portions with tunnel factors is summarized in Table 2. For the proximal portion of the graft, univariate regression analysis revealed that a more anteriorly and distally positioned femoral tunnel in the x-axis direction (β = −0.439; P = .001) and a more posteriorly and distally positioned femoral tunnel in the y-axis direction (β = −0.285; P = .045) were associated with a decreased SIR. A less acute femoral coronal angle (β = −0.303; P = .033) and a less acute Af-Proximal angle (β = −0.849; P < .001) were also associated with a decreased SIR. Multivariate regression analysis indicated that a more anteriorly and distally positioned femoral tunnel in the x-axis direction (β = −0.166; P = .040) and a less acute Af-Proximal angle (β = −0.792; P < .001) were significant independent contributing factors of a decreased SIR of the proximal portion.
Regression Analysis Between Signal Intensity Ratio and Tunnel Characteristics of Proximal and Distal Portions a
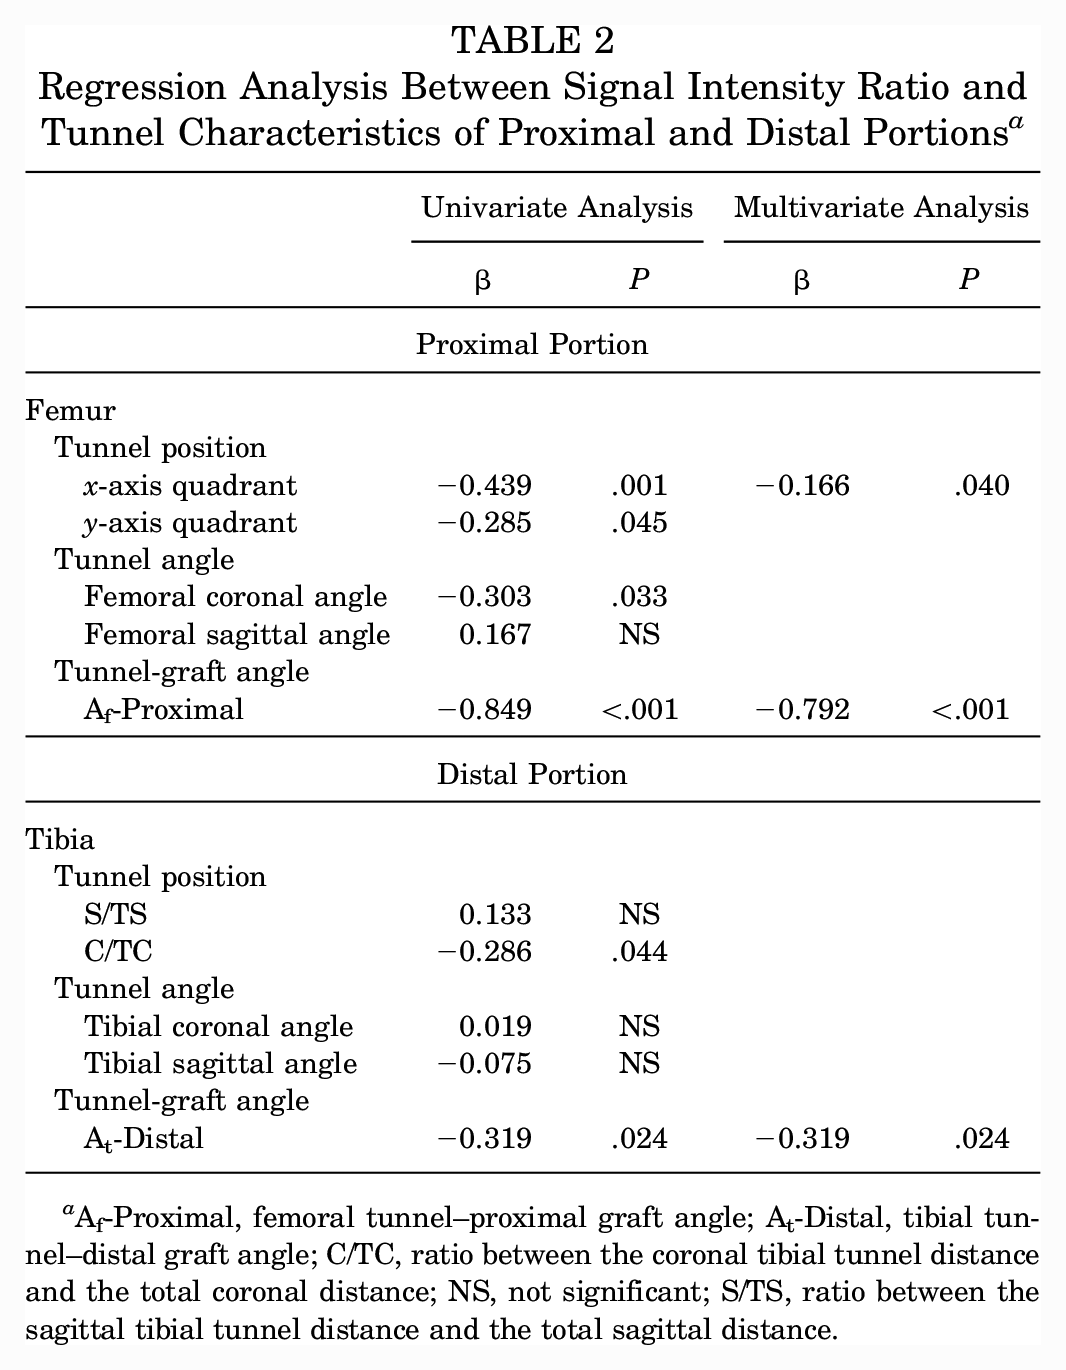
Af-Proximal, femoral tunnel–proximal graft angle; At-Distal, tibial tunnel–distal graft angle; C/TC, ratio between the coronal tibial tunnel distance and the total coronal distance; NS, not significant; S/TS, ratio between the sagittal tibial tunnel distance and the total sagittal distance.
For the distal portion of the graft, univariate regression analysis revealed that a more laterally positioned tibial tunnel (β = −0.286; P = .044) and a less acute At-Distal angle (β = −0.319; P = .024) were associated with a decreased SIR. Multivariate regression analysis indicated that a less acute At-Distal angle (β = −0.319; P = .024) was a significant independent contributing factor of a decreased SIR of the distal portion (Table 2).
For the whole graft, univariate regression analysis showed that a more posteriorly and distally positioned femoral tunnel in the y-axis direction (β = −0.378; P = .007), a less acute Af-Proximal angle (β = −0.668; P < .001), and a thinner thickness of the graft’s midportion (β = 0.339; P = .016) were associated with a decreased SIR. Multivariate regression analysis indicated that a less acute Af-Proximal angle (β = −0.668; P < .001) was a significant independent contributing factor of a decreased SIR of the whole graft (Table 3).
Regression Analysis Between Signal Intensity Ratio and Tunnel Characteristics of Whole Graft a

Af-Proximal, femoral tunnel–proximal graft angle; At-Distal, tibial tunnel–distal graft angle; C/TC, ratio between the coronal tibial tunnel distance and the total coronal distance; NS, not significant; S/TS, ratio between the sagittal tibial tunnel distance and the total sagittal distance.
Relationship Between Tunnel-Graft Angle and Tunnel Position and Angle
The association between graft angle and tunnel factors is summarized in Table 4. The Af-Proximal angle was found to be smaller than the At-Distal angle, indicating that the femoral tunnel-graft angle was more acute than the tibial tunnel-graft angle (P = .004). Multivariate regression analysis showed that an anteriorly and distally positioned femoral tunnel in the x-axis direction (β = 0.373; P = .005) and a posteriorly and distally positioned femoral tunnel in the y-axis direction (β = 0.367; P = .006) were significant independent contributing factors of a less acute Af-Proximal angle. Multivariate regression analysis revealed that a laterally positioned tibial tunnel was the only significant independent contributing factor of a less acute At-Distal angle (β = 0.946; P < .001).
Regression Analysis Between Graft Angle and Tunnel Factors a

Af-Proximal, femoral tunnel–proximal graft angle; At-Distal, tibial tunnel–distal graft angle; C/TC, ratio between the coronal tibial tunnel distance and the total coronal distance; NS, not significant; S/TS, ratio between the sagittal tibial tunnel distance and the total sagittal distance.
Discussion
The principal findings of this study were as follows: (1) an anteriorly and distally located femoral tunnel and a laterally located tibial tunnel formed a less acute tunnel-graft angle that was associated with lower signal intensity; (2) a less acute femoral tunnel-graft angle was an independent contributing factor of lower signal intensity of the whole graft; and (3) the SIR of the graft around the femoral tunnel was higher than that around the tibial tunnel. Our study identified tunnel formation and assessed its association with the SIR of the reconstructed PCL. The hypothesis in this study was rejected.
The success of PCLR depends on the biological process of graft healing, and tunnel position, tunnel angle, and graft maturation can be considered important factors for this purpose. The SIR on MRI has been described to be an important tool for assessing graft healing, and a low SIR has been reported as indicating enhanced graft properties and biomechanical properties. Conversely, an increased SIR is associated with poor graft maturity and reruptures.19,26 Our study evaluated the relationship of the SIR with tunnel position and angle. Femoral tunnel position is regarded as an important factor of stability. 25 Markolf et al 21 reported that a graft placed in the anterolateral bundle located at the anterior and distal portions of the femoral footprint efficiently replicates PCL force profiles. On the contrary, a proximally positioned femoral tunnel widens the diameter of the widest site in the femoral tunnel and creates a more acute graft angle. 12 Our results also showed similar results in terms of angle formation between grafts and tunnels, and it was related to the SIR of the graft.
Traditionally, the killer turn effect has been an important concern in understanding the tibial tunnel. The remnant preservation technique in PCLR is believed to prevent the killer turn effect by the cushioning function of remnant tissue.10,31 Our study showed that the killer turn was similar between the femoral and tibial tunnels and that, by altering the tibial tunnel position more laterally, a less acute tibial tunnel-graft angle was formed that was associated with lower signal intensity of the graft. A tibial tunnel in remnant-preserving PCLR should be located in the lateral and distal portions of the remnant PCL.4,16 Generally, a PCL graft should pass from the anterior side to the back side of the tibia. Afterward, it turns to the femoral tunnel at the anteriorly distal wall of the medial femoral condyle. If the tibial tunnel is positioned laterally, the PCL graft goes around remnant tissue and passes the medial border of the remnant PCL toward the femoral tunnel. We did not directly assess the role of the PCL remnant, but it was assumed that remnant tissue might work as a soft tissue cushion that prevents an acute angle, causing the killer turn effect described in previous studies.9-11 Further prospective studies are needed to provide evidence for it.
An acute graft angle has been regarded as an important factor of graft failure. 8 An acute tunnel-graft angle formed by the interface between the tunnel entrance and the graft may contribute to repetitive graft abrasion, increased shear stress, and early graft failure. 8 In other words, a low SIR can reflect good graft properties with an anteriorly and distally located femoral tunnel and a laterally located tibial tunnel in which tunnel-graft angles are less acute. These locations also correspond well with proper locations for the biomechanical stability and prevention of impingement with the medial femoral condyle. In addition, acute angle formation was more prominent on the femoral side, which was contrary to our expectation that the killer turn could be a crucial concern in transtibial PCLR.
The graft was the thickest at the midportion. The graft on the tibial side was also thick, but it did not significantly affect the overall increase in signal intensity compared with that on the middle or proximal femoral side. 10 The SIR of the graft’s midportion was significantly higher than that of the proximal and distal portions. The high SIR of the midportion may be caused by revascularization and ligamentization.1,24 We speculated that the high SIR of the midportion might be attributed to the influence of the remnant PCL that resulted in a heterogeneous SIR of the graft and because of delayed maturation of the graft, given the increased distance from the blood supply. In addition, the midportion was thicker, and it was assumed that the remnant and graft were not tightly intermingled in the midportion. On the contrary, the distal and proximal portions were inserted into the tunnel, winding and compressing the remnant tightly, and this might have caused the thinner thickness in the proximal and distal portions that resulted in a low signal of the graft.
Limitations
This study has several limitations. First, this study analyzed retrospective data from a single institution in which 26 patients were lost to follow-up, creating the possibility of selection bias in the follow-up cohort. In addition, isolated and combined PCLR procedures were mixed, with equal proportions of isolated PCLR and combined PCL-PLCS reconstruction. Second, the PCL graft was only measured in the extended knee position because MRI was performed at this angle. If we considered the major role of the anterolateral bundle that prevented posterior tibial translation at 90° of knee flexion, evaluations at this angle would help to elucidate the changes in the graft-bending angle according to the knee flexion angle. Third, a direct assessment on the composition of the graft and remnant was impossible, and it was only assumed that the graft was thickest with higher signal intensity in the midportion. Fourth, clinical outcomes and tunnel and graft factors were not statistically analyzed. The reconstructed PCL was evaluated according to the area of the graft to identify the difference in the inner portions of the graft. Therefore, an overall comparison between patients was not the main goal of our study. Fifth, no assessment was performed on where the PCL injury occurred, which is likely to be related to graft thickness. However, the cases were too heterogeneous in terms of chronicity, tear pattern, and remnant status, and it was impossible to evaluate them homogeneously. Finally, no standard method for measuring the SIR of the PCL graft was available. Studies on the SIR of a reconstructed graft in PCLR are lacking. Therefore, the quadriceps tendon was chosen for tissue normalization.
Conclusion
The increase in signal intensity of the proximal portion of the graft around the femoral tunnel was greater than that of the distal portion of the graft around the tibial tunnel. An anteriorly and distally positioned femoral tunnel and a laterally positioned tibial tunnel resulted in a less acute tunnel-graft angle that was associated with decreased signal intensity.
Footnotes
Final revision submitted January 30, 2023; accepted February 13, 2023.
The authors declared that there are no conflicts of interest in the authorship and publication of this contribution. AOSSM checks author disclosures against the Open Payments Database (OPD). AOSSM has not conducted an independent investigation on the OPD and disclaims any liability or responsibility relating thereto. Ethical approval for this study was obtained from Seoul National University (No. B-2209-778-102).