
Abstract
Background:
Limited data exist regarding the association of tibiofemoral bony and soft tissue geometry and knee laxity with risk of first-time noncontact anterior cruciate ligament (ACL) rupture.
Purpose:
To determine associations of tibiofemoral geometry and anteroposterior (AP) knee laxity with risk of first-time noncontact ACL injury in high school and collegiate athletes.
Study Design:
Cohort study; Level of evidence, 2.
Methods:
Over a 4-year period, noncontact ACL injury events were identified as they occurred in 86 high school and collegiate athletes (59 female, 27 male). Sex- and age-matched control participants were selected from the same team. AP laxity of the uninjured knee was measured using a KT-2000 arthrometer. Magnetic resonance imaging was taken on ipsilateral and contralateral knees, and articular geometries were measured. Sex-specific general additive models were implemented to investigate associations between injury risk and 6 features: ACL volume, meniscus–bone wedge angle in the lateral compartment of the tibia, articular cartilage slope at the middle region of the lateral compartment of the tibia, femoral notch width at the anterior outlet, body weight, and AP displacement of the tibia relative to the femur. Importance scores (in percentages) were calculated to rank the relative contribution of each variable.
Results:
In the female cohort, the 2 features with the highest importance scores were tibial cartilage slope (8.6%) and notch width (8.1%). In the male cohort, the 2 top-ranked features were AP laxity (5.6%) and tibial cartilage slope (4.8%). In female patients, injury risk increased by 25.5% with lateral middle cartilage slope becoming more posteroinferior from –6.2° to –2.0° and by 17.5% with lateral meniscus–bone wedge angle increasing from 27.3° to 28.2°. In males, an increase in AP displacement from 12.5 to 14.4 mm in response to a 133-N anterior-directed load was associated with a 16.7% increase in risk.
Conclusion:
Of the 6 variables studied, there was no single dominant geometric or laxity risk factor for ACL injury in either the female or male cohort. In males, AP laxity >13 to 14 mm was associated with sharply increased risk of noncontact ACL injury. In females, lateral meniscus–bone wedge angle >28° was associated with a sharply decreased risk of noncontact ACL injury.
Anterior cruciate ligament (ACL) rupture is a common, painful, and debilitating injury among athletes and other active individuals. This injury also has serious long-term ramifications, notably an increasing risk of early-onset posttraumatic osteoarthritis. 1,26,27,33 Considering these short- and long-term consequences, there is an opportunity to improve patient outcomes by identifying and characterizing risk factors for experiencing an ACL injury. Ultimately, this could provide underpinnings for injury-prevention protocols and nonsurgical and surgical treatments.
Risk of ACL injury has a multifactorial etiology, including joint laxity and geometric factors. 34,41 For example, increased anteroposterior (AP) tibiofemoral laxity during a clinical or instrumented Lachman examination, decreased femoral notch width, and increased posteroinferior-directed sagittal slope of the tibial plateau and cartilage are all associated with increased risk of ACL injury. 4,6,16,29 –31,37,40 Additional anatomic factors have been correlated with risk of ACL injury, including decreased medial tibial plateau depth of concavity, decreased muscle mass of the quadriceps, and decreased cross-sectional area of the ACL itself. 7,10,16,22,29 Increased body weight is also a known risk factor, and several studies have suggested that in some populations, it is superior to body mass index in determining risk of ACL rupture and other acute knee injuries. 5,15,19,39 However, limited data are available regarding the associations of knee laxity, tibiofemoral bony and soft tissue geometries, and body weight with risk of first-time, noncontact ACL rupture. With this knowledge, clinicians could establish more personalized nonsurgical or surgical treatments targeting the most critical factors driving risk of experiencing an ACL injury.
Previous work focusing on the role of knee geometry revealed that combinations of variables, which differ between female and male patients, are associated with risk of injury. 31,32 In female patients, concomitant decreased width of the femoral notch and decreased height of the lateral meniscus are associated with increased risk of injury. 31 In male patients, decreased ACL volume and decreased lateral meniscus–bone wedge angle are associated with increased risk of injury. However, these risk models do not consider tibiofemoral joint laxity.
AP laxity (assessed via KT-2000 arthrometer) and tibiofemoral bony geometry were among risk factors found to relate to ACL injury in a prospective study of 859 West Point cadets who were followed over their entire 4-year military training. 35 This study revealed that increased AP laxity was associated with risk of ACL injury in female cadets but not in their male counterparts. However, the geometric factors studied focused on bony anatomy and were limited to mediolateral widths of the distal tibia and proximal femur measured on radiographs. 6 Soft tissue geometries that are not visible on radiograph (eg, tibial articular cartilage slope, ACL volume, and meniscal wedge angle) are also related to risk of injury 32 but were not integrated into the West Point risk model. Moreover, measures made on radiograph are susceptible to projection artifact, which may introduce error in these measurements. 9,13,36
Previous analyses 2,4,6,12,21,30 –32 have not investigated potential nonlinear associations between individual risk factors and injury risk. Linear and logistic analyses have the advantages of being simpler to conduct and easier to interpret than nonlinear analyses. However, these analyses have the potential to over- or underestimate risk of ACL injury over specific ranges of a feature, as they rely on the assumption that associations with risk remain constant across broad ranges of a feature. Conversely, in the absence of such restraints, the assessment of nonlinear associations can more flexibly identify specific “threshold” values (ie, inflection points) of a feature over which risk of injury may increase or decrease rapidly.
The objective of this study was to quantify the risk of first-time, noncontact ACL injury associated with AP knee laxity, tibiofemoral geometry, and body weight measurements in high school and collegiate athletes. To achieve this, we used generalized additive models (GAMs), which incorporate the summation of multiple single-feature, likelihood-based regression models to detect nonlinear relationships. 8,23 We posed 2 research questions for the female and male cohorts in our study: (1) Which are the most important of these variables regarding risk of first-time, noncontact ACL injury? (2) What is the nature of these relationships (ie, are they linear or nonlinear)? Furthermore, in the presence of nonlinear relationships, we sought to identify clinically significant thresholds for these variables.
Methods
Data Acquisition
Data were acquired from patients with first-time, noncontact ACL injuries and from uninjured controls. A noncontact injury—as determined by the medical care provider at the institution where the injury was diagnosed and confirmed by the injured patient—was defined as an event occurring with no direct contact to the ACL-injured knee from another athlete, the ground, or other object. These data were obtained as a part of an institutional review board–approved prospective cohort study with a nested matched case-control analysis that commenced in the fall of 2008. 40 This study contains additional analyses of data previously published by Sturnick et al 32 and Vacek et al. 37 Over a 4-year period, grade 3 noncontact ACL injury events were identified as they occurred in 86 athletes (59 female, 27 male) from 36 institutions (28 high schools and 8 colleges) in the northeastern United States. Controls were selected from the same team, were the same sex, and participated in the same sport. Individuals with previous ACL injury were excluded. Participant enrollment is shown in Figure 1. There were no significant differences in age, height, or weight between injured athletes and controls (Table 1).
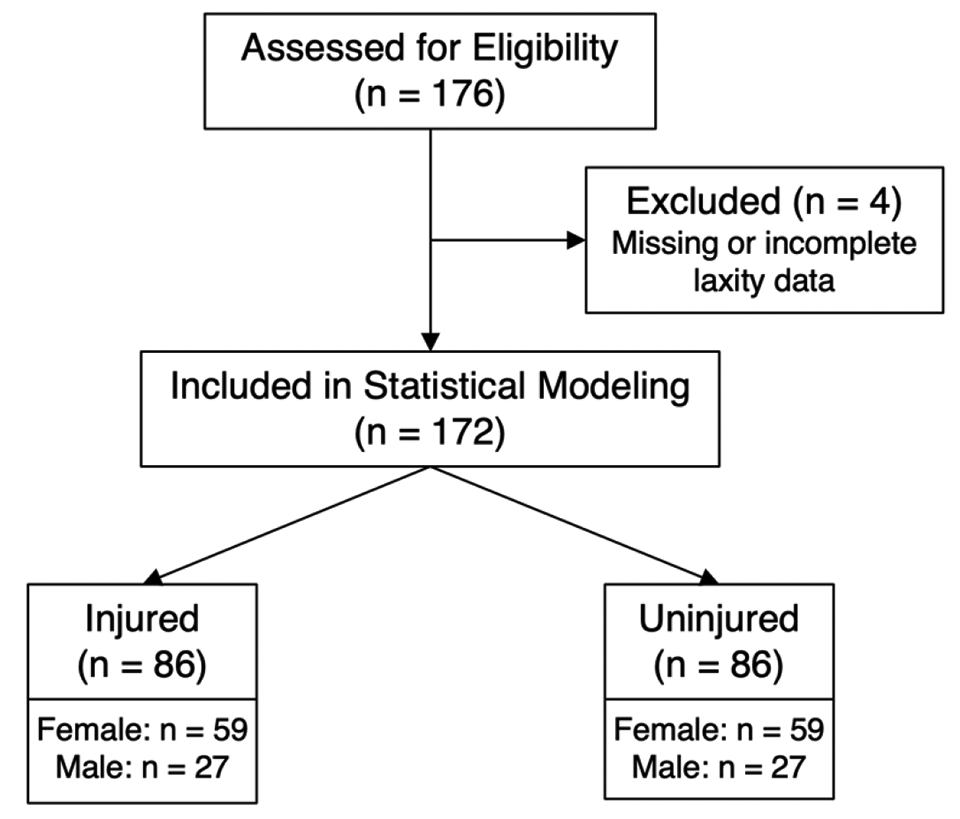
CONSORT (Consolidated Standards of Reporting Trials) flow chart of participant enrollment.
Characteristics of the Study Groups, Stratified by Sex a

a Data are expressed as mean ± SD (range). MRI, magnetic resonance imaging; NA, not applicable.
ACL injuries were diagnosed by an independent orthopaedic surgeon and confirmed by magnetic resonance imaging (MRI). Imaging was acquired from the ipsilateral and contralateral knees of all patients using a Phillips Achieva 3-T MRI system (Phillips Medical Systems) while the patients were positioned supine with their knees in full extension (0° of flexion) inside an 8-channel SENSE knee coil. Sagittal-plane 3-dimensional (3D) T1-weighted fast-field echo scans (resolution, 0.3 × 0.3 mm; slice thickness, 1.2 mm) and sagittal-plane 3D proton density–weighted scans (resolution, 0.4 × 0.4 mm; slice thickness, 0.7 mm) were obtained, and multiplanar reformatting was implemented to reconstruct the coronal and transverse planes. The MRI system, the technique to position and support the legs during MRI acquisition, and the approach to locate the planes in which the MRI data were acquired were the same for all participants. For patients with ACL injuries, MRI scans were obtained after injury but before surgery to avoid image artifact from the potential presence of ACL graft fixation hardware or meniscal surgery.
Under the guidance of a sports fellowship–trained orthopaedic surgeon, geometric measurements were obtained by a single independent examiner, a trained research assistant with demonstrated test-retest reliability who performed manual segmentation with a digitizing tablet (Wacom Technology) using Digital Imaging and Communications in Medicine viewer software (Pixmeo Version 5.5.1; OsiriX) to render the 3D geometries of the ACL, tibia, femur, tibial cartilage, and meniscus. The measurements were made in a standardized 3D tibial coordinate system. 4 Prior studies have established that all measurements display inter- and intraobserver reliability. 4,30,31,40 All femoral notch width measurements were taken parallel to a reference line that was tangent to the posterior subchondral aspects of both femoral condyles.
AP laxity of the tibia relative to the femur at 25° of flexion was measured via a KT-2000 arthrometer using standard techniques by an independent physical therapist who was trained in its use and previously demonstrated intrarater reliability. 37 This measurement was obtained on the uninjured knee in the ACL-injured group and the same side (left or right) in the control group. AP laxity was defined as the AP displacement of the tibia relative to the femur in response to loads directed anterior (133 N) and posterior (90 N) to the tibia. With the patient relaxed, 3 posterior-directed forces were applied to the anterior aspect of the tibia to identify a reproducible initial position of the tibia relative to the femur. Then, a single anterior-directed force was applied to the tibia. Three trials were completed for each participant.
Statistical Analysis
The statistical models included 6 variables. Four variables described the bony and soft tissue geometry of the knee and have consistently been reported to exhibit associations with risk of inury 3,4,6,31,32,37,40 : ACL volume; meniscus–bone wedge angle in the lateral compartment of the tibia; articular cartilage slope—measured relative to a line orthogonal to the superoinferior axis of the tibia 4 —at the middle region of the lateral compartment of the tibia; and femoral notch width at the anterior outlet—a segment parallel to the intercondylar roof, intersecting the thickest part of the bony ridge of the medial condyle 40 (Figure 2). The remaining 2 variables were total AP displacement of the tibia relative to the femur and body weight. Before running analyses, collinearity among the variables was assessed and ruled out by computing pairwise correlation coefficients. 14
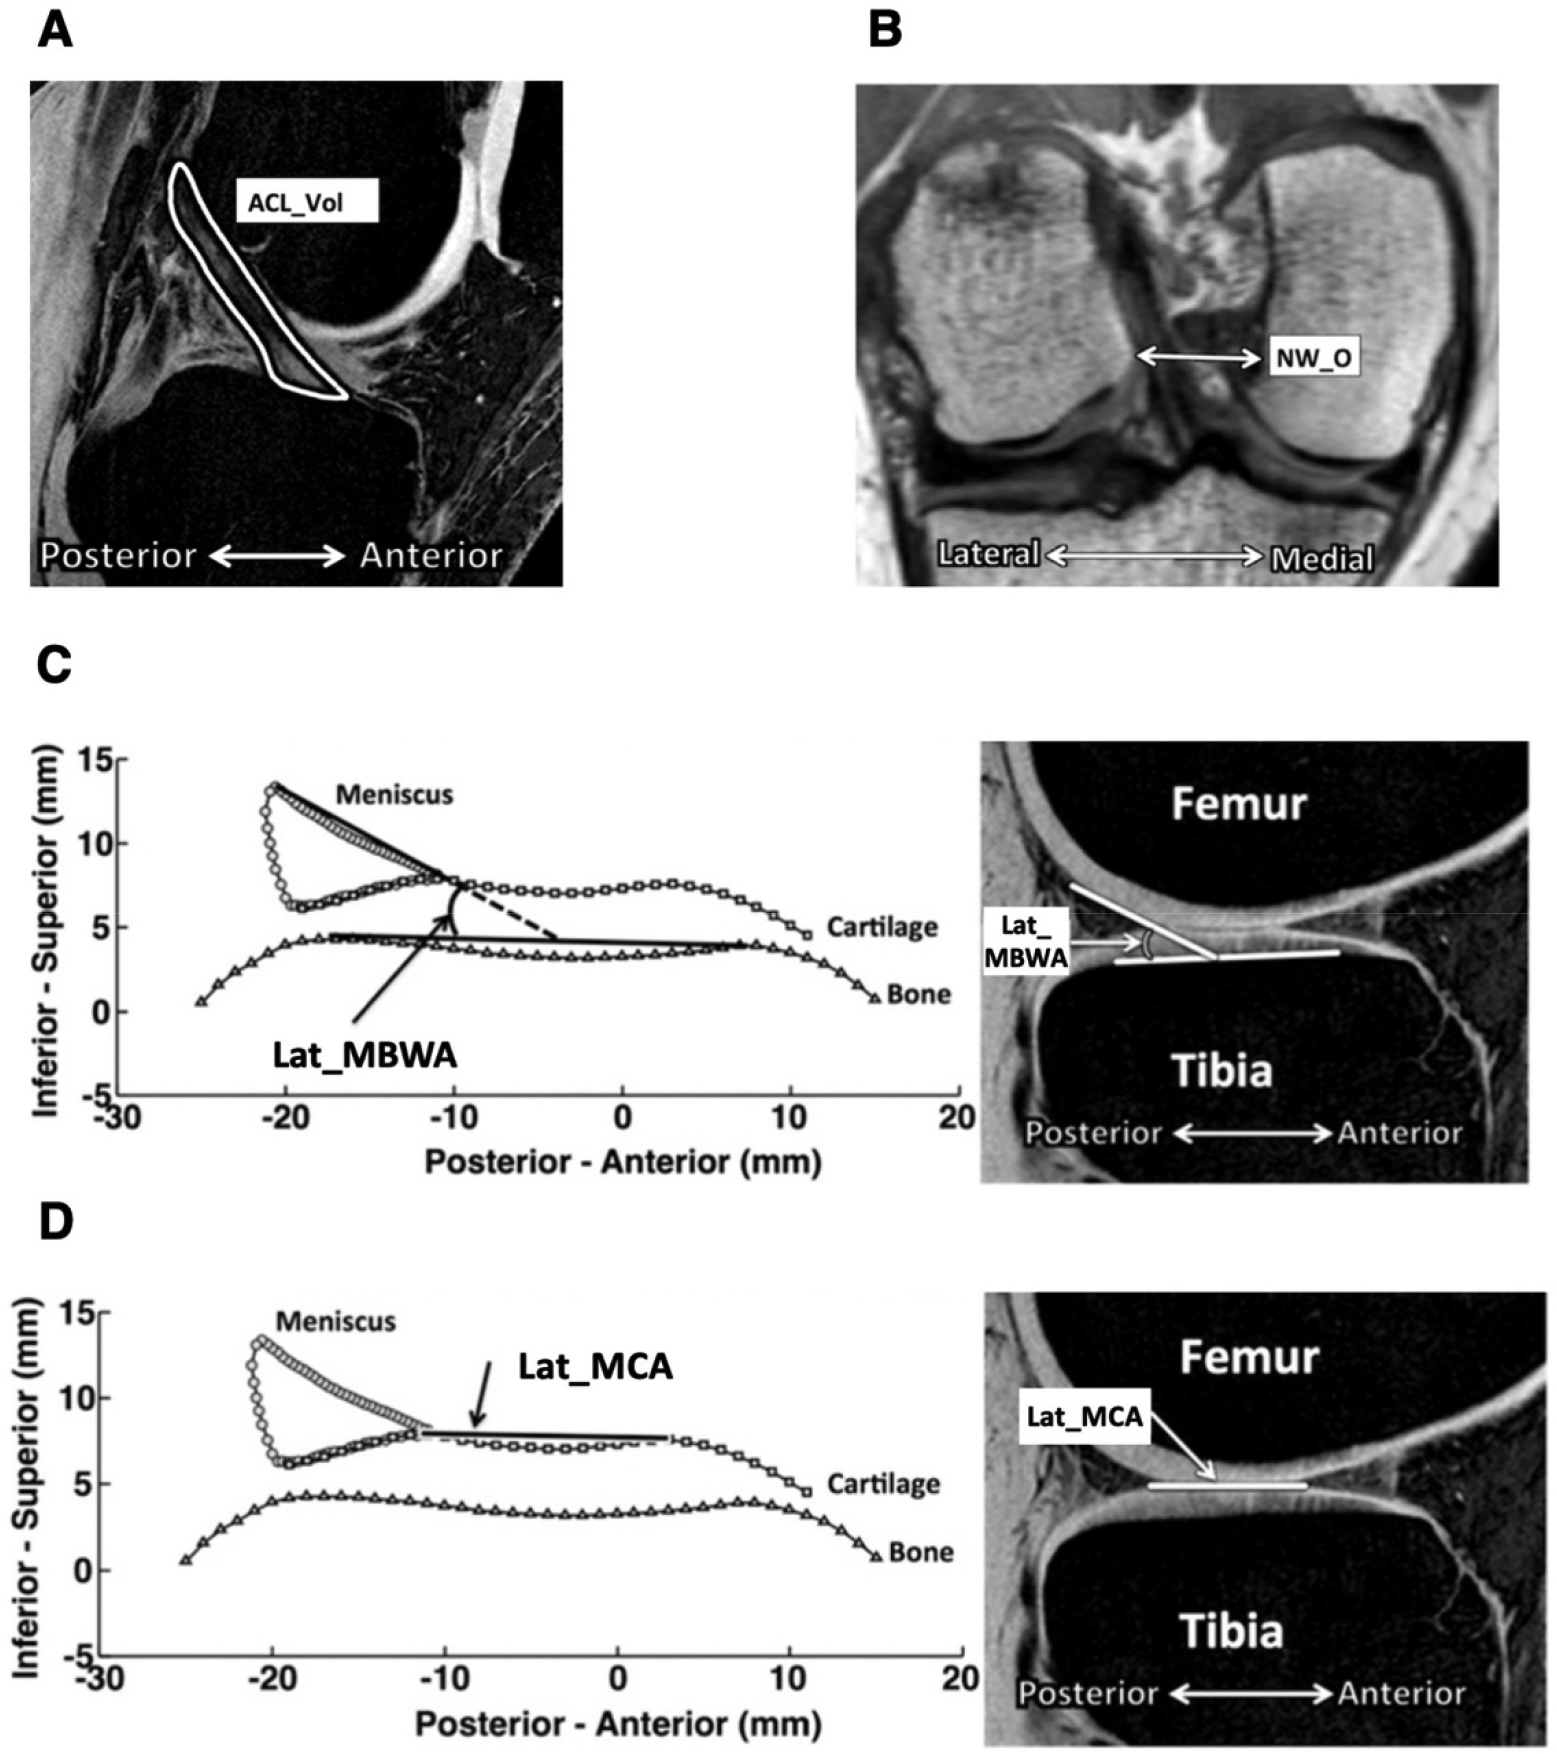
Anatomic measurements obtained from segmentation of magnetic resonance images included (A) ACL volume (ACL_Vol), (B) femoral notch width at the anterior outlet (NW_O), (C) meniscus–bone wedge angle in the lateral compartment of the tibia (Lat_MBWA), and (D) articular cartilage slope at the middle region of the lateral compartment of the tibia (Lat_MCA). For articular cartilage slope, an increasing number indicates a more posteroinferior-directed angle. Figure adapted with permission from Sturnick et al. 31
GAM is a technique in which independent variables are fit to regularized (or “smooth”) functions that can be linear or nonlinear, depending on the nature of the data. 23 This was conducted on females and males separately to assess for sex-specific associations of geometric and AP laxity features with risk of first-time, noncontact ACL rupture. GAMs were implemented in Python using the ExplainableBoostingRegressor class from the open-source InterpretML library. Given the small sample sizes, the model was instructed not to assess pairwise interaction effects. In addition, based on developer recommendations, 25 several model parameters were adjusted to improve performance, while most were kept at their default values. 23,25
Summary statistics of means, standard deviations, and ranges were reported for all variables for cases and controls and compared via Student t test with α set to .05. To answer our first research question, risk factors in each model were ranked by overall importance scores, which represent the mean percentage change in risk of injury associated with a given risk factor. These scores were calculated using the means of the absolute values of the link function, which maps each risk factor value onto an injury risk score (the probability of an athlete’s being a case vs a control) for each observation via boosting, which is an ensemble method. 18 A greater importance score corresponds to a greater contribution in calculating risk of injury.
To answer our second research question, univariate partial dependence plots were reported for each model to visualize how risk of injury changed for the 6 variables over their range. These plots represent the estimated probability of injury as a function of each variable, holding all other variables constant. 20 Injury risk estimates and their 95% CIs were plotted over the range of each variable. Regions along the range of each variable where the 95% CIs did not overlap indicated statistically significant changes in risk (increases or decreases).
Results
When compared with their matched uninjured controls, the contralateral sides of female athletes with ACL injuries averaged greater AP displacement by 1.4 mm (P = .0060), lesser lateral meniscus–bone wedge angle by 2.4° (P = .0027), greater lateral middle cartilage slope by 4.0° (P = .0001), and lesser notch width by 1.6 mm (P = .0002); ACL volume and body weight were not significantly different (Table 2). The contralateral sides of male athletes averaged lesser notch width by 1.6 mm (P = .0254) and lesser ACL volume by 246 mm3 (P = .0136) as compared with their matched uninjured controls; AP displacement, body weight, lateral meniscus–bone wedge angle, and lateral middle cartilage slope did not differ significantly.
Comparison of the 6 Risk Factors Included in the Model, Stratified by Sex a
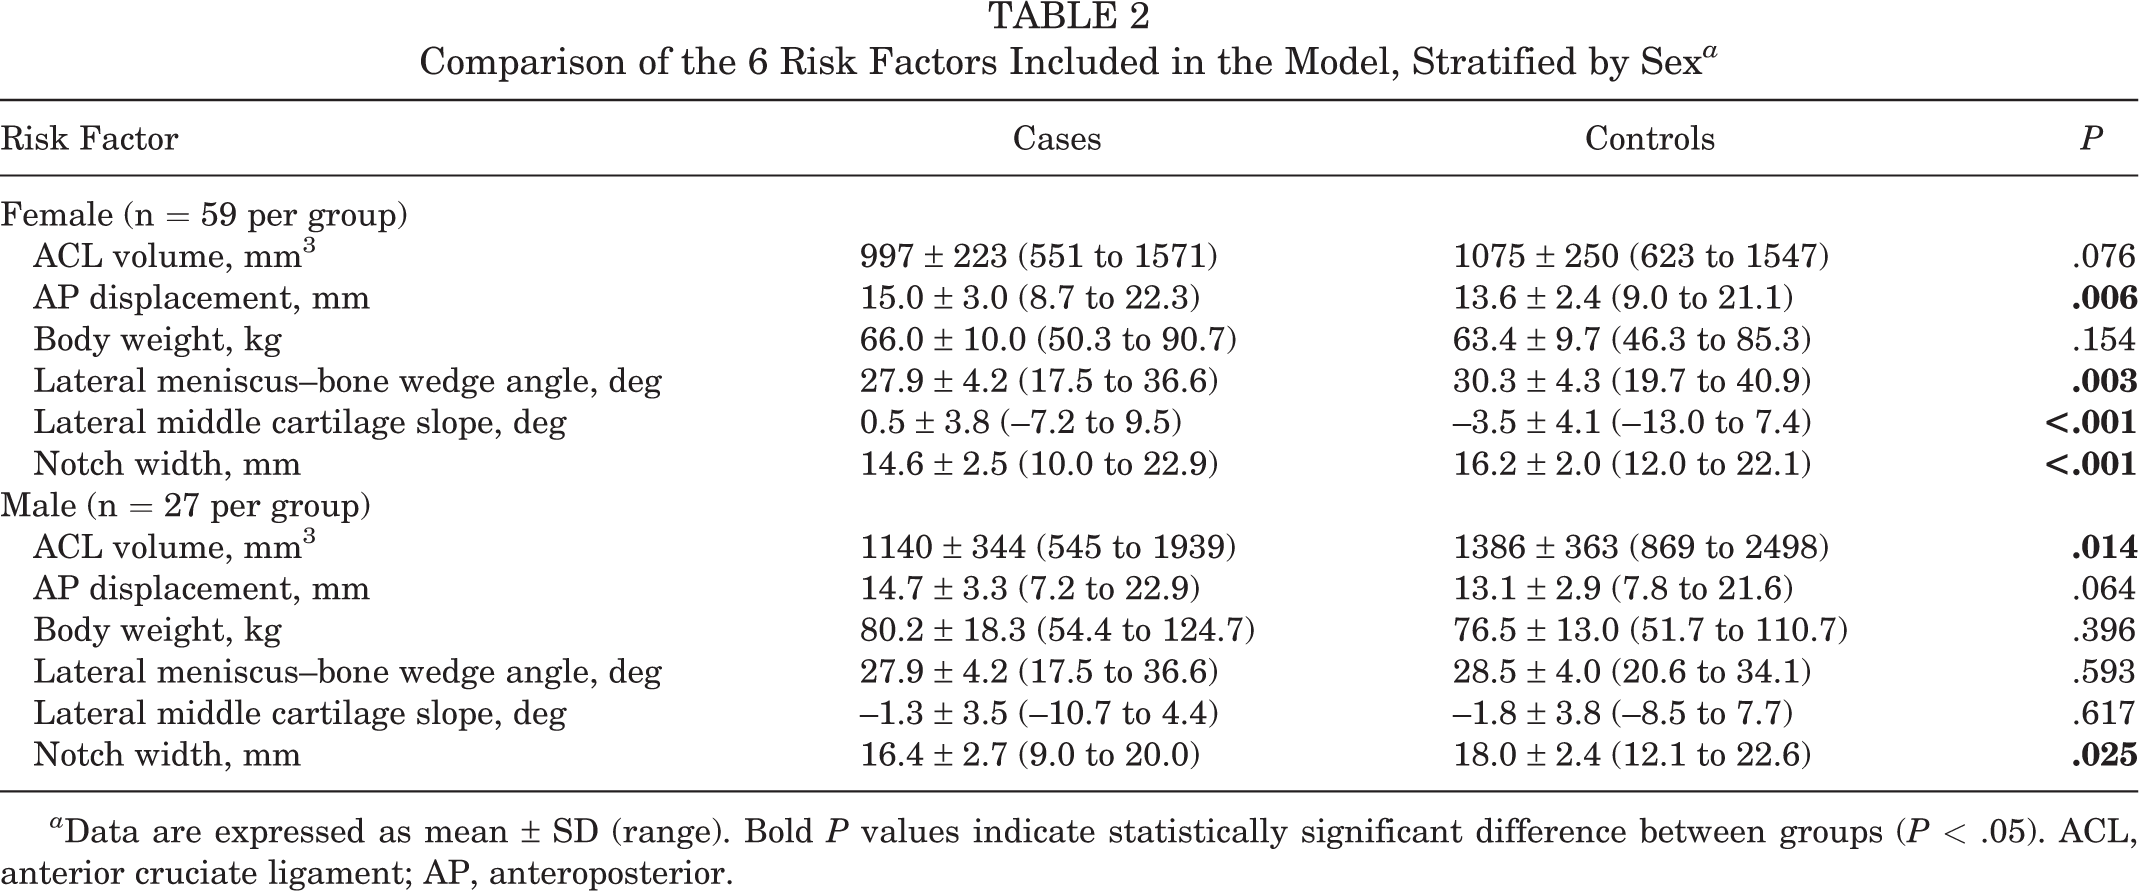
a Data are expressed as mean ± SD (range). Bold P values indicate statistically significant difference between groups (P < .05). ACL, anterior cruciate ligament; AP, anteroposterior.
Regarding our first research question, AP displacement and some aspects of knee geometry were associated with risk of first-time, noncontact ACL injury in females and males (Table 3). In females, importance scores ranged from 3.3% to 8.6%; the 2 features with the highest importance scores were lateral middle cartilage slope at 8.6% and notch width at 8.1%. AP displacement was the fourth-ranked feature at 4.8%. In males, importance scores ranged from 2.0% to 5.6%; the 2 top-ranked features were AP displacement at 5.6% and lateral middle cartilage slope at 4.8%. Body weight had the lowest importance score for females and males at 3.3% and 2.0%, respectively.
Overall Importance Scores of Each Risk Factor Computed by a General Additive Model, Stratified by Sex a

a ACL, anterior cruciate ligament; ACL_Vol, anterior cruciate ligament volume; AP, anteroposterior; disp, anteroposterior displacement of the tibia relative to the femur; Lat_MBWA, meniscus–bone wedge angle in the lateral compartment of the tibia; Lat_MCA, articular cartilage slope overlying the middle region of the meniscus in the lateral compartment of the tibia; NW_O, femoral notch width at the anterior outlet; weight, body weight.
Regarding our second research question, there were geometric and AP laxity variables that exhibited nonlinear relationships with risk of first-time, noncontact ACL injury in females and males (Figures 3 and 4). In females, for lateral meniscus–bone wedge angle, there was a rapid decrease in risk of 17.5% (95% CI, 15.7%-19.3%) from 27.3 to 28.2° (risk decreased by 19.4% per degree increase) (Figure 3D). In males, as AP displacement increased from 12.5 to 14.4 mm, there was a rapid increase in risk of 16.7% (95% CI, 14.9%-18.6%) (risk increased by 8.8% per mm increase) (Figure 4B).

Partial-dependence plots computed by generalized additive models on the female data showing the effect on injury risk of (A) anterior cruciate ligament (ACL) volume, (B) anteroposterior (AP) displacement, (C) bodyweight, (D) lateral meniscus–bone wedge angle, (E) lateral middle cartilage slope, and (F) notch width. Deciles of the feature values are shown with tick marks on the x-axes. Gray bars represent 95% CIs.

Partial dependence plots computed by generalized additive models on the male data showing the effect on injury risk of (A) anterior cruciate ligament (ACL) volume, (B) anteroposterior (AP) displacement, (C) bodyweight, (D) lateral meniscus–bone wedge angle, (E) lateral middle cartilage slope, and (F) notch width. Deciles of the feature values are shown with tick marks on the x-axes. Gray bars represent 95% CIs.
In contrast, several other geometric variables exhibited relationships with risk that were approximately linear. In females, for lateral middle cartilage slope, risk increased by 2.5% per degree (Figure 3E). In males, injury risk was approximately linearly associated with lateral meniscus–bone wedge angle (risk decreased by 1.0% per degree increase in wedge angle) and notch width (risk decreased by 1.7% per mm increase in notch width) (Figure 4, D and F).
Additional geometric and AP laxity variables exhibited relationships that were linear over a portion of their range and then remained constant for other portions. In females, for AP displacement, risk remained constant for values <13.7 mm, but risk increased by 20.3% from 13.7 to 18.6 mm (risk increased by 4.1% per mm increase in AP displacement) (Figure 3B). For notch width, risk decreased by 25.5% from 12.0 to 16.6 mm (risk decreased by 5.8% per mm increase in notch width) but remained constant for values >16.6 mm (Figure 3F). In males, as ACL volume increased from 711 to 1504 mm3, risk decreased by 17.0% (risk decreased by 2.1% per 100 mm3 increase in ACL volume) but remained constant for values >1504 mm3 (Figure 4A).
Discussion
We assessed the risk of first-time, noncontact ACL injury in high school and collegiate athletes using GAMs. Our risk model was unique in that it integrated measures of AP laxity of the knee, geometries of the tibiofemoral bones and soft tissues, and body weight using unconventional statistical instrumentation for advanced pattern recognition. We had 2 key findings. First, no single geometric or laxity risk factor provided a dominant contribution to risk of injury in either the female or the male cohort, as no variable contributed a mean percentage change in risk of injury of >8.6% or <2.0% (Table 3). Specifically, in our female cohort, lateral middle cartilage slope and femoral notch width yielded the highest importance scores at 8.6% and 8.1%, respectively. The remaining variables ranged between 3.3% and 5.3%, with AP laxity having an importance score of 4.8%. In males, importance scores ranged between 2.0% and 5.6% for all 6 variables, with AP displacement and lateral middle cartilage slope ranking the highest with importance scores of 5.6% and 4.8%. Second, our analyses revealed critical “threshold” ranges associated with marked increases or decreases in ACL injury risk for some variables. Lateral meniscus–bone wedge angle in females showed a threshold of decreased risk at angles greater than approximately 28°. AP laxity in males exhibited a threshold of increased risk at translations greater than about 13 mm (Figures 3D and 4B).
In accordance with previously reported findings, 29,35,37 the importance scores of the laxity and geometric risk factors in females and males suggest that AP laxity and the geometric features studied are both associated with risk to a similar extent (Table 3): AP laxity (ie, AP displacement) accounted for 4.8% and 5.6% of the overall difference in injury risk between cases and controls in females and males, respectively. The 4 geometric risk factors—ACL volume, lateral meniscus–bone wedge angle, lateral middle cartilage slope, and notch width—accounted for 3.1% to 8.6% of the overall difference in injury risk between cases and controls. Because the importance scores of the laxity and geometric variables are on the same order of magnitude, we conclude that it is important to consider laxity and geometric risk factors when assessing risk of first-time, noncontact ACL injury. In addition, because no single risk factor accounted for >8.6% of the overall difference in injury risk between cases and controls, we conclude that there is a combination of risk factors that contribute to risk of injury and that the combination is different between females and males.
Using logistic regression, Sturnick et al 32 previously showed that increased lateral middle cartilage slope (odds ratio [OR] = 1.324 per 1° increase) and decreased width of the femoral notch at its anterior outlet (OR = 1.5 per 1-mm decrease) were risk factors for injury in females and that decreased ACL volume (OR = 1.43 per 100-mm3 decrease) and decreased lateral meniscus–bone wedge angle (OR = 1.23 per 1° decrease) were risk factors for injury in males. Here, we corroborate the work of Sturnick et al 32 using a GAM by showing that risk increased approximately linearly with lateral middle cartilage slope in females and lateral meniscus–bone wedge angle in males (Figures 3E and 4D).
In addition to this substantiation, we extend the findings of Sturnick et al 32 by showing that in females, injury risk remained constant for notch width values above approximately 17 mm (Figure 3F). As a basis of comparison, logistic regression was performed on females and males (see Appendix Figures A1 and A2). The use of a logistic regression model could overestimate injury risk for participants with notch width values near 17 mm and underestimate injury risk for participants with values in the 18- to 22-mm range (Appendix Figure A1). We also showed that in males, injury risk remained constant for ACL volume values greater than about 1500 mm3 (Figure 4A). The use of a logistic regression model could overestimate injury risk for participants with ACL volume values near 1500 mm3 and underestimate injury risk for those with values between 1800 and 2400 mm3 (Appendix Figure A2).
Moreover, the flexibility of this modeling technique in detecting nonlinearities was demonstrated by its designation of lateral middle cartilage slope as the second-most important risk factor in males. While the mean slope measurement was not significantly different between cases and controls according to the conventional Student t test, the GAM did capture a nonlinear relationship, as seen in Figure 4E.
Uhorchak et al 35 found that in West Point cadets, an AP laxity at least 1 SD greater than the mean was a significant injury risk factor in females but not males. Our analysis, in contrast, revealed an association between AP laxity and risk of ACL injury in males. The West Point study, which used logistic regression analysis, may have been underpowered to find such a relationship in males given the small sample size of 12 male cadets who experienced an ACL injury and had AP laxity measurements taken. Our study corroborates the finding of Uhorchak et al that geometric risk factors, such as femoral notch width, are associated with noncontact ACL injury risk, especially in females (Table 3, Figure 3F). In females, we found that femoral notch width had an importance score of 8.1%, meaning that, when averaged across all samples, it accounted for 8.1% of the difference in injury risk between cases and controls.
The regions where we observed nonlinear changes in risk for several variables may have important clinical implications, despite this study’s being underpowered for population-wide prediction because of its small sample size. For example, these results suggest that identifying thresholds for tibial cartilage slope can be used to guide surgeons in establishing quantifiable postoperative targets for tibial slope after a slope-reducing osteotomy. We speculate that our findings may be used to identify distinct middle cartilage slope values–-namely, about –6.2° in females, where decrease in risk from such procedures is maximized (Figure 3E). For males, although there were regions associated with nonlinear changes in risk, the overall effect of increased slope was small, which suggests a role for future investigations on the utility of slope-reducing osteotomies. Similarly, we speculate that identifying key values for AP laxity may be informative during and after ACL reconstruction, potentially providing postoperative displacement values that surgeons should target to reduce graft failure rates. For example, in males, there was a substantially lower probability (16.7%) of being ACL injured in those with AP displacement values below about 13 mm at baseline (Figure 4B). The finding in females that there is a substantial decrease in risk (17.5%) as lateral meniscus–bone wedge angle increases beyond about 28° (Figure 3D) may emphasize the importance of lateral meniscal repair as a means of maintaining wedge angle measurements that are associated with decreased risk. While notchplasty is not a regularly performed ancillary procedure in patients undergoing ACL reconstruction, this statistical modeling approach has the potential to change that by informing ideal notch widths to target postoperatively and identifying optimal candidates for the procedure. Further prospective studies are required to substantiate this speculation and ultimately identify relationships between the surgical targets described here and reinjury.
The “sequence of prevention” model for sports injury was first outlined by van Mechelen et al 38 and more recently highlighted by Hewett et al 17 in the context of ACL injury prediction and prevention. Accordingly, our findings can contribute to a multidisciplinary approach that involves creating a prognostic individualized screening tool for targeted injury prevention programs in athletes and other physically active populations. For example, knowing that an individual has AP laxity or geometric features that are associated with a marked increase in risk of ACL rupture could be used to identify those requiring focused training to reduce injury risk. Such programs include the 11+ (formerly FIFA 11+) 28 and a change-of-direction technique modification intervention. 11
Limitations
This study has limitations. The relatively small sample in the data set may result in noise-driven artifact and overfitting, which would reduce the generalizability of this underpowered statistical model. However, we limited the number of variables in our risk model to 6 to reduce the likelihood of overfitting. With a larger sample size, especially for male patients, it would be feasible to include interaction effects between variables. 23 Additionally, with more observations, the ability of the model to predict risk of ACL injury could be tested by removing a subset of the observations for validation. Although intratester reliability was demonstrated, future studies at larger scales can investigate intertester reliability of the standardized MRI segmentation method. While this work established associations, further work is required to establish predictive relationships. This work also relied on the use of previously documented risk factors. Incorporating additional intrinsic and extrinsic variables, such as psychological characteristics or neuromuscular landing mechanics, would possibly improve the generalizability of the model. Given the limited number of risk factors investigated in this study, there are most likely additional risk factors that require exploration. Furthermore, stochasticity presumably has some role, suggesting that some injuries may happen because of “bad luck” and are therefore not preventable. Including a sample from a broader geographic area, outside the northeastern United States, may also improve the generalizability of the model.
Another limitation was that data on injured athletes were collected after injury and before surgery. To address this, contralateral measurements were taken on the uninjured limb of injured athletes as a surrogate for the preinjury state since contralateral limbs exhibit a high level of symmetry. 32 Moreover, contralateral ACL injury is a risk factor for ipsilateral ACL injury, suggesting that there are no major differences between the right and left knees, even in those who experience ACL injury. 24,41 Finally, we assessed only AP laxity; coronal and axial plane laxities and pivot-shift grade were not included in this study and may be important to consider.
Conclusion
Our analysis using a GAM quantified AP laxity and knee joint geometry as combined risk factors for first-time, noncontact ACL injury in female and male high school and college athletes. Of the 6 variables studied, there was no single dominant geometric or laxity risk factor for ACL injury in the female or male cohort. Therefore, geometric and laxity risk factors likely act together to increase risk of noncontact ACL injury. Two risk factors—lateral meniscus–bone wedge angle in female patients and AP laxity in male patients—exhibited thresholds where a pronounced increase or decrease in risk of first-time, noncontact ACL injury occurred. These thresholds could provide targets for nonsurgical or surgical intervention.
Footnotes
Final revision submitted January 9, 2023; accepted January 27, 2023.
One or more of the authors has declared the following potential conflict of interest or source of funding: Funding was received from the National Institute of Arthritis and Musculoskeletal and Skin Diseases at the National Institutes of Health (grants R01AR050421 and R21AR073388), Gosnell Family, Steers Family, Ludwig Family, Clark Foundation, and Kirby Foundation. D.H.N. has received education payments from Arthrex, consulting fees from Linvatec and Newclip, and hospitality payments from Stryker. T.L.W. has received royalties from Stryker. A.D.P. has received research support from Stryker; consulting fees from DePuy, Exactech, Smith & Nephew, and Stryker; nonconsulting fees from Smith & Nephew; and royalties from Zimmer Biomet. A.D.P. also has stock/stock options in Engage. AOSSM checks author disclosures against the Open Payments Database (OPD). AOSSM has not conducted an independent investigation on the OPD and disclaims any liability or responsibility relating thereto.
Ethical approval for this study was obtained from the University of Vermont (CHRMS [Medical]: 19-0050).
Appendix
Multivariable logistic regression was performed using the uninjured knee of patients with ACL injuries and the corresponding knee of controls (α = .05) (Appendix Table A1). This was implemented using the Logit class from the Python open-source statsmodels library, employing the default Broyden-Fletcher-Goldfarb-Shanno algorithm for optimization. Odds ratios and 95% CIs describe the relationship between each variable and risk of ACL injury. Side-by-side comparisons of partial dependence plots for the 6 variables are included for females (Appendix Figure A1) and males (Appendix Figure A2).