
Abstract
Background:
Medial patellofemoral ligament (MPFL) reconstruction is a well-established procedure for the treatment of patients with patellofemoral instability (PFI) at low flexion angles (0°-30°). Little is known about the effect of MPFL surgery on patellofemoral cartilage contact area (CCA) during the first 30° of knee flexion.
Purpose/Hypothesis:
The purpose of this study was to investigate the effect of MPFL reconstruction on CCA using magnetic resonance imaging (MRI). We hypothesized that patients with PFI would have a lower CCA than patients with healthy knees and that CCA would increase after MPFL reconstruction over the course of low knee flexion.
Study Design:
Cohort study; Level of evidence, 2.
Methods:
In a prospective matched-paired cohort study, the CCA of 13 patients with low-flexion PFI was determined before and after MPFL reconstruction, and the data were compared with those of 13 healthy volunteers (controls). MRI was performed with the knee at 0°, 15°, and 30° of flexion in a custom-designed knee-positioning device. To suppress motion artifacts, motion correction was performed using a Moiré Phase Tracking system via a tracking marker attached to the patella. The CCA was calculated on the basis of semiautomatic cartilage and bone segmentation and registration.
Results:
The CCA (mean ± SD) at 0°, 15°, and 30° of flexion for the control participants was 1.38 ± 0.62, 1.91 ± 0.98, and 3.68 ± 0.92 cm2, respectively. In patients with PFI, the CCA at 0°, 15°, and 30° of flexion was 0.77 ± 0.49, 1.26 ± 0.60, and 2.89 ± 0.89 cm2 preoperatively and 1.65 ± 0.55, 1.97 ± 0.68, and 3.52 ± 0.57 cm2 postoperatively. Patients with PFI exhibited a significantly reduced preoperative CCA at all 3 flexion angles when compared with controls (P ≤ .045 for all). Postoperatively, there was a significant increase in CCA at 0° of flexion (P = .001), 15° of flexion (P = .019) and 30° of flexion (P = .026). There were no significant postoperative differences in CCA between patients with PFI and controls at any flexion angle.
Conclusion:
Patients with low-flexion patellar instability showed a significant reduction in patellofemoral CCA at 0°, 15°, and 30° of flexion. MPFL reconstruction increased the contact area significantly at all angles.
Instability in the patellofemoral joint is considered an interaction of pathologies that affect osseous geometry, soft tissue restraints, and dynamic muscle action. 5,7,15 In the low range of flexion, however, the soft tissue stabilizers, particularly the medial patellofemoral ligament (MPFL), are believed to be a key factor for the stabilization of patellar tracking. 29,31 The MPFL provides about 50% to 60% of the total patellar restraining forces at low knee flexion angles (the first 0°-30° of flexion). 6
Stabilizing surgery by means of MPFL reconstruction has therefore become very popular for the treatment of patients with low-flexion instability. 19 Although the procedure shows low rates of recurrent dislocations and good to excellent clinical results in the majority of cases, little is known about the effect of MPFL surgery on patellofemoral contact during low knee flexion. 7,13,20,24
Various methodological procedures have been used and developed to investigate patellofemoral joint kinematics and contact during flexion. 1,4,25,28 Since in vivo experiments are technically challenging, many biomechanical investigations have been carried out on cadavers, especially with force sensors and pressure-sensitive films. 1,11,22 However, magnetic resonance imaging (MRI) has been used to investigate patellofemoral kinematics and joint congruency in vivo. Techniques have been established to quantify the patellar and femoral cartilage surface and to successfully draw conclusions about the congruency of the patellofemoral joint in different weightbearing situations and flexion angles. 4,14,17,18,27 It has been shown in vitro and in vivo that the patellofemoral cartilage contact area (CCA) increases over the course of flexion. 1,4 Recent MRI studies have revealed that the CCA is lower in patients with patellofemoral instability (PFI) when compared with those with healthy knees but still increases over the course of flexion. 1,27 The importance of the CCA in patients with PFI has not been fully elucidated. There is also a lack of high-quality in vivo data on how MPFL reconstruction affects patellar kinematics and, specifically, how it affects patellofemoral contact. Given that PFI is related to altered patellofemoral kinematics and an alteration of the CCA, accurate measurements under in vivo conditions are required before clinical conclusions can be drawn.
In the present study, we investigated the effect of MPFL reconstruction on patellofemoral CCA using patient-individualized 3-dimensional (3D) joint models based on high-resolution 3-T MRI taken at different degrees of low knee flexion, before and after surgical stabilization. We hypothesized that patients with PFI would have lower CCA as compared with healthy knees and that CCA would increase after MPFL reconstruction over the range of low knee flexion.
Methods
In the present prospective matched-pair cohort study, patients with low-flexion PFI were evaluated before and after surgical treatment with MPFL reconstruction using autologous gracilis tendon grafts. MRI scans with the patient in a custom-designed knee brace were used to determine the patellofemoral CCA at 0°, 15°, and 30° of flexion. Comparative measurements using 3D cartilage and bone meshes were calculated in patients with PFI and participants with healthy knees. The study received institutional review board approval and was registered in the Clinical Trials Register (DRKS 00011408). All study patients voluntarily participated in the study, in accordance with the Declaration of Helsinki, and provided informed consent before participating.
PFI was diagnosed by clinical examination, anteroposterior radiographs of the lower extremity and axial patellar images, and diagnostic MRI scans. The CCA was defined as the patellofemoral cartilage region where the Euclidean distance between the 2 opposing cartilaginous surfaces was <1 mm. 12 This threshold has turned out to be most robust for obtaining contiguous CCAs without holes.
PFI Group
The patient group was identified from the waiting list for surgery using MPFL reconstruction and contacted by telephone or recruited directly during the ambulant consultation when surgery was indicated. Inclusion criteria consisted of symptomatic low-flexion PFI (in the range of 0°-30°) with indicated stabilizing surgery by MPFL reconstruction, age between 18 and 65 years, and no previous patellofemoral joint surgery. Exclusion criteria were a history of patellofemoral surgery, metallic material from previous knee surgery, pregnancy, retropatellar osteoarthritis, and claustrophobia.
A total of 29 patients with low-flexion PFI were identified. Of these patients, 21 were recruited for this study and examined by the MRI protocol. Three preoperative measurements had to be excluded owing to technical problems and undiagnosed claustrophobia and could not be repeated before the planned surgical intervention; thus, 18 patient scans were suitable for postoperative analysis. Of this group, 1 patient decided against surgical intervention, and 4 measurements were either terminated or could not be considered for further analysis because of severe MRI artifacts, resulting in 13 patients with suitable postoperative records (PFI group).
Healthy Volunteer Group
Volunteers were recruited through a public advertisement, our outpatient clinic, or personal contacts. To generate a reliable reference group of volunteers with healthy knees, the transepicondylar axis distance was determined as a parameter of knee size. Of 25 volunteers who initially agreed to participate as a healthy control group, 13 were matched to patients in the PFI group. Only healthy volunteers without a history of knee pain or trauma were included in the study. Figure 1 shows the patient enrollment process.
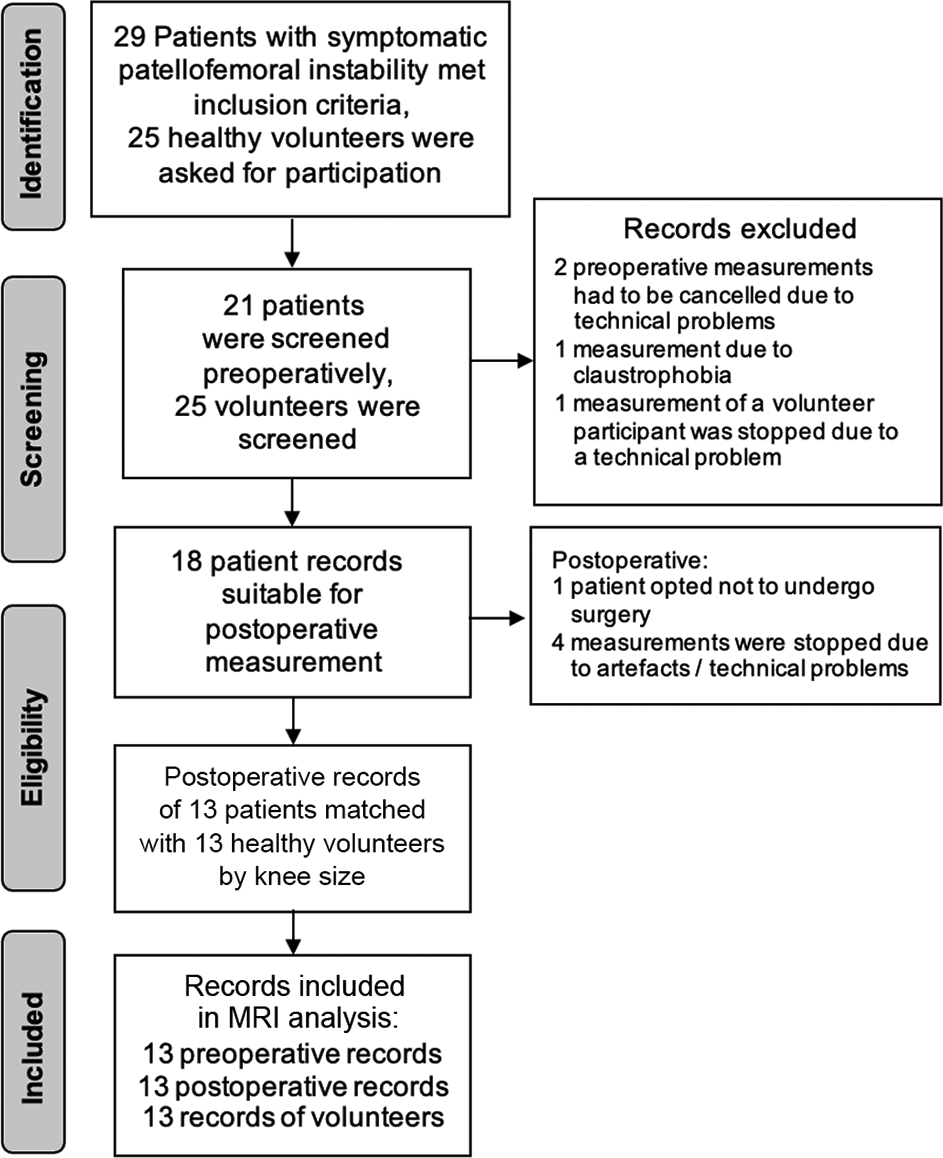
Patient inclusion process. MRI, magnetic resonance imaging.
Participant Characteristics
The mean ± SD age was 28.39 ± 8.10 years (range, 20.5-49 years) for the patients with PFI and 30.69 ± 6.55 years (range, 22.9-41.2 years) for the controls. For the PFI and control groups, the body mass index was 24.07 ± 3.23 (range, 19.80-28.90) and 22.12 ± 2.12 (range, 17.63-26.21), respectively, and the sex distribution was 53.8% and 61.5% female. The mean transepicondylar axis distance was 77.90 ± 6.39 mm for the PFI group and 78.48 ± 6.61 mm for the controls. An overview of the participant characteristics is presented in Table 1.
Patient Characteristics a

a Data are reported as mean ± SD or absolute values. PFI, patellofemoral instability; TEA, transepicondylar axis.
b Reference variable for matching.
MRI Scanning Protocol
In the PFI group, preoperative MRI scans were performed 2.39 ± 1.44 weeks before MPFL reconstruction and postoperative MRI scans 11.31 ± 5.63 weeks after. MRI scans were performed on a Magnetom Trio 3-T System (Siemens Healthineers) using an 8-channel multipurpose coil (NORAS MRI products) for signal reception (repetition time = 1.8 seconds, echo time = 59 milliseconds, receiver bandwidth = 504 Hz per pixel, scan duration = 6:20 minutes). A 3D turbo spin echo protocol with GRAPPA (generalized autocalibrating partial parallel acquisition) parallel imaging acceleration by a factor of 2 and an isotropic resolution of 0.5 mm was applied for the MRI scans. To mitigate motion artifacts, the sequence was augmented with prospective motion correction using a Moiré Phase Tracking system (Metria Innovation), which consists of a single camera attached to the top of the borehole and a single tracking marker taped to the patella. 17,21,30
To render the MRI setup as reproducible as possible, the participant was attached to the scanner bed with a weight-lifting belt, and the foot of the measured leg was placed in a custom-designed knee brace, 18 although without application of in situ loading. Measurements were performed at knee flexion angles of 0° (extension), 15°, and 30°. For the 0° and 15° scans, the knee was propped up with towels, while for the 30° measurement, it was stabilized with a foam-padded knee bolster.
Postprocessing and quantification of the data were performed using the browser-based customizable SATORI platform developed by Fraunhofer MEVIS. This graphic annotation and front-end analysis is based on the MeVisLab rapid prototyping environment for medical image analysis and visualization. The segmentation was initially performed manually for all images at 0° and then transferred to images from other flexion angles using a convolutional neural network and image registration.
To measure the CCA, accurate and consistent segmentation of the cartilage was needed. To achieve this, the following steps were taken 16 –18 :
The femoral and patellar bones and cartilages were manually segmented only for images at 0° of flexion (base image).
Based on available manual segmentation masks, a convolutional neural network known as U-Net was trained to segment bones in all the remaining images (flexion angle >0°). 23
For each of the 2 bones in the base image, the transformation matrix that rigidly aligns it to the image in the flexed knee position was computed as follows (note that this resulted in 2 transformation matrices for each image, one for aligning the femur and the other for patellar bone alignment):
○ Surface meshes of all the segmented patella and femur bone were computed from voxel masks (Figure 2).
○ A coarse transformation of the femur (or patella) at 0° of flexion to the flexed knee position was found using the iterative closest-point algorithm. 2
○ Given this coarse alignment, we used a rigid image registration of the 2 MRI scans with the normalized gradient field's distance measure to refine the bone alignments. 12 To align individual bones, the normalized gradient field evaluation was limited to a mask region, comprising the segmented bone of interest and a dilated (3 mm) region around it, ensuring that the bone contours were fully contained.
○ The resulting, refined transformation matrices were used to align the femur and patella at 0° of flexion to the corresponding bone in the flexed knee position.
Finally, the resulting transformation matrices were applied to the manually segmented cartilages in the base image and transferred to the images of the knee at the other flexion angles. These cartilage masks were then used for computing the CCA at the corresponding flexion angle.
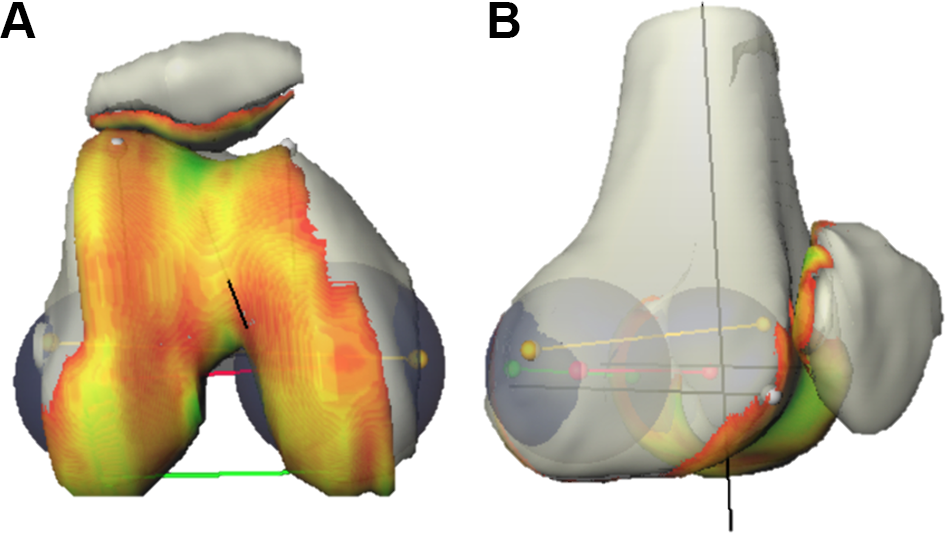
Three-dimensional mesh images of bone and cartilage structures demonstrate the (A) femoral and (B) patellar cartilage contact area. Yellow line, transepicondylar axis; red line, transcondylar axis; green line, posterocondylar axis.
The overall CCA was calculated as the arithmetic mean of the opposing patellar and femoral CCAs, which were very close to each other. In 1 patient, postoperative measurements at 0° and 15° of flexion could not be calculated. Therefore, that patient was excluded from analysis for those 2 angles.
Statistical Methods
The descriptive statistics are presented as mean and standard deviation. Differences between patients with PFI and volunteers were analyzed via the Wilcoxon rank sum test and differences between the paired subgroups via the Wilcoxon signed rank test. To test if the data were sampled from the same distribution, similarity in mean (P mean) and variance (P variance) was tested. Variance was tested using Levene's test. P < .05 was considered statistically significant.
Statistical analyses were carried out using SPSS Statistics (Version 28.0.0.0; IBM Corp). The results of the statistical tests were interpreted in an exploratory sense. No adjustment for multiple testing was performed in this exploratory study.
Results
The complete data sets for the 13 control participants and 13 patients with PFI before and after MPFL reconstruction were analyzed, with the exception of the postoperative measurements at 0° and 15° of flexion in 1 patient with PFI.
Patellofemoral CCA
Figure 3 shows the pre- and postoperative CCAs over the range of flexion for each patient in the PFI group, and Table 2 provides the mean CCAs for the PFI and control groups.
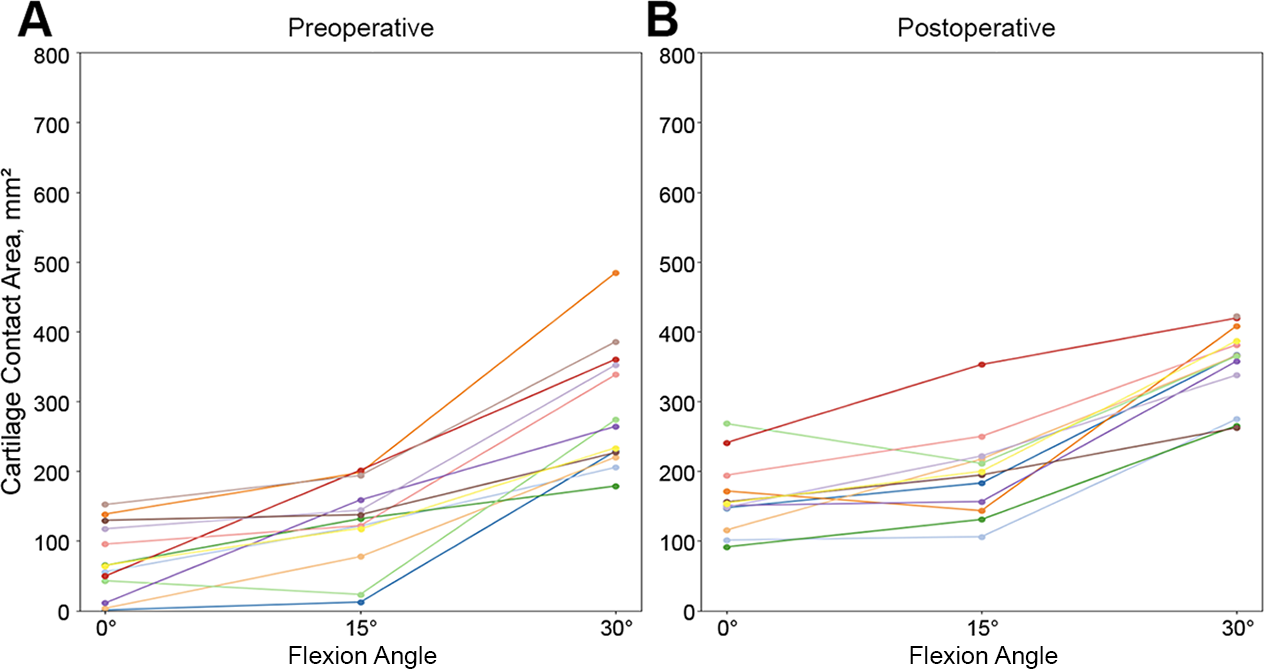
Cartilage contact area over the range of flexion from 0° to 30° in patients with patellofemoral instability: (A) preoperatively and (B) postoperatively. The postoperative measurements at 0° and 15° of flexion could not be calculated in 1 patient (gray line in panel A and gray dot in panel B) and were therefore excluded.
Comparison of Cartilage Contact Area of Patients With PFI and Controls According to Flexion Angle a
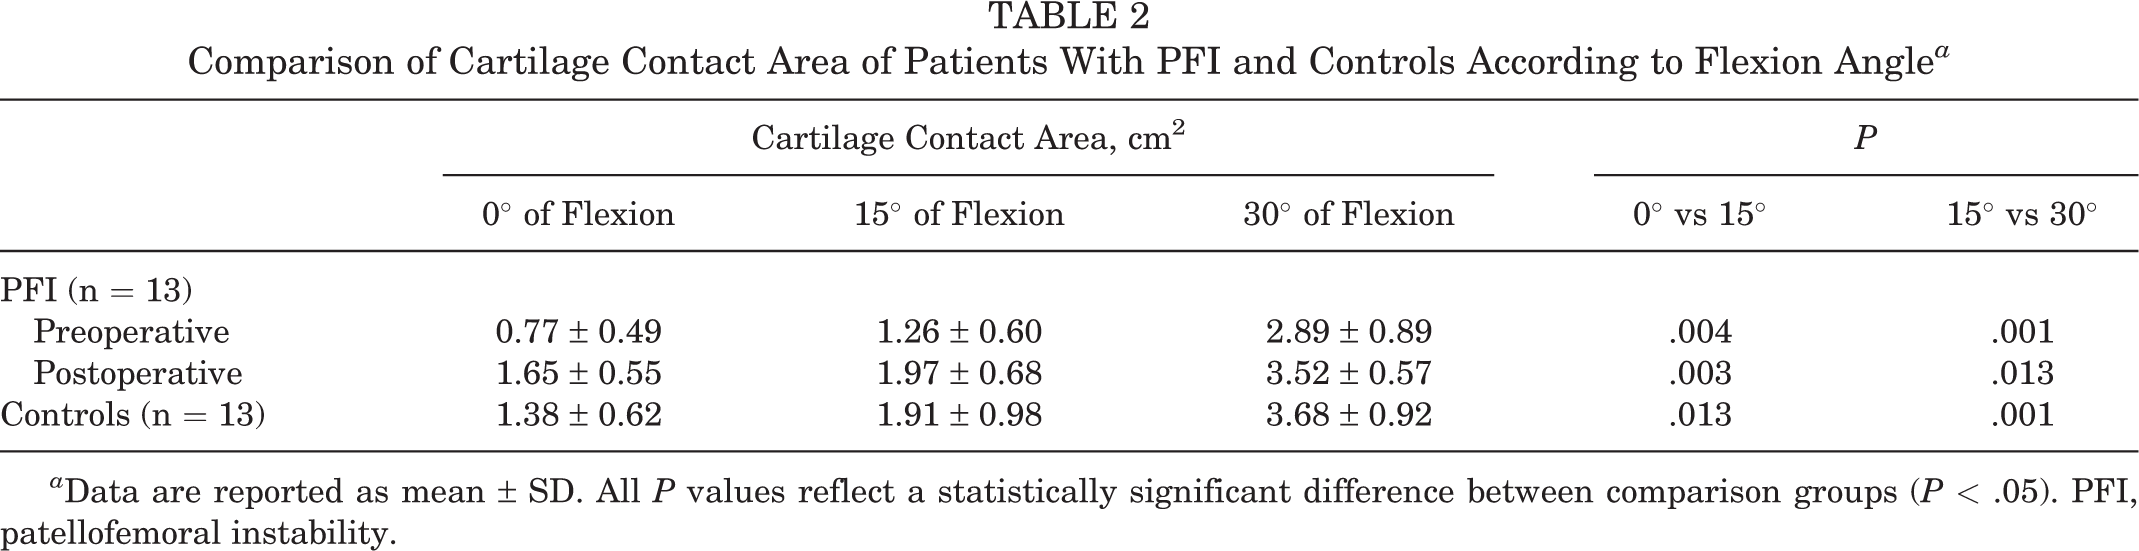
a Data are reported as mean ± SD. All P values reflect a statistically significant difference between comparison groups (P < .05). PFI, patellofemoral instability.
PFI Group
In the PFI group, there was a significant increase in preoperative CCA of 0.49 cm2 from 0° to 15° of flexion (P = .004) and a significant increase of 1.63 cm2 from 15° to 30° of flexion (P = .001). Postoperatively, significant increases in CCA were also seen over the course of flexion: 0.32 cm2 from 0° to 15° of flexion (P = .003) and 1.55 cm2 from 15° to 30° of flexion (P = .013). However, 1 patient (orange line in Figure 3) had a reduction in patellofemoral CCA in the course of low flexion when pre- and postoperative values were compared.
Control Group
In the volunteers with healthy knees, the mean CCA increased significantly over the course of flexion (0.53 cm2 from 0° to 15° [P = .013] and 1.77 cm2 from 15° to 30° [P = .001]).
Comparison of CCA Between Groups
When the preoperative CCA of the PFI group and the controls was compared, there were significant differences at 0° of flexion (mean difference, 0.61 cm2; P mean = .005, P variance = .583), 15° of flexion (0.65 cm2; P mean = .045, P variance = .102), and 30° of flexion (0.79 cm2; P mean = .029, P variance = .852) (Figure 4A). Within the PFI group, the mean differences in pre- to postoperative CCA were also significant at all flexion angles: 0.88 cm2 at 0° (P mean = .001, P variance = .863), 0.71 cm2 at 15° (P mean = .019, P variance = .760), and 0.63 cm2 at 30° (P mean = .026, P variance = .182) (Figure 4B). There were no significant differences in postoperative CCA between PFI and controls: –0.27 cm2 at 0° of flexion (P mean = .192, P variance = .538), –0.06 cm2 at 15° of flexion (P mean = .364, P variance = .205), and 0.16 cm2 at 30° of flexion (P mean = .322, P variance = .112) (Figure 4C).
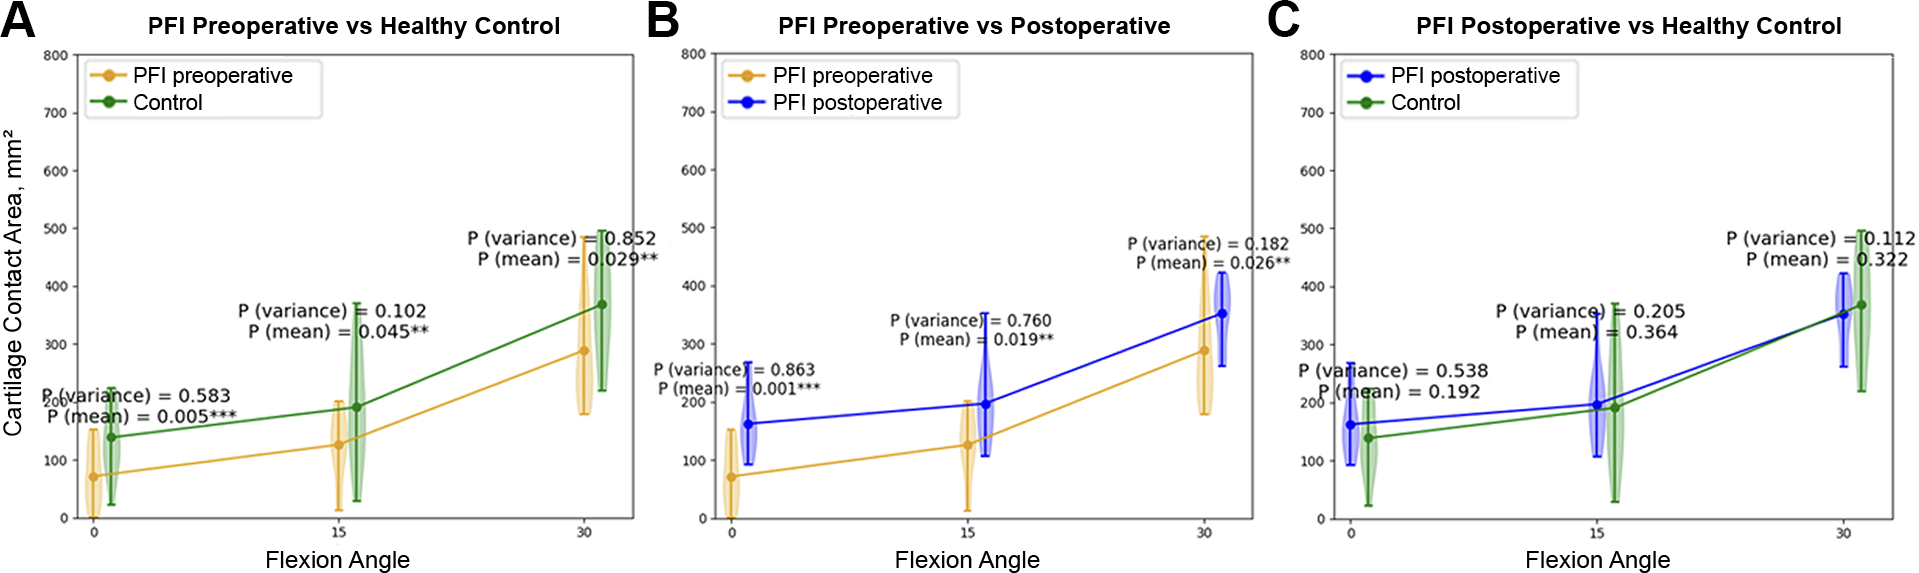
Violin plots of the cartilage contact area at 0°, 15°, and 30° of flexion show comparisons between (A) preoperative PFI and control values, (B) pre- and postoperative PFI values, and (C) postoperative PFI and control values. PFI, patellofemoral instability.
Discussion
The most important finding from the present study is that patients with low-flexion patellar instability show a significant reduction of the patellofemoral CCA at 0°, 15°, and 30° of flexion when compared with healthy volunteers. On average, MPFL reconstruction increases the contact area significantly over the range of motion (0°-30°). However, an increase of CCA was not observed in all patients.
Consistent with prior studies, the present study shows a significantly smaller patellofemoral CCA in patients with low-flexion PFI when compared with volunteers with healthy knees (0.77 ± 0.49 to 2.89 ± 0.89 cm2 vs 1.38 ± 0.62 to 3.68 ± 0.92 cm2) at low knee-flexion angles (0°-30°). 1,4,22,27 Clark et al 4 recently presented a study measuring the congruency of the patellofemoral joint via loaded dynamic MRI in 5-mm axial sequences using the patellofemoral CCA across different degrees of low flexion (0°-40°). A reduction in CCA for patients with PFI was also observed in that case series, which supports our observations. The CCA increased over the course of flexion in patients with PFI, as well as in a healthy control group. 4 Similar observations were made in the present study. Given the engagement of the patella in the trochlear groove at about 30° of knee flexion, the patellar tracking mechanism changes from predominantly soft tissue, especially ligamentous restraints, to increasingly osseous tracking because of the bony geometry of the trochlea, which may be causal for this observation. 5,7,15
The reconstruction of the MPFL led to a significant increase in the CCA in the present study at 0° of flexion (0.88 cm2; P = .001), 15° of flexion (0.71 cm2; P = .019), and 30° of flexion (0.63 cm2; P = .026). Thus, MPFL reconstruction resulted in the significant improvement of patellofemoral congruency at low angles of knee flexion. In 2021, Stevens et al 27 reported an increase of the patellofemoral CCA when comparing patients before and after patellofemoral stabilizing surgery (including trochleoplasty, tibial tubercule osteotomy, and MPFL reconstruction), using axial 5-mm slices in loaded dynamic MRI. The greatest differences were shown over a range of 11° to 20° (1.80 vs 3.45 cm2; P = .01) in active flexion. However, no analytic distinction between the methods was made in their analysis. In our assessment, the largest surgery-induced CCA change was seen at 0° of flexion. We attribute this observation to the fact that the least soft tissue tension is applied to the patella in the unloaded 0° knee position; therefore, the greatest increase in CCA is seen in knee extension postoperatively. Comparing the postoperative CCA at 0° of flexion between patients with PFI and controls, there was a tendency for values in the PFI group to be larger than in the control group (1.65 ± 0.55 vs 1.38 ± 0.62 cm2), although the difference was not statistically significant (P = .192). At 15° and 30° of flexion, the CCAs were highly similar (P = .364 and .322, respectively).
We can therefore conclude that in the collective studied, a significant change in CCA was demonstrated after stabilizing the patellofemoral joint with MPFL reconstruction, although complete normalization was not achieved in all participants. For a complete understanding of how MPFL reconstruction affects patellofemoral kinematics and especially the contact area and to identify patients who would benefit from concomitant surgical procedures, it is important to analyze further factors and parameters in loaded and unloaded situations in vivo. MRI studies have recently gained attention in this regard, with importance of in vivo assessment of the patellofemoral joint. 8,9 Patellofemoral maltracking during flexion can thus be quantified with MRI.
The need for further high-resolution MRI studies remains to gain more insight into the patellofemoral kinematic features after MPFL reconstruction. In the present study, a semiautomatic deep learning convolutional neural network was used to quantify the cartilage surface of the femur and patella and to generate the patellofemoral CCA using 3D meshes. 18 As recently shown for the evaluation of trochlear dysplasia, as well as for other 3D bodies given their complexity, 3D analysis seems to be an accurate tool for the determination of 3D structures and surfaces, 3,10,26 leading to precise clinical diagnostics and assessments.
Limitations
One of the limitations of this study is the small sample size. There was a high screening failure rate, which contributed to the small total number of patients. The results should therefore be understood as exploratory and may vary for larger study populations. Because of the small sample size, we could not determine how trochlear dysplasia, tibial tubercle–trochlear groove offset, patella alta, and other potentially important factors might have affected the relationship of instability and surgery with CCA.
One of the disadvantages of dynamic MRI, something faced by other researchers, 27 is the issue of motion artifacts. To mitigate this, we used prospective motion correction. 21,30 Essentially, there are restrictions in the range of motion, which are caused by the physical constraints of an MRI scanner. In our assessment, however, this did not have a negative effect, since our range of movement was limited to 0° to 30° and the MPFL does not seem to have a large influence on patellar tracking above 30° of knee flexion. In this study, the convolutional neural network model was trained only for automatic segmentation of bones and not for the cartilages. While automatically segmented bone masks were used only indirectly for a coarse alignment of the images, cartilage masks were the basis for computing CCA at every flexion angle, so a much more accurate cartilage segmentation was needed. Based on the existing number of samples in the database, this level of accuracy could not be achieved with an automatic segmentation model. To overcome this, we chose to use the described bone registration to transfer the manually segmented cartilages from the base image to the images of the knee at 15° and 30°.
Conclusion
Overall, there was a significant increase in patellofemoral CCA after MPFL reconstruction at 0°, 15°, and 30° of flexion, with the greatest overall increase observed in the extension position. A significant increase in CCA over increasing flexion was observed in patients with unstable patellofemoral joints pre- and postoperatively, as well as in the volunteers with healthy knees.
Footnotes
Acknowledgment
Thomas Günter, Waldemar Schimpf, and Gerd Strohmeier are gratefully acknowledged for building the pneumatic loading device.
Final revision submitted December 1, 2022; accepted January 19, 2023.
One or more of the authors has declared the following potential conflict of interest or source of funding: Support was received from Deutsche Forschungsgemeinschaft (grants LA 3353/4-1, IZ 70/2-1, ME 4202/3-1), the National Institutes of Health (grant 2R01DA021146), and the Oskar-Helene-Heim Foundation. AOSSM checks author disclosures against the Open Payments Database (OPD). AOSSM has not conducted an independent investigation on the OPD and disclaims any liability or responsibility relating thereto.
Ethical approval for this study was obtained from Albert Ludwigs University of Freiburg (No. 443/16).