
Abstract
Background:
It is not known mechanistically whether a steeper lateral posterior tibial slope (LTS) leads to an increase in anterior tibial translation (ATT) as well as internal tibial rotation (ITR) during a given jump landing.
Hypothesis:
A steeper LTS will result in increased ATT and ITR during simulated jump landings when applying knee compression, flexion, and internal tibial torque of increasing severity.
Study Design:
Descriptive laboratory study.
Methods:
Seven pairs of cadaveric knees were harvested from young male adult donors (mean ± SD; age, 25.71 ± 5.53 years; weight, 71.51 ± 4.81 kg). The LTS of each knee was measured by a blinded observer from 3-T magnetic resonance images. Two sets of 25 impact trials of ∼700 N (1× body weight [BW] ±10%) followed by 2 sets of 25 trials of 1400 N (2× BW ±10%) were applied to a randomly selected knee of each pair. Similarly, on the contralateral knee, 2 sets of 25 impact trials of ∼1800 N (2.5× BW ±10%) followed by 2 sets of 25 trials of ∼2100 N (3× BW ±10%) were applied. Three-dimensional knee kinematics, including ATT and ITR, were measured at 400 Hz using optoelectronic motion capture. Two-factor linear mixed effect models were used to determine the relationship of LTS to ATT and ITR as impact loading increased.
Results:
As LTS increased, so did ATT and ITR during increasingly severe landings. LTS had an increasing effect on ATT (coefficient, 0.50; 95% CI, 0.29-0.71) relative to impact force (coefficient, 0.52; 95% CI, 0.50-0.53). ITR was proportional to LTS (coefficient, 1.36; 95% CI, 0.80-1.93) under increasing impact force (coefficient, 0.49; 95% CI, 0.47-0.52). For steeper LTS, the increase in ITR was proportionally greater than the increase in ATT.
Conclusion:
In male knee specimens, a steeper LTS significantly increased ATT and ITR during jump landings.
Clinical Relevance:
Increases in ITR and ATT during jump landings lead to increased strain on the anterior cruciate ligament and are therefore associated with greater risk of ligament failure.
Keywords
Approximately 200,000 anterior cruciate ligament (ACL) ruptures occur in the United States every year 8,25 with most being noncontact injuries. 29 Video analyses have shown that many of these occur during a dynamic foot plant from a jump landing, a sudden change in direction, an abrupt stop, or “dynamic valgus.” 32,39 Environmental, anatomic, hormonal, and neuromuscular factors 9,24 have all been considered to play a role in the injury. In terms of the anatomic factors, particular attention has been paid to individual and sex-based differences. 1,17,35,37,41 The most significant morphologic risk factors associated with noncontact ACL injuries are an increased lateral posterior tibial slope (LTS), a larger femoral alpha angle, a smaller ACL cross-sectional area, and a smaller femoral intercondylar notch. 1,3,4,14,15,33,37,38,41 In particular, a steeper LTS has been shown to increase the risk for not only ACL rupture but also ACL strain during knee loading, 5,7 thereby suggesting a causal relationship. However, the relationship between LTS and the resulting tibiofemoral kinematics in the form of anterior tibial translation (ATT) and internal tibial rotation (ITR) during a dynamic foot plant is poorly understood.
Because the ACL acts as a kinematic constraint to excessive ATT and ITR, 20,36 there is considerable orthopaedic interest in normal and abnormal knee joint motion when evaluating the possibility of ACL injury. For example, attention is often focused on looking for an abnormal pivot shift during the Lachman test, 13,30 a larger-than-normal ATT during the anterior drawer test, 13,30 and whether substantial laxity is found in ITR. 36 Experimental studies of simulated pivot landing in cadaveric knees have measured the peak ACL strains in ATT and ITR as well as the effect of ACL transection. 18,27,28 But none of the studies have examined the relationship between LTS and the resulting ATT and ITR during an impulsive knee compression loading simulating a pivot landing. Under knee joint axial compression, the anterior patellofemoral joint–reaction force component acting in the transverse plane on the LTS has 2 possible kinematic effects on the tibia relative to the femur, causing (1) ATT and (2) ITR relative to the instantaneous center of rotation near the central depression in the medial tibial plateau. 19,21
The purpose of this study was to quantify the relationship of LTS to ATT and ITR during jump-landing loadings involving the application of impulsive knee compression, flexion, and internal tibial torque loading. We tested the hypothesis that a larger LTS correlates with increasing ATT and ITR during simulated pivot landings, each of which has been shown to increase ACL strain 18,27,28 and is therefore associated with the risk of ACL failure. 18
Methods
Specimen Procurement and Preparation
After our institutional review board determined the study to be exempt from approval, we procured fully deidentified, unembalmed young male adult cadaveric knees from Anatomy Gifts Registry, Science Care, Medcure, and Gift of Life Michigan. Limbs were double bagged and stored in a freezer at –20°C. Parasagittal radiographs were first taken of 14 pairs of knees to estimate the LTS, from which 7 pairs were selected to provide the widest possible range of slopes in our sample. Care was taken to obtain a purely lateral view of the proximal tibia. The LTS was measured on the radiographs as the angle between the longitudinal axis of the tibia and a line connecting the superior-anterior and superior-posterior cortices of the tibial plateau; the longitudinal axis was estimated using a circle method presented by Hudek et al. 11
The 7 pairs of young male knees (mean ± SD; age, 25.71 ± 5.53 years; weight, 71.51 ± 4.81 kg) (Table 1) were thawed at room temperature for 48 hours before dissection and imaging. Thawed knees were dissected, leaving intact the ligamentous capsular structures with the tendons of the quadriceps, medial and lateral hamstrings, and medial and lateral gastrocnemius muscles. The distal tibia/fibula and proximal femur were cut 20 cm from the center of the knee joint and potted in polymethylmethacrylate cylinders ready for mounting in the testing apparatus.
Demographic Data for the Male Donors of the 7 Pairs of Knees a

a BW, body weight; LTS, lateral posterior tibial slope.
b The repeated measures experimental design called for increasing impact forces, with 1 knee in each pair randomly selected to be loaded under low impact while the contralateral knee was subjected to relatively high-impact loading.
c Because of a technical error, inaccurate kinematic data were collected during the first 50 trials.
d Testing was halted after 23 trials owing to fatigue fracture of bone under the anterior cruciate ligament tibial enthesis.
Magnetic Resonance Imaging
Before impact testing, T2-weighted 3-dimensional (3D) sagittal-plane magnetic resonance images were taken of the 7 pairs of thawed cadaveric knees with a 3-T scanner (Philips Healthcare). From these images, the LTS was measured in each specimen in OsiriX software (Version 3.7.1 Lite, open source) according to the method presented by Hudek et al. 11 Briefly, in the sagittal plane, the longitudinal axis of the tibia was defined by a straight line connecting the center of the 2 circles drawn within the proximal tibia: a first circle was drawn whose lines were in contact with the anterior, posterior, and superior tibial cortex bone, and a second circle was drawn whose center was positioned on the first circle touching the anterior and posterior cortex of the tibia (Figure 1A). On the sagittal-plane slice of the mediolateral center of the lateral tibial plateau, a line was drawn connecting the superior-anterior and superior-posterior cortices of the lateral tibial plateau (Figure 1B). The LTS was calculated as the angle between this line and a line perpendicular to the longitudinal axis of the tibia.
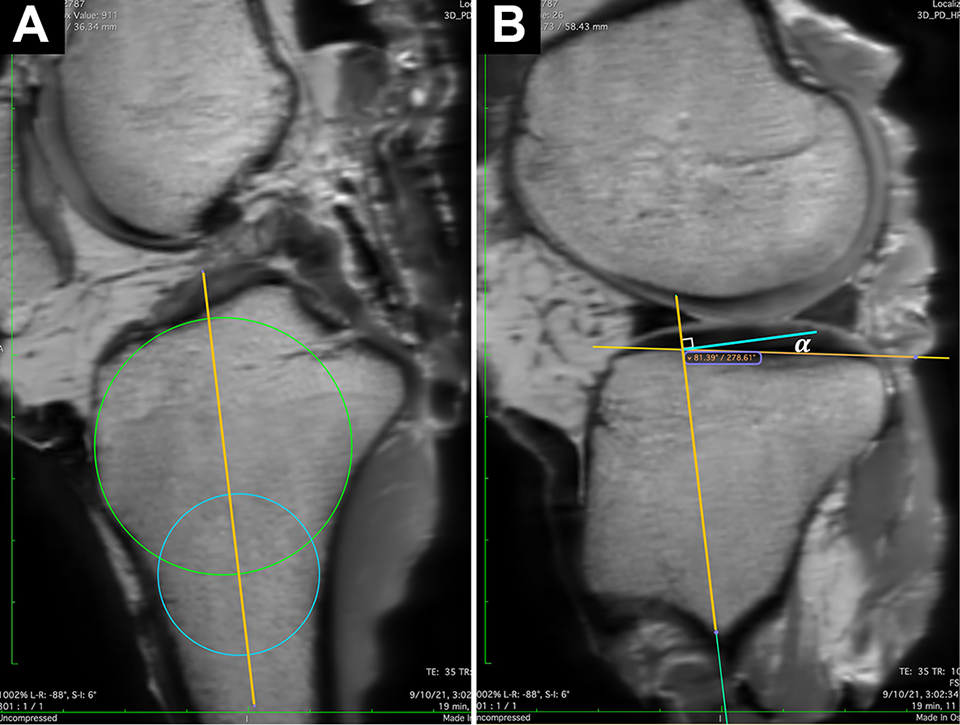
Measured LTS for the right knee of specimen P1. (A) To define the tibial longitudinal axis, a method presented by Hudek et al 11 was used on a sagittal-plane slice by connecting the centers of the 2 circles. (B) At the mediolateral center of the lateral tibial plateau, the LTS (α) was defined as the angle between the tibial longitudinal axis as defined in panel A and the line connecting the superior-anterior and superior-posterior cortices of the lateral tibial plateau. LTS, lateral posterior tibial slope.
To assess measurement reliability, the LTS on each knee was measured by 2 observers (S.Y.B. and M.L.B.) who were blinded to the results of the kinematics; the mean of the 2 measurements was used for analysis (Table 1). Each observer measured the LTS twice at least 1 week apart. The intra- and interrater reliability values were calculated using the intraclass correlation coefficient (ICC).
Testing Apparatus
The dissected knees were mounted in the Withrow-Oh 18,28 testing apparatus (Figure 2) in an initial configuration of 15° of knee flexion to simulate a single-leg pivot landing with 1- to 3-times body weight [BW]. The weight (W in Figure 2) was dropped to impact a bumper on the tibial end of the construct to apply the combination of an impulsive compression load and an internal tibial torque both peaking within ∼70 milliseconds via the torsional transformer mechanism (T in Figure 2). Use of the weight drop achieves a higher loading rate and larger impulsive load than a robot to properly match values observed in vivo. 23 The quadriceps, medial, and lateral hamstring and medial and lateral gastrocnemius muscle forces were simulated by tensioning to the appropriate value to represent the active muscle force needed to maintain 15° of knee flexion before impact, and their tensile stiffness, after impact, was represented by the elasticity of 2 mm–diameter woven nylon cords 42,43 after impact. To accomplish this, cryoclamps (Q, G, and H in Figure 2), each with a series force transducer, were attached to each tendon and pretensioned as follows: quadriceps (Q, 180 N), hamstrings (H, 70 N each), and gastrocnemius (G, 70 N each). As the weight impacted the construct, the knee could flex and the tibial plateau was free to translate and internally rotate, resisted only by soft tissues and the muscle surrogates, which could stretch under the rapidly rising knee compression, flexion moment, and internal tibial torque.
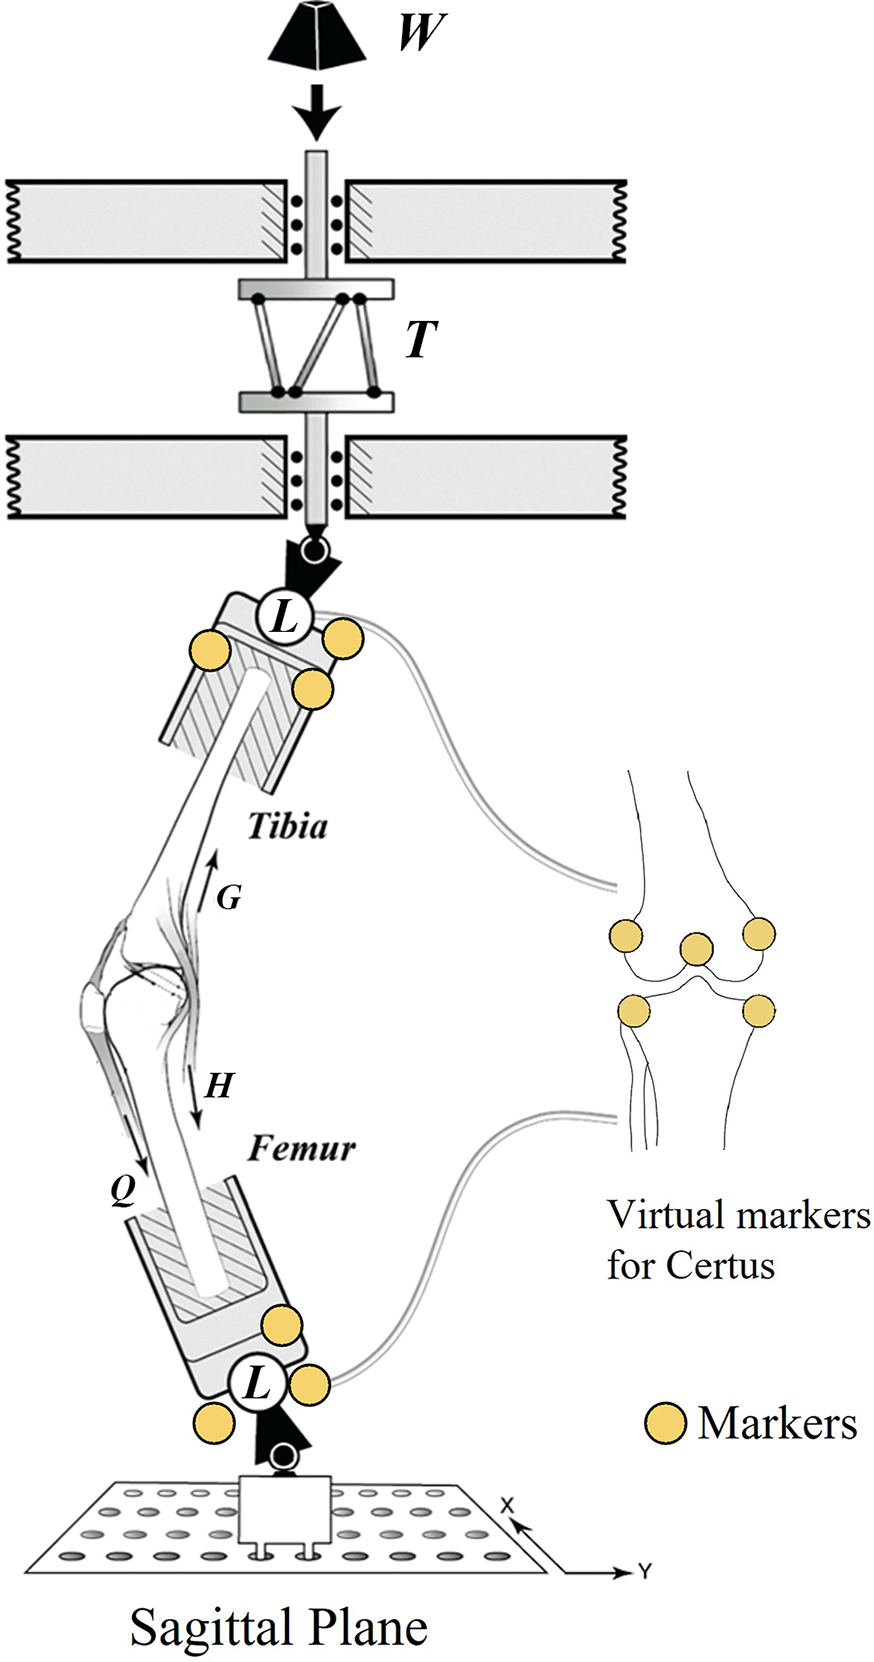
Diagram of the Withrow-Oh testing apparatus 18,28 shows the diode physical markers on the load cells as well as the virtual markers on the tibial and femoral landmarks (right) that were recorded using the 3-dimensional digitizing wand of the Certus system (yellow circles). L denotes 6-axis load cell, while Q, G, and H respectively denote the simulated quadriceps, gastrocnemius, and hamstring muscle tensile stiffnesses. T, torsional transformer mechanism; W, weight.
Two 6-axis load cells (MC3A-1000; AMTI) (L in Figure 2) measured the 3D applied input forces and moments to the knee at the midtibia, as well as the 3D reaction force and moments at the midfemur. Impulsive forces and moments were recorded at 2 kHz, while the 3D tibiofemoral marker triad kinematics were recorded at 400 Hz with an optoelectronic imaging system (Optotrak Certus; Northern Digital Inc). A triad of 3 markers was affixed rigidly to each load cell, and a 3D digitizer was used to identify anatomic landmarks on the knee joint (“virtual marker” in Figure 2). From this setup, the 3D tibiofemoral kinematics were acquired. The absolute and relative 3D translation and rotation were then calculated according to Grood and Suntay. 10
Testing Protocol
A cross-sectional repeated measures experimental design was used to examine the relationship between LTS on the one hand and ITR or ATT on the other under increasing impact loading severity. It had already been shown with this apparatus that repetitive loads with a magnitude of ≥3-times BW (3× BW) to simulate pivot landings caused the human ACL to fail under ≥100 loading cycles owing to material fatigue. 18,28 So we planned to repetitively load the knees with loads less than this magnitude to avoid such failure. First, each specimen underwent 5 preconditioning trials to find the drop height and weight to simulate the target peak impulsive force on that knee (Table 1). Then the knee was subjected to a maximum of 100 loading trials or as many trials as could be completed until the ACL failed. Repetitive loading was used because of the inherent intra- and intersubject variability in the response of biological tissues to load-displacement testing. 6,31 Therefore, a randomly selected knee from each pair was tested in 2 sets of 25 impact trials applied with ∼700 N (1× BW ±10%), after which 2 more sets of 25 trials were applied with ∼1400 N (2× BW ±10%). Similarly, each contralateral knee was tested with 2 sets of 25 impact trials with ∼1800 N (2.5× BW ±10%), followed by 2 more sets of 25 trials with ∼2100 N (3× BW ±10%), to study how the magnitude of ATT and ITR depended on the magnitude of LTS under a range of loading magnitudes. Between each set of 25 trials, the quadriceps clamp was recooled using cryogenic gas to prevent slippage. Our simulated jump landing synchronized impulsive knee flexion and internal tibial moments with an impulsive axial compression force.
Statistical Analysis
After checking that the usual assumptions were met, two 2-factor linear mixed-effect models were used to determine the simultaneous effects of LTS on ATT (model A) and LTS on ITR (model B) during increasing impact loading. The knee specimen (n = 7) and side of the knee (right and left) were considered random effects, while the normalized impact force (IF) by BW (IF/BW) and LTS were considered fixed effects. Random intercepts were chosen from the linear mixed model with ATT, ITR, and LTS to reflect ATT and ITR being assigned values of zero in the absence of a landing IF and all values under load being calculated relative to those starting values. The linear mixed models were analyzed with the lme4 package using the open software RStudio for statistical computing (R Version 4.1.2). The underlying assumptions were satisfied after checking the residuals versus fitted values and the quantile-quantile plot for each model. An alpha level of 0.05 (P < .05) was used to calculate results for the random and fixed effects.
The simr package used for the power analysis suggested that the planned sample size was acceptable. With the number of knee specimen pairs (n = 7) and side of the knee (right and left), it showed a power of 100% (95% CI, 96.4%-100%) for the effect of LTS on ATT and 99.0% (95% CI, 94.6%-100%) for the effect of LTS on ITR. This seemed reasonable given our random effect size (n = 13): 7 pairs of knee specimen, side of the knee (right and left), and 1 failed knee. Significant P values (P < .001) were found for all the linear mixed model coefficients, lending credence to the results.
Results
The intrarater reliability of the LTS measurements was excellent (ICC = 0.93), and the interrater reliability was good (ICC = 0.81). A steeper LTS had a significant effect on ATT and ITR as IF/BW was increased (P < .001 for both) (Table 2, Figures 3 and 4). The ATT was positively correlated with increasing LTS, with a coefficient of 0.50 (95% CI, 0.29-0.71) independent of IF and a coefficient of 0.52 (95% CI, 0.50-0.53) with normalized IF. The ITR also had a positive correlation with increasing LTS, with coefficients of 1.36 (95% CI, 0.80-1.93) independent of IF and 0.49 (95% CI, 0.47-0.52) for normalized IF. The random term significantly affected the response (ie, the 95% CIs did not include zero).
Results for the 2 Linear Mixed Effect Models a

a All P values reflect statistical significance (P < .05). ATT, anterior tibial translation; BW, body weight; IF, impact force; LTS, lateral posterior tibial slope.
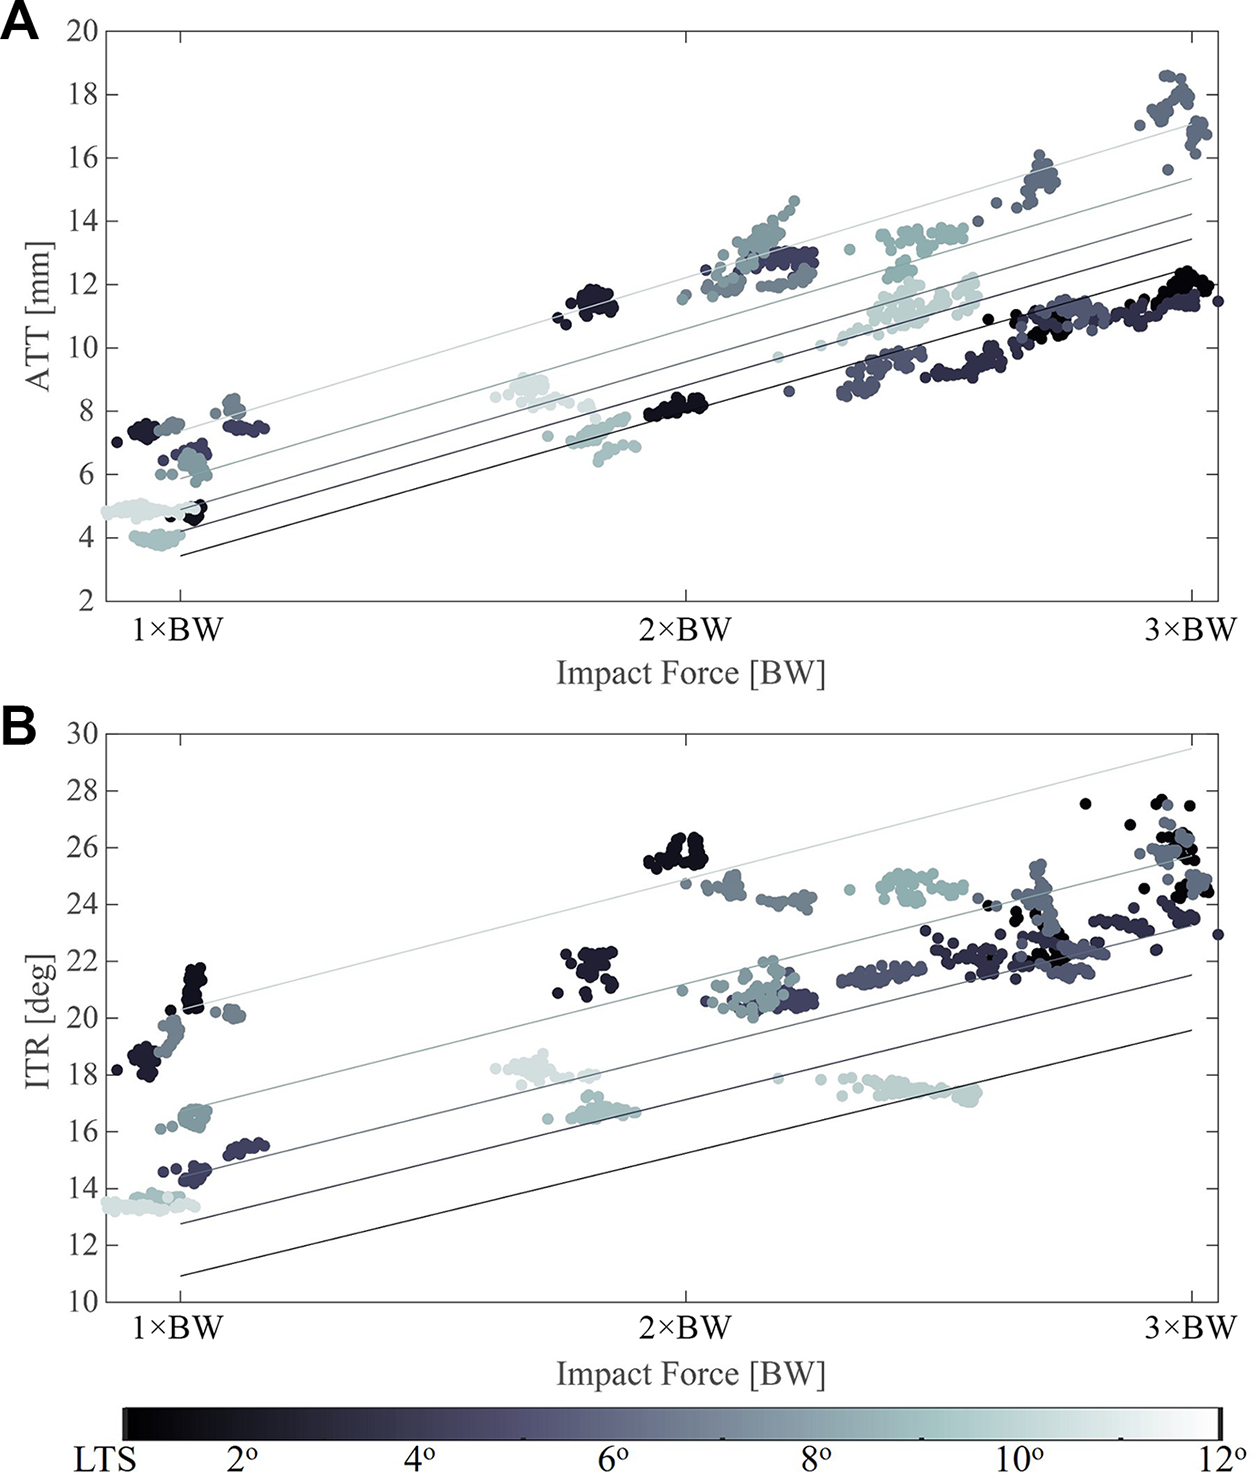
Scatter plots show the relationship of normalized impact force to (A) ATT and (B) ITR. The lines in each plot indicate the predicted effect of LTS being assumed constant at 2°, 4°, 6°, 8°, and 10° to help interpret the effect of increasing impact force on ATT and ITR from the results of the linear mixed model (Table 2). ATT, anterior tibial translation; BW, body weight; ITR, internal tibial rotation; LTS, lateral posterior tibial slope.
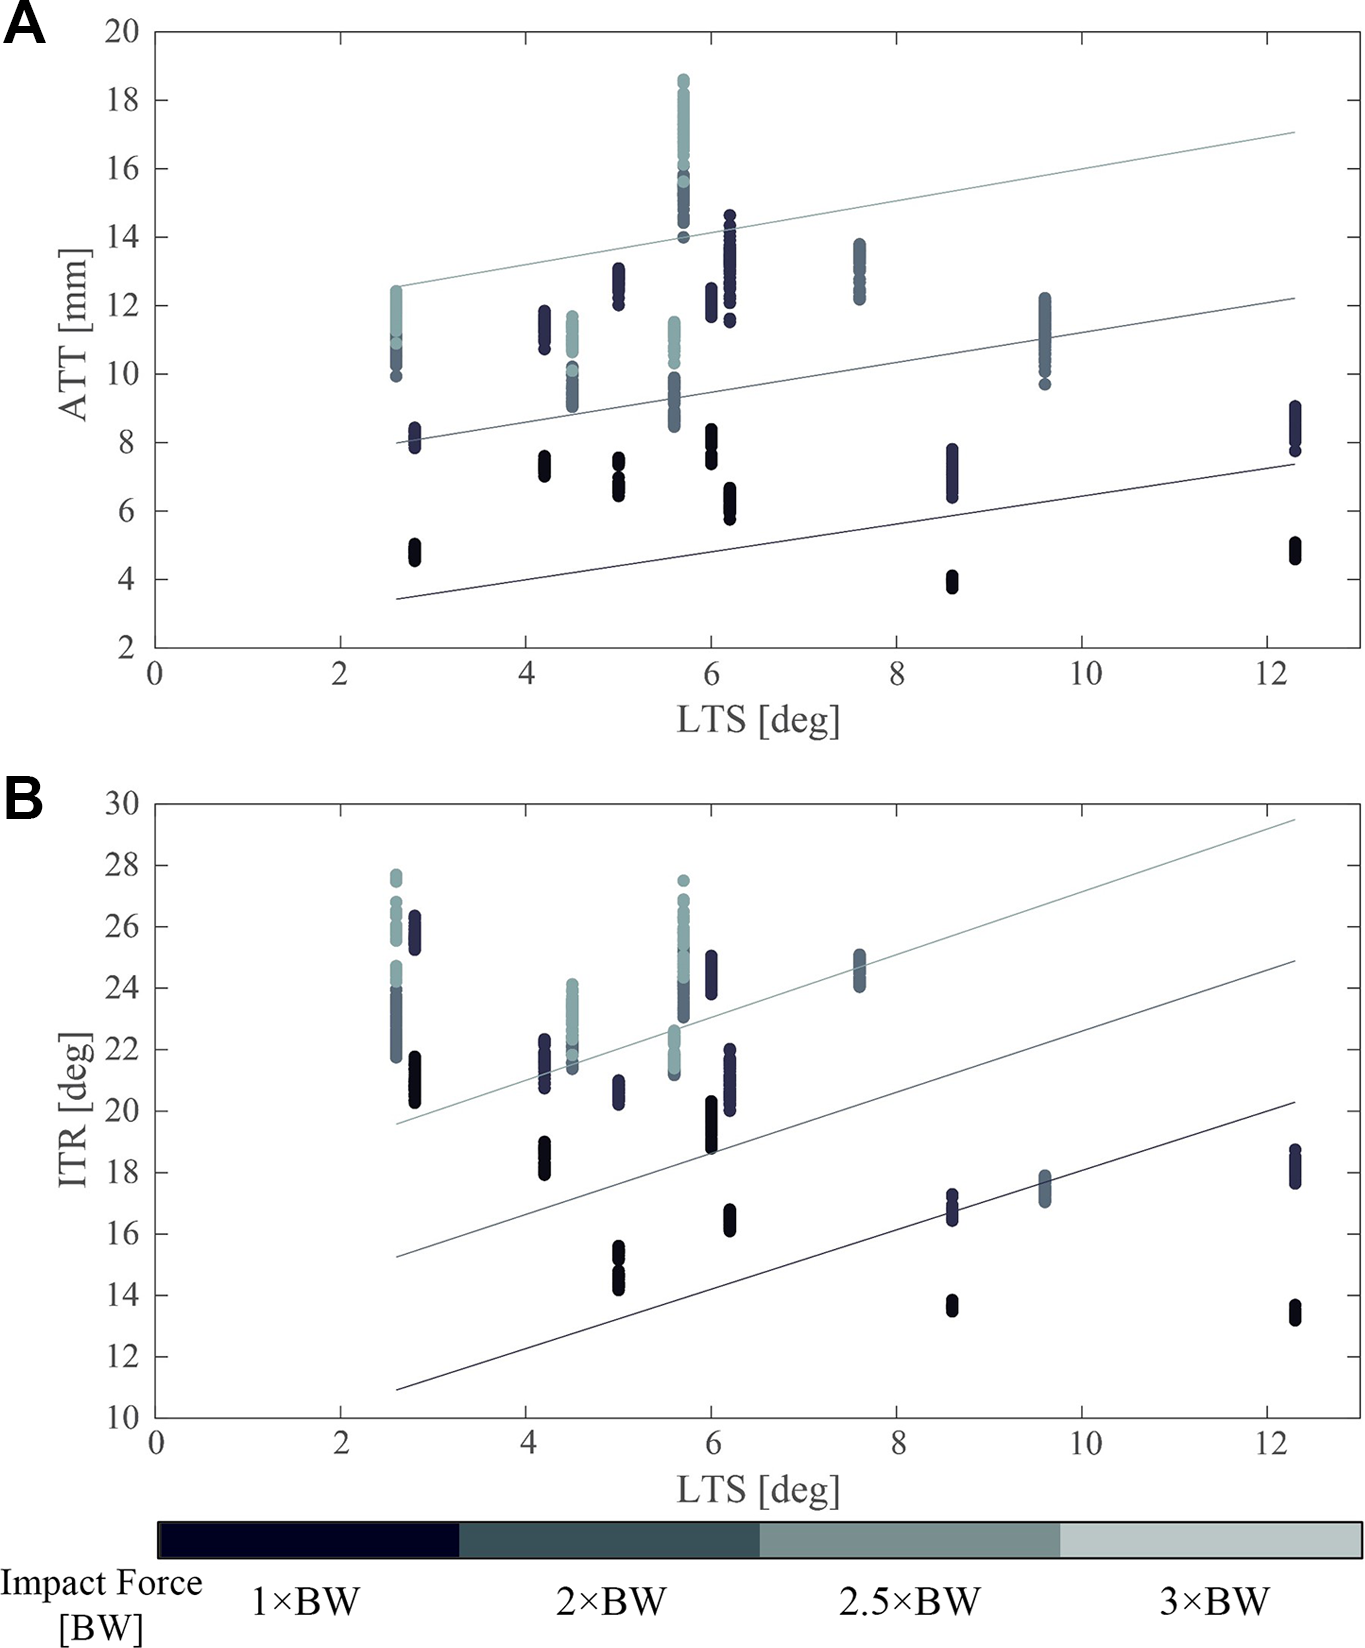
Scatter plots represent the relationship of LTS to (A) ATT and (B) ITR. The 3 lines in each plot designate normalized impact. The vertical data scatter are the knee kinematic data for the 100 trials for a given LTS associated with each knee. The lines show the force assumed constant at 1×, 2×, and 3× BW to help interpret the effect of LTS on ATT and (ITR) from the results of the linear mixed model (Table 2). ATT, anterior tibial translation; BW, body weight; ITR, internal tibial rotation; LTS, lateral posterior tibial slope.
Discussion
The study results support the primary hypothesis that knees with larger LTSs are significantly associated with increased ATT and ITR in a loaded condition. Given that Oh et al 28 already demonstrated that ACL strain is positively correlated with ATT and ITR, the present results suggest that an athlete with a steeper LTS will systematically experience larger loads on the ACL during jump landings than a similar-sized athlete with a lower LTS performing an identical jump landing. For a given load on the ACL, the strain will depend on its cross-sectional area and viscoelastic material properties. The underlying mechanism for the increase in ATT is that, under the impulsive compression loading, the LTS causes a reaction force component (equal to the inverse of the tangent of the LTS angle; see introduction) that accelerates the tibia anteriorly relative to the femur and thereby strains the ACL. 28
Simultaneously, the LTS causes a reaction force component on the lateral tibial condyle that results in a transverse plane moment that causes the tibial plateau to pivot around an axial instantaneous center of rotation on the medial condyle. 12 Both effects will strain the ACL. Furthermore, these results are consistent with previous studies. For example, Wang et al 40 reported that the magnitude of ATT and ITR produced under an axial knee compression force was positively correlated with the sagittal tibial slope, and McLean et al 21,22 found that a greater LTS was associated with anterior tibial acceleration and peak anterior knee joint reaction force, which were directly proportional to ACL strain.
The strengths of this study include the use of a simulated 3D impulsive lower leg loading that is similar to that during a 1-foot pivot landing. 28 Under those conditions, the ground-reaction force can reach many times BW depending on the compliance of the shoe and ground surface. 2 The use of repetitive loading is justified because many athletic training drills for the sports most associated with ACL injuries 18,44 —namely, basketball, soccer, football, and volleyball—require repetitions. Additionally, because only young male knees were studied, there were no confounding effects of age, osteoarthritis, trauma, or sex. 16,26
The limitations of the study include the use of cadaveric knees with representative muscle forces in lieu of in vivo experiments; accurate biplanar radiographic kinematic measures are feasible for the latter and could be used to confirm or refute the present findings. A further limitation is that we used only male knees because of a lack of a sufficiently large sample of young female knees to be able to study sex differences, so this could be a goal for future studies. However, tibial slope is already known to be a significant risk factor for ACL injuries in women, 17,34 so the present results likely underestimate the effects that would be seen in female knees. None of the present specimens had an LTS >12°, a clinically significant threshold. Our estimates of the effect of the LTS are therefore likely underestimated relative to those that might have resulted had we been able to include knees with LTS >12°.
Another limitation was the relatively small sample size of 7 pairs of knees, but the variation in LTS was sufficient to study its effect using rigorous statistical methods. The use of a range of load magnitudes (1× to 3× BW) with the use of repeated measures (loads) helped to counter the effect of biological tissue variability on the results. The 2-factor linear mixed model used in this study lent itself for analyzing a repeated measures experimental design with a limited number of pairs of knees. 23 Last, we did not examine the roles of other known morphologic risk factors associated with ACL injury, which include the femoral alpha angle, ACL cross-sectional area, and femoral intercondylar notch size, and their effect on the present outcome variables. An actual ACL injury, of course, is likely caused by a combination of all risk factors. However, with the small sample size, we measured only the relationship between LTS on the one hand and ATT or ITR on the other without considering other risk factors, and the results showed that LTS increased ATT and ITR regardless of the effect of other injury factors. However, while it is possible that the femoral alpha angle and ACL cross-sectional area might correlate with LTS, it is unlikely that they or the notch size would have affected the present results qualitatively.
Conclusion
In male knee specimens, a steeper LTS was significantly associated with increased ATT and ITR during jump landings, with the increase in ITR proportionately more than for ATT.
Footnotes
Acknowledgment
The authors thank Suzan Lowe and James O’Connor in the Michigan Medicine Department of Radiology for technical assistance with the magnetic resonance imaging of the specimens.
Final revision submitted October 21, 2022; accepted January 1, 2023.
One or more of the authors has declared the following potential conflict of interest or source of funding: Funding was received from the National Institutes of Health (grant R01 AR054821 to J.A.A-M. and E.M.W.). E.M.W. is a paid editor for Sports Health: A Multidisciplinary Approach. AOSSM checks author disclosures against the Open Payments Database (OPD). AOSSM has not conducted an independent investigation on the OPD and disclaims any liability or responsibility relating thereto.
Ethical approval for this study was waived by the University of Michigan (HUM00180103).