
Abstract
Background:
A serious concern with surgical procedures around the hip joint is iatrogenic injury of the arterial supply to the femoral head (FH) and consequent development of FH osteonecrosis. Cam-type morphology can extend to the posterosuperior area. Understanding the limit of the posterior superior extension of the femoral osteochondroplasty is paramount to avoid underresection and residual impingement while maintaining FH vascularity.
Purpose/Hypothesis:
The aim of this study was to quantify the impact of arthroscopic femoral osteochondroplasty on the FH vascular supply. It was hypothesized that keeping the superior extension of the resection zone anterior to the 12-o’clock position would maintain FH vascularity.
Study Design:
Case series; Level of evidence, 4.
Methods:
Ten adult patients undergoing arthroscopic femoroacetabular impingement (FAI) surgery were included in the study. Computed tomography (CT) scans were obtained before and after arthroscopic osteochondroplasty to define the extension of resection margins. To quantify FH vascularity, postoperative dynamic contrast–enhanced magnetic resonance imaging (DCE-MRI) was obtained at 2 time points: immediately after surgery and at the 3-month follow-up. Custom MRI analysis software was used to quantify perfusion.
Results:
CT scan analysis demonstrated that the superior resection margin was maintained anterior to the 12-o’clock position in half of the patients. The remining 5 patients had a mean posterior extension of 11.4° ± 7.5°. The immediate postoperative DCE-MRI revealed diminished venous outflow in the operative side but no difference in overall FH perfusion. At the 3-month follow-up DCE-MRI, there was no perfusion difference between the operative and nonoperative FHs.
Conclusion:
This study provides previously unreported quantitative MRI data on in vivo perfusion of the FH after the commonly performed arthroscopic femoral osteochondroplasty for the treatment of cam-type FAI. Maintaining resection margins anterior to the 12-o’clock position, or even 10° posteriorly, was not observed to impair perfusion to the FH.
Keywords
An essential element of all hip-preserving surgery is maintenance of femoral head (FH) vascularity. 10,13,35 Surgical techniques to treat femoroacetabular impingement (FAI) were first described using open surgical hip dislocation, which allows for full access of the FH while maintaining the vascularity. This approach provides direct visualization of the terminal vessels supplying the FH. These vessels run along the femoral neck, in the peripheral compartment, within fibrous prolongations of the capsule wall known as retinacula of Weitbrecht and/or synovial folds. With the advancements of instrumentation and surgical techniques, arthroscopic femoral osteochondroplasty can be as accurate and precise as open techniques when correcting the osseous deformity in FAI. 7,34 However, the effects of arthroscopic femoral osteochondroplasty on FH vascularity are not fully understood. A large portion of the region where the arthroscopic work is performed is within the same intra-articular (peripheral) compartment where the terminal vessels are situated, increasing the potential risk of iatrogenic injury to the vascularity of the FH.
Arterial disruption and subsequent development of FH osteonecrosis after FAI surgery is a devastating complication with significant consequences. 25 Previous studies have reported a low incidence of FH osteonecrosis after FAI surgery. 23,41 However, posterior extension of the femoral osteochondroplasty can compromise the FH perfusion. 26 The risk is real, especially when the cam morphology extends posterior superior to the 12-o’clock position. The precise anatomical course and location of the terminal vessels of the retinacular system were well-defined in a previous cadaveric study. 25 Figure 1 depicts the precise location of the retinaculum of Weitbrecht as well as the penetration sites of the terminal vessels into the FH.

Diagram depicting the intra-articular course and penetrating points of the terminal branches of the medial femoral circumflex artery (MFCA) supplying the femoral head (FH). The majority of the terminal branches of the MFCA supplying the FH are located along the posterior region of the FH. The outer circle represents the femoral capsular attachment, and the inner circle illustrates the articular rim of the FH. The green areas delineate the intra-articular location of the retinaculum of Weitbrecht (anterior, superior, and inferior). The yellow areas illustrate the fatty tissue covering the terminal branches’ entry point located around the head-neck junction. Entry point for the terminal branches arising from the MFCA: ascending MFCA (A), deep MFCA (D), transverse MFCA (T). FHNJ, femoral head–neck junction. Image from Lazaro et al, 25 reproduced with permission.
To our knowledge, no previous in vivo studies have quantified the effects of arthroscopic femoral osteochondroplasty on FH perfusion. We aimed to quantify the effects of standard arthroscopic femoral osteochondroplasty on FH vascularity. We hypothesized that keeping the superior resection margin anterior to the 12-o’clock position would preserve FH vascularity.
Methods
The protocol for this prospective study was approved by our institutional review board. Ten adult patients indicated for arthroscopic treatment of FAI, who provided informed consent for the study, were enrolled between December 2018 and June 2019. Exclusion criteria included patients with mental disability, kidney disease (glomerular filtration rate, <30 mL/min/1.73 m2), previous hip surgery, fracture, or infection; or signs of osteonecrosis and osteoarthritis. The quantitative outcome measures included (1) volumetric analysis and precise location (using clockface positions) of the osteochondroplasty using 3-dimensional reformatted computed tomography (3D-CT) scans, and (2) FH perfusion using dynamic contrast–enhanced magnetic resonance imaging (DCE-MRI). 11
Volumetric Analysis of the Osteochondroplasty Using 3D-CT
Segmentation
Preoperative and postoperative 3D-CT was obtained on each patient to perform volumetric analysis of the resection and to define the resection margins in relation to the clockface/360° scale. All images were acquired on an Aquilion CT Scanner (Toshiba/Canon Medical Systems). Acquisition parameters included 170 mA, 120 kVp, 1-mm slice thickness, 50-cm field of view, 402 slices, and a 512 × 512–pixel matrix yielding a resolution of 0.84 × 0.84 × 1.00 mm. Helical CT acquisition through the hips and knees and multiple axial images were generated, and 3D surface models were obtained using Hip Map analysis software (Stryker). All 3D models were aligned by rotating around the FH center such that the anterior pelvic plane (pubic protuberance) was equivalent to the coronal plane; the FH centers on the left and right side were on a horizontal line, such that the line between the FH center and the center of the posterior condyles was equivalent to the vertical axis and the posterior condylar axis parallel to the coronal plane. Alignment of the 3D models was performed to reduce the effect of inaccuracies caused by differences in patient positioning during image acquisition. Quantitation of the alpha angle, femoral torsion, center-edge angle, acetabular version and coverage, and femoral neck–shaft angle and torsion was performed. No contrast agent administration was needed for the CT scan imaging procedure.
Overlay Analysis
A comparative analysis between the preoperative and postoperative bone surface was performed to assess the boundaries of the cam resection. The 3D model of the postoperative scan was aligned with the preoperative 3D model using rigid registration. Overlay images were created by showing both pre- and postoperative 3D models, but with transparency for the preoperative bone surface (Figure 2). All overlay analyses were performed in 3-matic (Materialise).

(A) An example of the 3-dimensional model of the postoperative scan aligned with the preoperative 3-dimensional model with transparency for the preoperative bone surface. Additionally, a distance map between the pre- and postoperative bone surface was created, and colors were assigned to the surfaces that were different by >1 mm. (B) Anterior view of the highlighted cam morphology. (C) The superior posterior extent of the osteochondroplasty passed the 12-o’clock position by 11°, and (D) the anterior inferior extent of the resection. Max, maximum.
Additionally, a distance map between the pre- and postoperative bone surface was created, and colors were assigned to the surfaces that were different by >1 mm. This threshold was chosen because the scan resolution was also on the order of 1 mm (ie, after registration, bone surfaces may differ by up to 1 mm without there actually being a difference). The anterior-posterior extent of the cam resection was assessed by calculating the angle between the plane made up by the neck axis and the posterior-most (or anterior-most) location of the resection outline and the 12-o’clock position, where the (femoral) 12-o’clock plane was defined by the femoral neck axis and the vertical axis. The proximal extent of the cam resection was assessed by calculating the maximum alpha angle, where the alpha angle was calculated as the angle between the femoral neck axis and a line from the center of the FH to the proximal-most location of the resection outline. The maximum resection depth was calculated as the maximum distance between the pre- and postoperative bone surface (minus 1 mm of noise). All overlay analyses were performed using 3-matic software.
FH Perfusion Using DCE-MRI
MRI Acquisition Method
DCE-MRI was acquired on a 1.5-T General Electric MRI scanner (GE Healthcare) using an 8-channel cardiac receive coil. A 3D spoiled gradient echo sequence (LAVA) was used with a 3.93 ms/1.67 ms repetition time/echo time and a 12° flip angle. Fat suppression was utilized to eliminate signal from fatty marrow in the bone that would inhibit detection of gadolinium uptake. A 40 × 40–cm coronal field of view was acquired with a 256 × 128–pixel matrix and 26 slices yielding a reconstructed resolution of 1.6 × 1.6 × 4.0 mm. Each time point was acquired in 8 seconds, for a total of 45 time points with a 6-minute scan time. The sequence was started and 3 baseline points acquired precontrast before injection of 0.1 mmol/kg Gadavist (Bayer Healthcare) at a rate of 2 mL/s, followed by a saline flush using a MEDRAD MR power injector (Bayer Healthcare).
MRI Analysis Method
Pharmacokinetic analysis of the DCE-MRI data was performed using software written in-house using IDL software (Version 8.1; Exelis Visual) by one of the authors (J.P.D.). A region of interest defining the entire FH on multiple slices was prescribed on both the operative and the contralateral sides. 11
The mean time course for the FH was created as the average of all voxels in the region of interest and fit with the modified Brix model yielding a biexponential equation 37 :

The parameters above may be defined as follows: S(t) is the MRI signal intensity as a function of time, S0 is the baseline signal intensity before the administration of contrast, amplitude (A) is related to the size of the extravascular extracellular space (EES), Kep (1/min) is the ratio of Ktrans /EES and is the exchange rate between the extracellular and plasma compartments, and Kel (1/min) is the washout or elimination rate of contrast from the region. A positive Kel indicates a delayed washout and venous clearance. Additional measures of initial uptake slope and area under the curve (AUC) at 1 minute following injection were also calculated.
Data Analysis
The entire volume of the FH was measured in each patient, and a single time-intensity curve was made from the average of all voxels. All time-intensity curves were normalized to the preinjection baseline to allow comparison between patients. Each patient acted as his or her own control, and we calculated the change between 2 time points in the same patient: immediately after surgery (0 months) and at the 3-month follow-up.
Paired 2-tailed t tests (Excel, Microsoft Corp) were used to compare the operated and control sides within the same patient. Unpaired 2-tailed t tests assuming unequal variance were used to compare differences between 0 and 3 months postoperatively. In both cases, P < .05 was considered significant.
Results
The study cohort consisted of 6 women and 4 men, with an average age of 29.8 years (range, 18-38 years). The average traction time was 28.8 minutes (range, 22-43 minutes), and the average time spent between the operating room and the first MRI postoperatively was 89 minutes (range, 43-160 minutes) (Table 1).
Cohort Information a
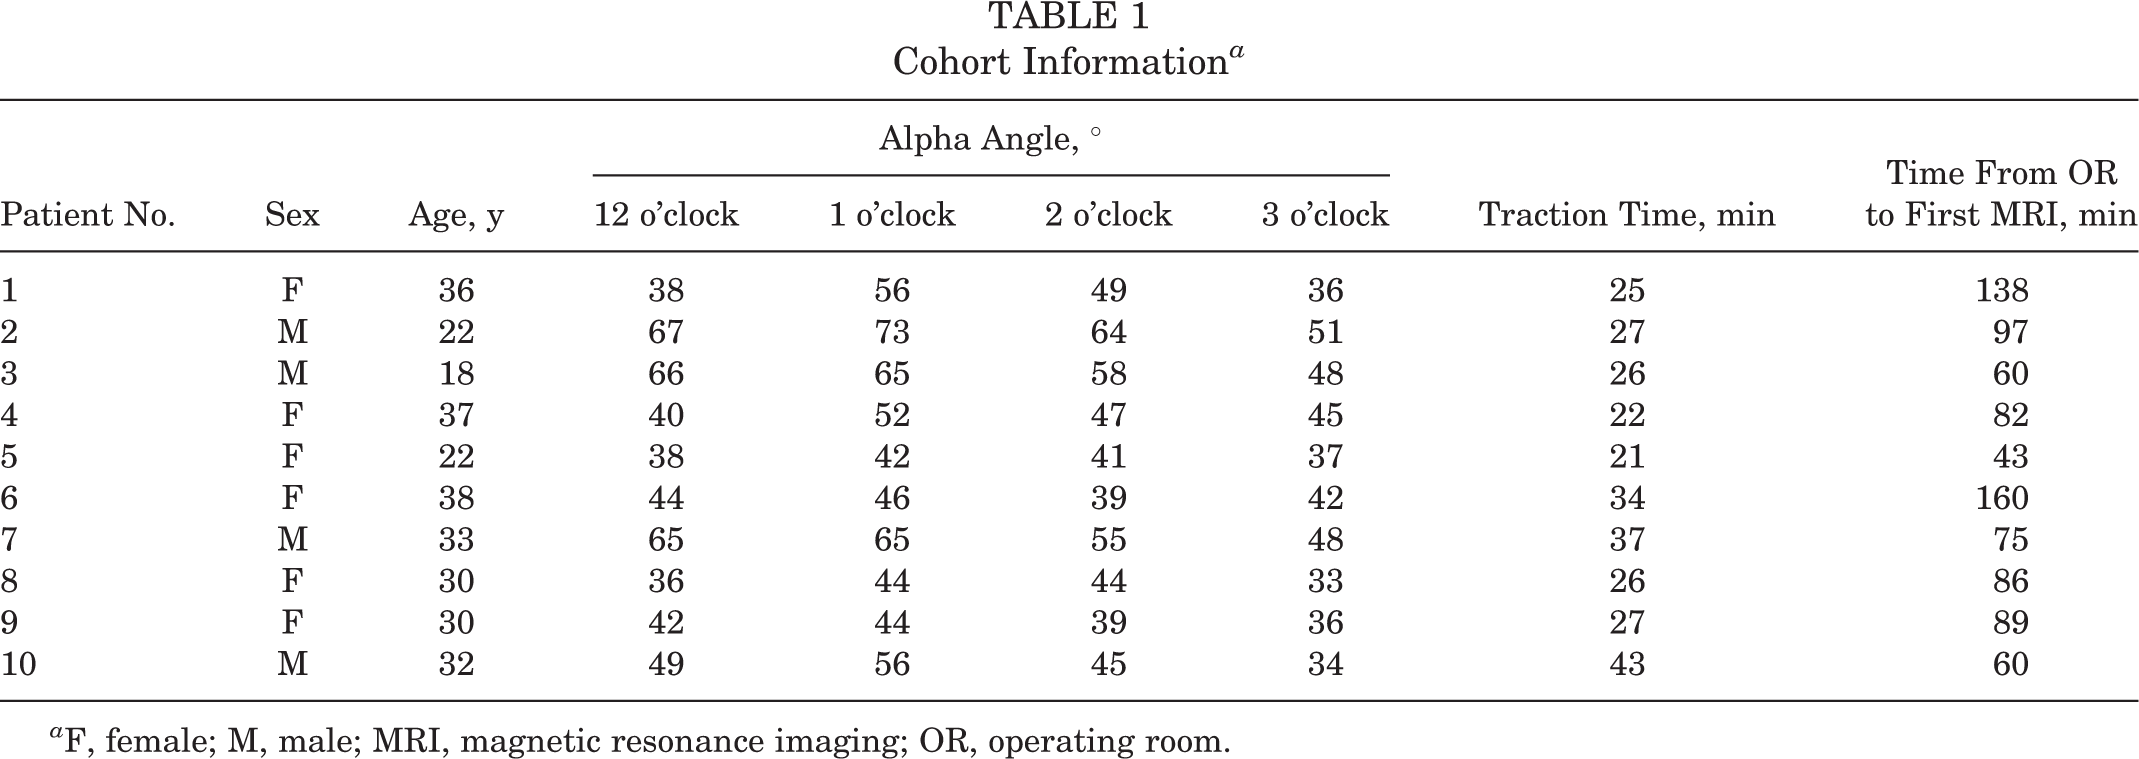
a F, female; M, male; MRI, magnetic resonance imaging; OR, operating room.
The CT analysis revealed that 5 of the resections extended posterior to the 12-o’clock position, with a mean extension of 11.4° ± 7.5°. DCE-MRI analysis revealed a significant difference (P = .005) in the clearance or washout rate (Kel ) between operative (Kel = 0.031/min) and nonoperative contralateral (Kel = 0.073/min) FHs at the initial MRI time point, the same day of surgery (Figure 3). This implies that a more delayed washout/venous outflow occurred on the operative side at this time point. No perfusion differences were found at the 3-month postoperative time point.

(A) Average dynamic contrast–enhanced magnetic resonance imaging time-intensity curves are shown for both operated and contralateral femoral heads just after surgery and at the 3-month follow-up time point. (B) Comparison is also shown for both time points on operative and contralateral sides comparing the flow of gadolinium through the femoral head.
However, comparison between 0 and 3 months postoperatively showed significant changes in perfusion on both operative and control sides. On the operative side, Kep (P = .002), AKep (P = .005), and AUC (P = .001) were decreased at 3 months after surgery. Likewise, on the contralateral side, the slope (P = .016), Kep (P = .003), AKep (P = .008), and AUC (P = .007) were also decreased. This implies that initial perfusion in the arterial phase was mildly (<10%) decreased at 3 months after surgery. However, the time-intensity curves did not show a difference at the end of the scan in clearance or in enhancement percentage (Figure 3).
Discussion
The retinacular system, which courses through the intra-articular peripheral compartment supplying the FH, is at increased risk of injury during arthroscopic femoral osteochondroplasty. Based on quantitative DCE-MRI techniques used in this study, maintaining the superior resection margin anterior to 12 o’clock, or even 11° of posterior extension, preserved full FH perfusion. Immediately postoperatively, the blood flow through the FH demonstrated some minor delays in venous outflow, but the overall total perfusion was maintained. The 3-month follow-up DCE-MRI demonstrated symmetric flow between the surgical and nonsurgical FH.
The arterial supply to the FH is derived from 3 arterial systems (retinacular, foveolar, and intraosseous). 17,19,20,29,33,39 The superior retinacular arteries (SRAs) and terminal branches of the deep medial femoral circumflex artery (MFCA) provide the main arterial supply to the FH. ∥ Once intracapsular, they course within a fibrous expansion of the capsular wall, known as the retinacula of Weitbrecht (synovial folds), 15,17,21,22,25,39,40 and pierce the FH predominantly at the posterior superior aspect. 14,19,24,25,29 Prior cadaveric studies demonstrated that the terminal branches of the SRA can extend anteriorly, but 70% to 80% are located within the posterior superior FH region. 14,24,25 Lavigne et al 24 studied 150 dried cadaveric femora and reported that 70% of the vascular foramina were located posterior superior (at 9-12 o’clock) and posterior inferior (at 6-8 o’clock) along of the femoral neck.
In 2007, Sussmann et al 35 published a cadaveric injection study evaluating the risk of vascular injury with arthroscopic femoral osteochondroplasty. They reported a vascular safe zone, within measured resection limits (150° resection arc), 30° (at 1 o’clock; on the right hip) anterior to the center of the superior neck down to the inferior retinaculum of Weitbrecht (medial synovial fold) at 6 o’clock (on the right hip). In 2011, McCormick et al 28 reported using static contrast–enhanced MRI in patients diagnosed with FAI and identified all terminal vessels of the MFCA at the posterior superior aspect of the femoral neck (from 10:30 to 12 o’clock). They extended the safe zone superiorly to the 12-o’clock position (180° anterior resection arc). In 2015, Lazaro et al 25 published a cadaveric injection study and identified the intra-articular course of the terminal branches of the MFCA supplying the FH using the clockface as well as a 360° scale (Figure 1). They reported that 80% of the terminal branches penetrated the FH-neck junction posteriorly, which suggests that an anterior resection arc is safe for the vascularity of the FH. A follow-up cadaveric study in 2017 quantified the effect of femoral osteochondroplasty on FH vascularity. 26 The authors reported an extension of the resection safe zone to 10° posterior to the 12-o’clock position. When the resection was extended to 40° posterior to the 12-o’clock position, a significant reduction in FH vascularity resulted. The more posterior the superior margin of the resection extended, the larger the decrease in FH vascularity that was found. Our findings support these previous anatomical studies describing the safe zone for femoral osteochondroplasty, and demonstrated maintenance of FH perfusion when the resection arc was kept anterior to 12 o’clock and when there was a mean posterior extension of 11°.
Often, during hip arthroscopy, the 12-o’clock position is assumed to be the area where the superior retinacular vessels are visualized. However, based on prior anatomical studies, we know that some of the terminal branches of the SRA system penetrate the head-neck junction anterior to the 12-o’clock position (anteriorly extending to 30°/1 o’clock) 25 (Figure 1). Improvement in preoperative imaging coupled with increased understanding of the pathomechanics of FAI had helped us to better appreciate the anatomical variations of the cam-type lesions that extend to the posterior superior region. 1,2,6,27,43 Rupp and Rupp 31 reported no incidence of FH osteonecrosis in 14 patients who underwent arthroscopic osteochondroplasty that extended to the posterior superior region. They concluded that osteochondroplasty of the posterior lateral aspect can be performed safely without risk of FH osteonecrosis, despite damage to the FH vascularity located in this area. Lazaro et al 26 demonstrated that posterior extension of the osteochondroplasty of 40° can increasingly affect FH perfusion. The disparity may be dependent on the intraoperative determination of the 12-o’clock position. Arthroscopically, some of the terminal branches that are disrupted, when correcting this posterior extension of the impingement, may be anterior to 12 o’clock. An extension of the resection 10° posterior to 12 o’clock may allow for correction of cam-type impingement that extends posteriorly, while maintaining FH vascularity. However, the resection in this area should be performed with extreme caution to prevent excessive (>10°) posterior extension of the resection that can place the major contributor to the FH arterial supply at risk. Our findings demonstrated that posterior extension up to 11° did not seem to affect overall FH vascularity.
Limitations
This study has some limitations. An indirect measurement of bone perfusion was used. However, DCE-MRI is a well-established method for quantification of vascularity of the soft tissues, brain tissue, and bone. 9,12,18,30,32,36 The osteochondroplasty extended posteriorly in some patients in our cohort. However, the study included a limited number of patients, thus limiting our ability to perform a subgroup analysis. Despite this limitation, the study cohort is a good representation of a single surgical practice in which the commonly performed femoral osteochondroplasty is located along the anterior superior quadrant of the FH-neck junction. Additional studies are needed to assess the effect of >10° of posterior extension of the femoral osteochondroplasty in the in vivo setting.
Conclusion
This study provides previously unreported quantitative MRI analysis of the residual FH blood flow after the commonly performed arthroscopic femoral osteochondroplasty for the treatment of cam-type FAI. Maintenance of resection margins anterior to the 12-o’clock position along the clockface, or even a further 10° posteriorly, was not observed to impair overall perfusion to the FH.
Footnotes
Acknowledgment
The authors acknowledge the excellent work of Floor Lambers, PhD, senior staff engineer at Stryker, on the CT scan volumetric analysis of the osteochondroplasty. Her work allowed us to visualize and quantify the extension limits of the osteochondroplasty.