
Abstract
Background:
Chondral defects in the knee have biomechanical differences because of defect size and location. Prior literature only compares the maximum stress experienced with large defects.
Hypothesis:
It was hypothesized that pressure surrounding the chondral defect would increase with size and vary in location, such that a size cutoff exists that suggests surgical intervention.
Study Design:
Controlled laboratory study.
Methods:
Isolated chondral defects from 0.09 to 1.0 cm2 were created on the medial and lateral femoral condyles of 6 human cadaveric knees. The knees were fixed to a uniaxial load frame and loaded from 0 to 600 N at full extension. Another defect was created at the point of tibiofemoral contact at 30° of flexion. Tibiofemoral contact pressures were measured. Peak contact pressure was the highest value in the area delimited within a 3-mm rim around the defect. The location of the peak contact pressure was determined.
Results:
At full extension, the mean maximum pressures on the medial femoral condyle ranged from 4.30 to 6.91 MPa at 0.09 and 1.0 cm2, respectively (P < .01). The location of the peak pressure was found posteromedial in defects between 0.09 and 0.25 cm2, shifting anterolaterally at sizes 0.49 and 1.0 cm2 (P < .01). The maximum pressures on the lateral femoral condyle ranged from 3.63 to 5.81 MPa at 0.09 and 1.0 cm2, respectively (P = .02). The location of the peak contact pressure point was anterolateral in defects between 0.09 and 0.25 cm2, shifting posterolaterally at 0.49 and 1.0 cm2 (P < .01). No differences in contact pressure between full extension and 30° of flexion were found for either the lateral or medial condyles.
Conclusion:
Full-thickness chondral defects bilaterally had a significant increase in contact pressure between defect sizes of 0.49 and 1.0 cm2. The location of the maximum contact pressures surrounding the lesion also varied with larger defects. Contact area redistribution and cartilage stress change may affect adjacent cartilage integrity.
Clinical Relevance:
Size cutoffs may exist earlier in the natural history of chondral defects than previously realized, suggesting a lower threshold for intervention.
Osteochondral defects of the knee can lead to pain and decreased function. These lesions result from multiple origins, including acute bony or ligamentous injury, the collapse of subchondral bone, and osteochondritis dissecans. 13 Although the progression from the damaged articular cartilage to osteoarthritis is multifactorial, factors such as increased stress on the defect rim and increased intralesion subchondral bone contact are believed to induce cartilage degeneration subchondral bone sclerosis. 10,12,22,27 Animal studies on stress concentration around the rim of full-thickness chondral defects suggest that defects may reach a critical diameter. In addition, high biomechanical edge shear forces on adjacent cartilage lead to progressive degeneration and increasing defect size. 10,16,19
Patients with osteochondral defects may be asymptomatic on evaluation, with localized knee pain or mechanical symptoms. 6 On physical examination, chondral defects lack reproducible and consistent findings, 14 so diagnostic imaging is required to evaluate for chondral defects. Magnetic resonance imaging and arthroscopy remain the standards for diagnosing the sizing and location of cartilage defects. 9 The severity of osteochondral defects is graded arthroscopically through either the Outerbridge classification or the International Cartilage Regeneration & Joint Preservation Society (ICRS) system, 3,23 which assesses the cartilage depth and/or size defect. Severe lesions (grades 3 and 4 in the ICRS system or grades 3 and 4 in the Outerbridge classification) are more likely to progress toward osteoarthritis and require surgical intervention. 15,26
Treatment and surgical intervention for chondral defects are often necessary because of articular cartilage’s limited healing and regenerative capacity and propensity to progress to osteoarthritis. 17 Currently, treatment for chondral defects is limited to 3 areas: nonoperative management, marrow stimulation treatment such as microfractures, or cartilage restoration treatment such as autologous chondrocyte implantation and osteochondral allograft or autograft transplantation. 1,5,12 Surgical treatment ultimately aims to reduce patient symptoms and improve quality of life, re-creating a congruent joint surface to stave off the need for total knee arthroplasty. 9 However, treatment algorithms often only anatomically consider the size of the defect. Although a 2- to 3-cm2 cutoff is widely used and accepted in orthopaedic practice as the threshold between different cartilage restoration techniques, little evidence provides a biochemical or structural origin for this cutoff. 1,21
Prior biomechanical studies in both cadaveric and animal models have shown that defect size and shape may play an essential role in the progression of osteoarthritis. In bovine models, studies have demonstrated that defects of the same size that were isolated to the medial femoral condyle (MFC) or lateral femoral condyle (LFC) experience different amounts of peak pressure subchondral bone contact and stress at the chondral defect rim. 10,11 Studies performed using computer-generated human knee models as well as cadaveric human knees also reported peak pressure differences based on the location of the chondral defect. 13,24 These studies suggest that a critical defect size threshold for surgical planning may be insufficient to capture the biomechanical stresses placed on cartilage at different locations within the articular surface. Clinically, a better biomechanical understanding of chondral lesions may inform treatment options and choices for defects with other anatomical characteristics.
Although chondral defects in the knees and their relation to osteoarthritis have been studied, prior literature examining the effects of MFC and LFC lesions in human cadaveric knees has only compared the maximum stresses experienced within the knee. 13 In this study, we examine how maximum stress and maximum pressure in the knee are affected by increasing chondral defect size and varying defect location at full knee extension and 30° of flexion using human cadaveric specimens. We hypothesized that pressure at the defect rim would increase with increasing defect size. For any given arc of motion, we also expected to observe differences in peak pressures between the MFC and LFC. Additionally, we speculated that peak pressures would differ between defects created at 0° and 30° within the same femoral condyle. Finally, we hypothesized that a size cutoff exists to suggest early surgical intervention. Therefore, a linear increase in defect edge size will be accompanied by a significant increase in maximum contact pressure surrounding the defect.
Methods
Specimen Preparation
Eight knees were procured for this study. Two knees were discarded because of ligamentous deficiency and severe gross arthritis. The final analysis included 6 fresh-frozen human cadaveric knees, with 3 right and 3 left knees. The mean donor age was 69.3 years (SD, 20.1 years). In addition, 2 of 6 (33%) donors were male, and 4 of 6 (67%) donors were female. All specimens were procured by Science Care.
The skin and muscle attachments were carefully removed from the specimens, and the patella, quadriceps tendon, and patellar tendon were preserved to allow specimen mounting. The menisci, collateral ligaments, and cruciate ligaments were maintained. Anterior and posterior arthrotomies were performed to enable the visualization of the articular cartilage and insertion of the sensors for testing. Specimens with gross arthritis and missing ligamentous structures were excluded. An orthopaedic surgeon (J.K.) evaluated specimens before their inclusion in the study.
The intact knee was mounted in full extension onto the custom-built apparatus (Figure 1A). A paper with ink was inserted into the medial joint compartment to establish the center for the chondral defect. The load cell was lowered so the MFC contacted the inked paper. The knee was removed from the mounting apparatus. Examination of the inked MFC with digital calipers determined that chondral defects were created 1.0 cm from the femoral notch posteriorly and at the medial-lateral midpoint of the femoral condyle.
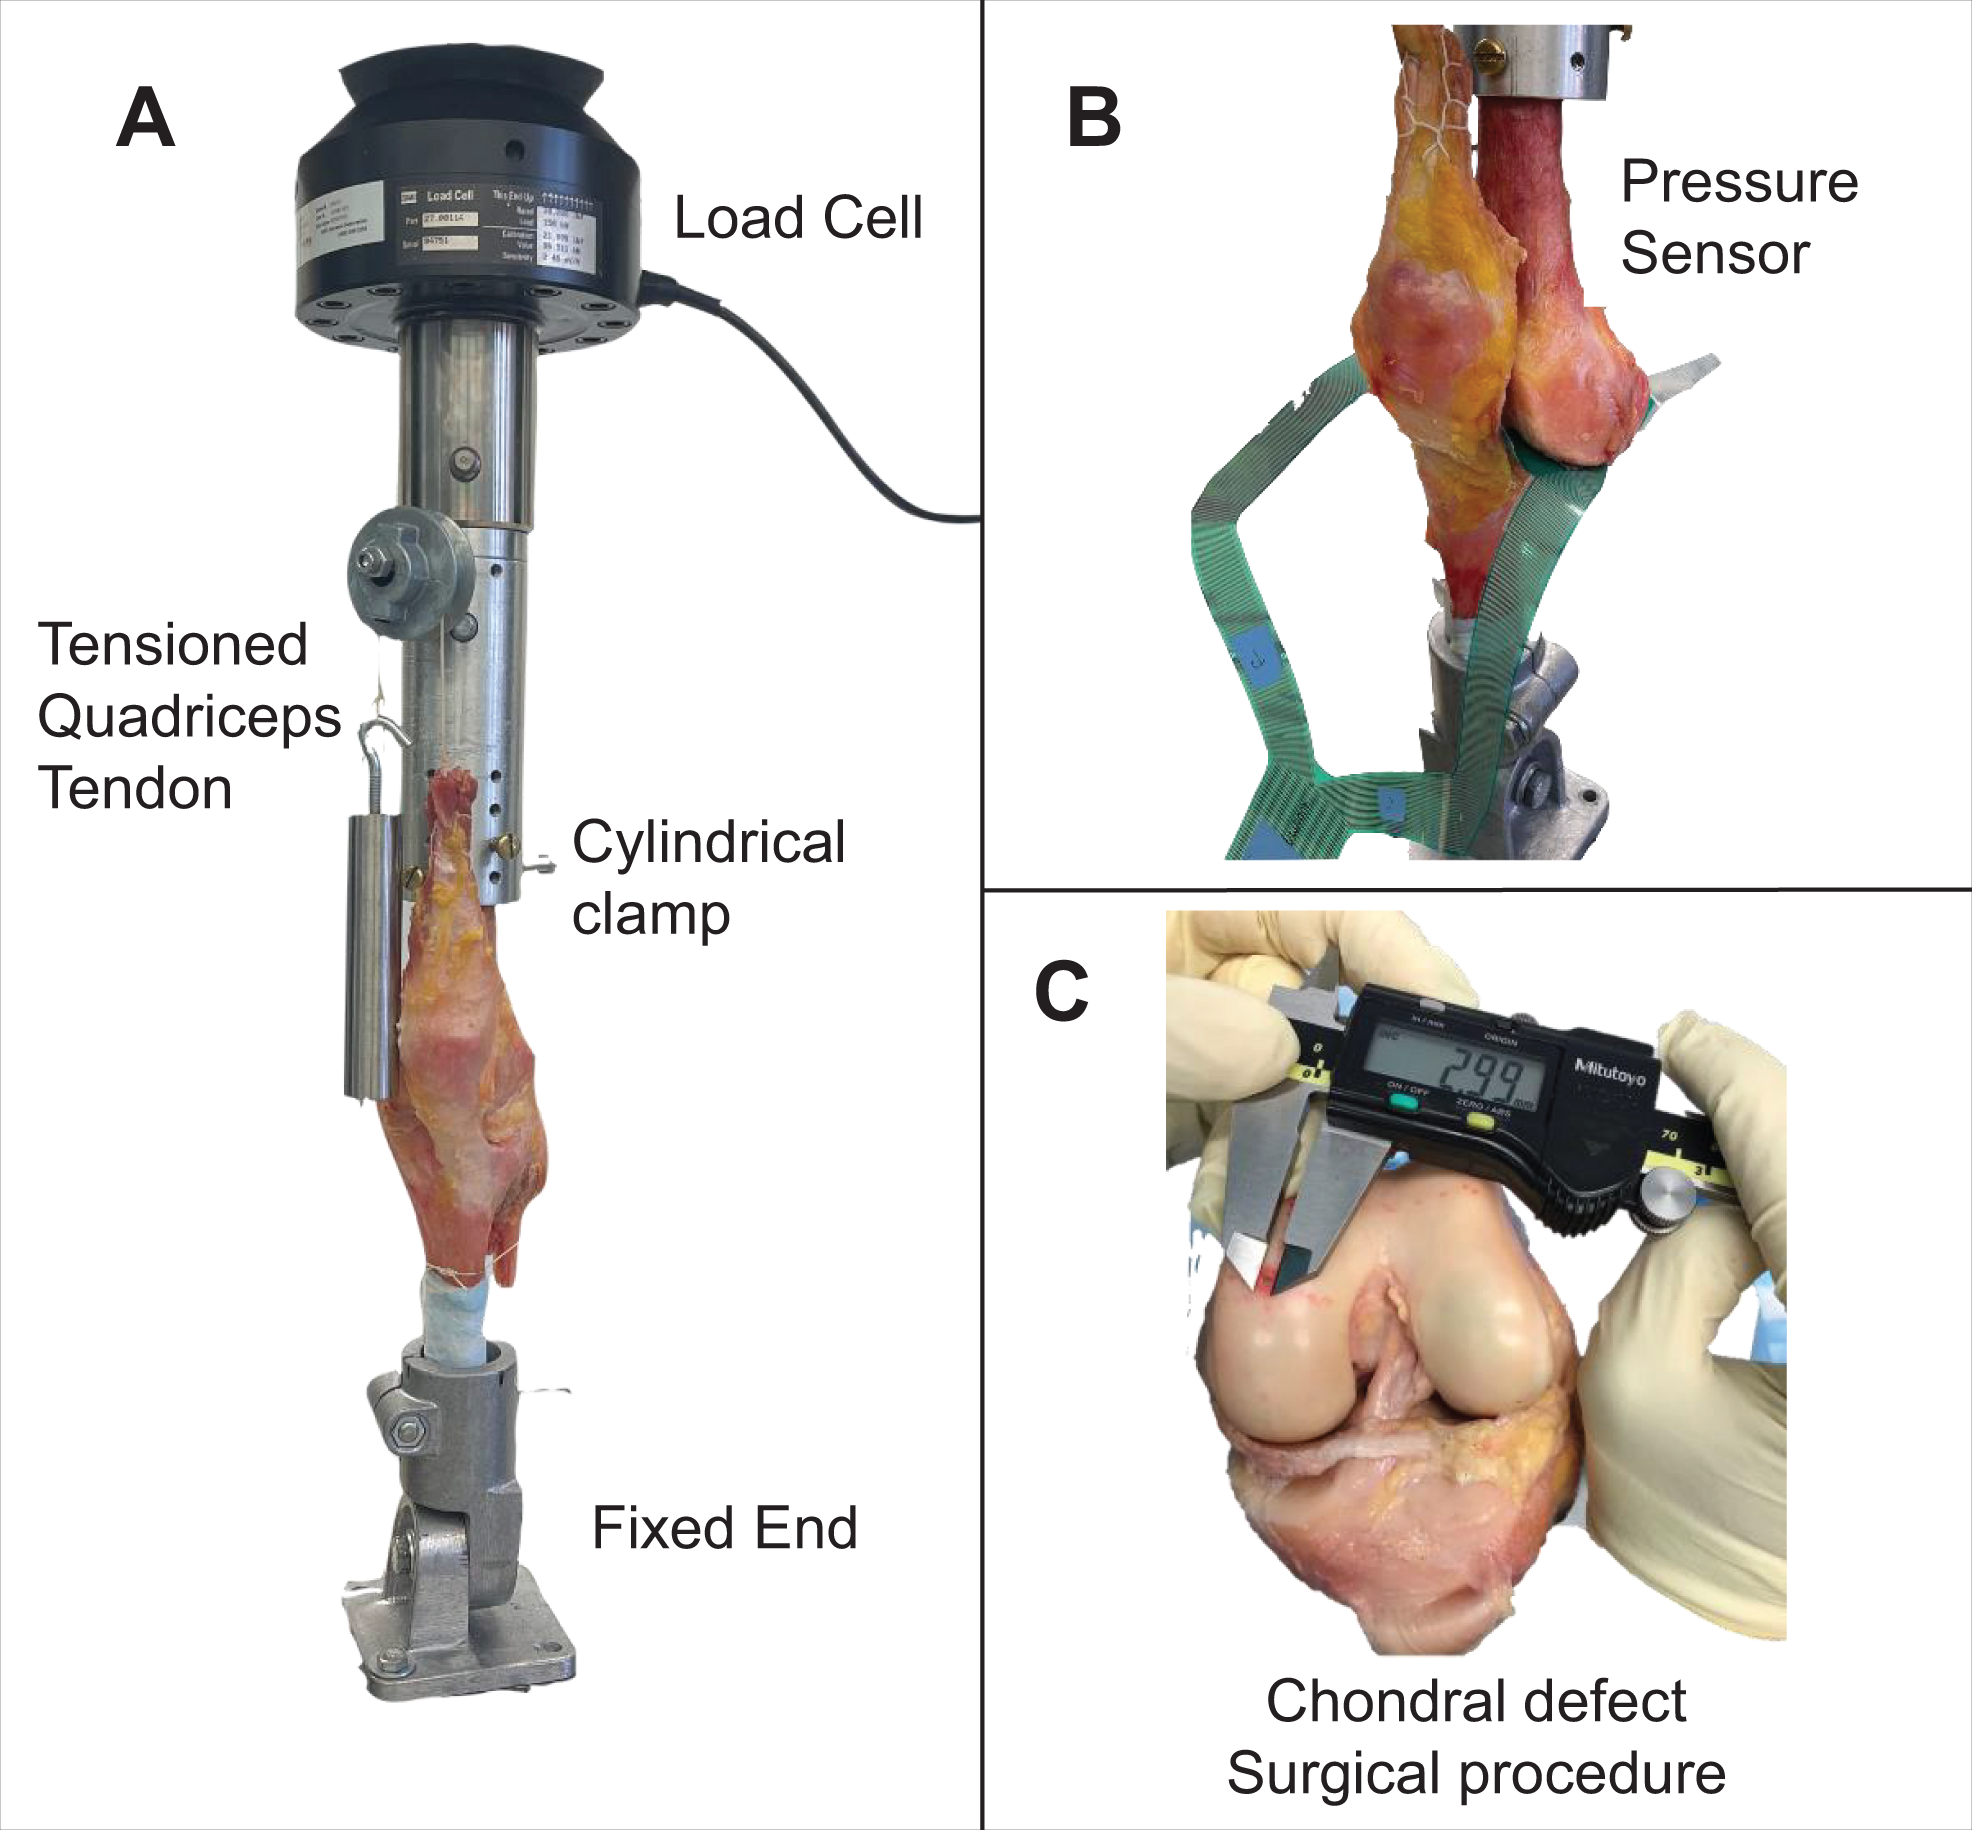
(A) Testing setup for full extension. The specimen was rigidly fixed using cylindrical clamps and locked to the materials testing system load cell. (B) Pressure sensor placed between the femur and tibia at the location of the defect. (C) Full-thickness square defects were created with a scalpel 1 cm posterior from the femoral notch.
Isolated full-thickness, square chondral defects of increasing size were created through sharp dissection using a scalpel (Figure 1C). The edge lengths of the defects were set at 3, 5, 7, and 10 mm, giving areas ranging from 0.09 to 1.0 cm2. The defect was enlarged by evenly offsetting the borders of the defect with the use of the scalpel, carefully maintaining the center point around the defect. For each defect created, testing was performed per the protocol below. Defects were created first in the MFC and then in the LFC for each knee.
To examine the effect of chondral defects in the posterior aspect of the femoral condyles, the knee was placed at 30° of flexion. The center of the chondral defect was identified by examining the inked condyle with the knee axially loaded at 30° of flexion. Full-thickness, square chondral defects of the exact sizes as for the full-extension position were created. These defects were at ≥10-mm distance from the edge of the prior defects. No defect overlapped with the defects previously created. Testing was repeated for each knee at 30° of flexion, starting first in the MFC and then in the LFC.
Specimen Testing
The tibia and femur were rigidly fixed using cylindrical clamps to the custom-built testing apparatus (Figure 1A). The femur was attached to a uniaxial load frame (MTS 30/G machine), allowing axial loading from 0 to 600 N at full extension or 30° of flexion. This static load value is similar to that of prior biomechanical studies examining chondral defects. 13
Contact pressures between the femoral and tibial condyles were measured using flexible digital pressure sensors inserted into the medial and lateral knee joint compartments (Tekscan model 4000) (Figure 1B). The sensors were fixed into place, and care was taken to avoid bending the sensors during placement. Before data collection, each sensor was calibrated in situ. Then, the knee was loaded from 0 to 600 N at 0.05 mm/s. The same protocol was performed first for each increasing defect size on the MFC and then on the LFC. All specimens were kept moist by spraying a standard saline solution between testing conditions.
Data Analysis
The digital sensors provided each load-sensing region’s measured pressure (MPa or psi[eg, lb./in2]). In postprocessing analysis, the peak or maximum value for contact pressure was defined as the highest value within 3 mm of the edge of the defect. The anatomical location of the peak contact pressure point was determined using pressure maps in the Tekscan user interface (ISCAN), with the center of the defect as a reference.
Descriptive statistics were performed on demographic characteristics and reported measurements. Continuous variables are reported as mean ± SD, while categorical variables are described using frequencies and percentages. After conducting a Shapiro-Wilk test for normality, 1-way repeated-measures analysis of variance was used to study the relationship between defect size and maximum contact pressures on both femoral condyles. A similar analysis compared peak contact pressures between defects at full extension and 30° of flexion within the MFC or LFC. Post hoc analyses were performed using the Tukey honestly significant difference test. The relationship between the location of the peak contact pressure point and size was cross-tabulated and assessed using the Fisher exact test.
The location of maximum pressure was reported as 1 of 4 quadrants: anteromedial, anterolateral, posteromedial, or posterolateral. The location of the maximum pressure was compared between the MFC and LFC for both full extension and 30° of flexion. Within either the MFC or the LFC, the location of the maximum pressure point was also compared between full extension and 30° of flexion. All statistical analyses were performed in R software Version 4.1.1 (R Foundation for Statistical Computing), and the significance was set at .05.
Results
Contact Pressures at Full Extension
The mean maximum contact pressures in the MFC around the defect were 4.30 ± 1.82, 5.61 ± 1.41, 5.91 ± 1.50, and 6.91 ± 1.45 MPa on the MFC at 0.09, 0.25, 0.49, and 1.0 cm2, respectively (Figure 2). Increasing defect size led to increased maximum contact pressure, but only the difference between 0.09 and 1 cm2 defects was significant (P = .04).

Box plot of maximum contact pressures in the medial femoral condyle at full extension based on the surgically created chondral defect size for 6 cadaveric human knees. Analysis of variance showed a significant trend of increasing contact pressure with increased defect size (P < .01). HSD, honestly significant difference. Each box solid line represents the mean maximum contact pressure for the different defect size areas shown. The upper and lower bars of each box represent the mean maximum and minimum contact pressure values for all six MFC.
The location of the peak contact pressure point in the MFC was found posteromedial in defect sizes between 0.09 cm2 (4/6 knees, 67%) and 0.25 cm2 (3/6; 50%). The stress point shifted anterolaterally in defect sizes between 0.49 cm2 (5/6; 83%) and 1.0 cm2 (6/6; 100%) (P < .01) (Figure 3).

Representative cadaveric specimens and contact pressure maps for 1 knee with a medial femoral condyle chondral defect at full extension. (A) Intact cartilage. (B-E) Contact pressure areas shift location with increasing defect size. (F) A contact pressure surround was defined within 3 mm of the edge of the defect (area between the dotted squares) to inspect changes in the point of maximum stress.
On the LFC, the mean maximum contact pressures around the defect were 3.63 ± 0.54, 4.60 ± 1.10, 5.28 ± 1.36, and 5.81 ± 1.72 MPa at 0.09, 0.25, 0.49, and 1.0 cm2, respectively. Contact pressures around the defect were different between defect sizes (P = .02) (Figure 4). Post hoc analysis showed a significant difference in contact pressure between 0.09 and 1.0 cm2 defect sizes (P = .02).

Box plot of maximum contact pressure in the lateral femoral condyle in full extension based on the surgically created chondral defect for 6 cadaveric human knees. Analysis of variance showed a significant trend of increasing contact pressure with increased defect size (P < .05). HSD, honestly significant difference. Each box solid line represents the mean maximum contact pressure for the different defect size areas shown. The upper and lower bars of each box represent the mean maximum and minimum contact pressure values for all six LFC.
The location of the peak contact pressure point was anterolateral to the center of defects between 0.09 cm2 (3/6 knees; 50%) and 0.25 cm2 (4/6; 67%) in size. However, the stress point shifted posterolaterally for defect sizes between 0.49 cm2 (4/6; 67%) and 1.0 cm2 (5/6; 83%) (P < .01) (Figure 5).

Representative contact pressure maps for 1 knee with a lateral femoral condyle chondral defect at full extension. (A) Intact cartilage. (B-E) Contact pressure areas shift location with increasing defect size. Pressure maps depict the lateral condyle, oriented to show the quadrant area around the defect.
Pairwise comparison between the MFC and LFC showed no differences in peak contact pressures for defect sizes of 0.09, 0.25, 0.49, and 1.0 cm2 (P > .05). The location of the peak contact pressure points significantly differed between the MFC and LFC for defect sizes of 0.09, 0.49, and 1.0 cm2 (P = .03, .002, and .002, respectively; Fisher exact test). No association was found between the femoral condyle and the location of the peak contact pressure for a defect size of 0.25 cm2 (Table 1).
Peak Contact Pressure Location in the Femoral Condyle at Full Extension a
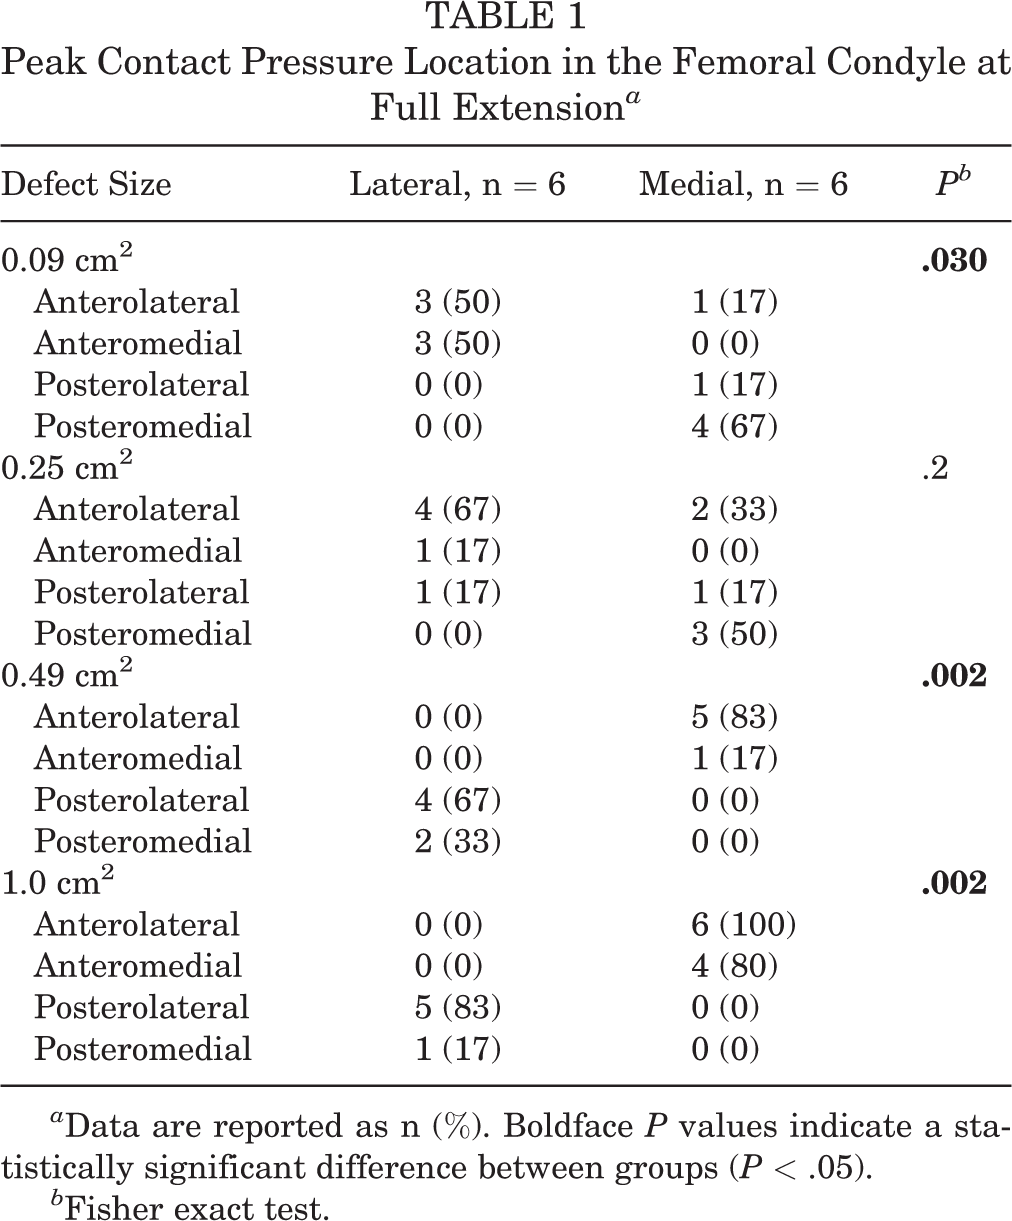
a Data are reported as n (%). Boldface P values indicate a statistically significant difference between groups (P < .05).
b Fisher exact test.
Contact Pressures at 30° of Knee Flexion
The mean maximum contact pressures around the defect were 4.86, 5.38, 5.88, and 5.70 MPa on the MFC at 0.09, 0.25, 0.49, and 1.0 cm2, respectively. The mean maximum contact pressures around the defect were 5.26, 5.88, 7.12, and 7.53 MPa on the LFC at 0.09, 0.25, 0.49, and 1.0 cm2, respectively. There were no differences in peak contact pressures at any defect size in either condyle (P > .05). No differences in peak contact pressure were found between defects tested at full extension or 30° of knee flexion (P > .05) (Table 2).
Peak Contact Pressures (in MPa) With Increasing Chondral Defect Size a

a Data are reported as mean ± SD.
b Wilcoxon rank sum test.
At 30° of flexion, the location of the peak contact pressure point in the MFC was found posteromedial in defect size of 0.09 cm2 (3/5 knees; 60%) and posterolateral in defect size of 0.25 cm2 (3/5; 60%). The stress point shifted anteromedially in defect sizes between 0.49 cm2 (3/5; 60%) and 1.0 cm2 (4/5; 80%) (P = .075). The location of peak contact pressure varied when the chondral defect was tested at full extension or 30° of knee flexion (Table 3).
Location of Peak Contact Pressure With Increasing Chondral Defect a
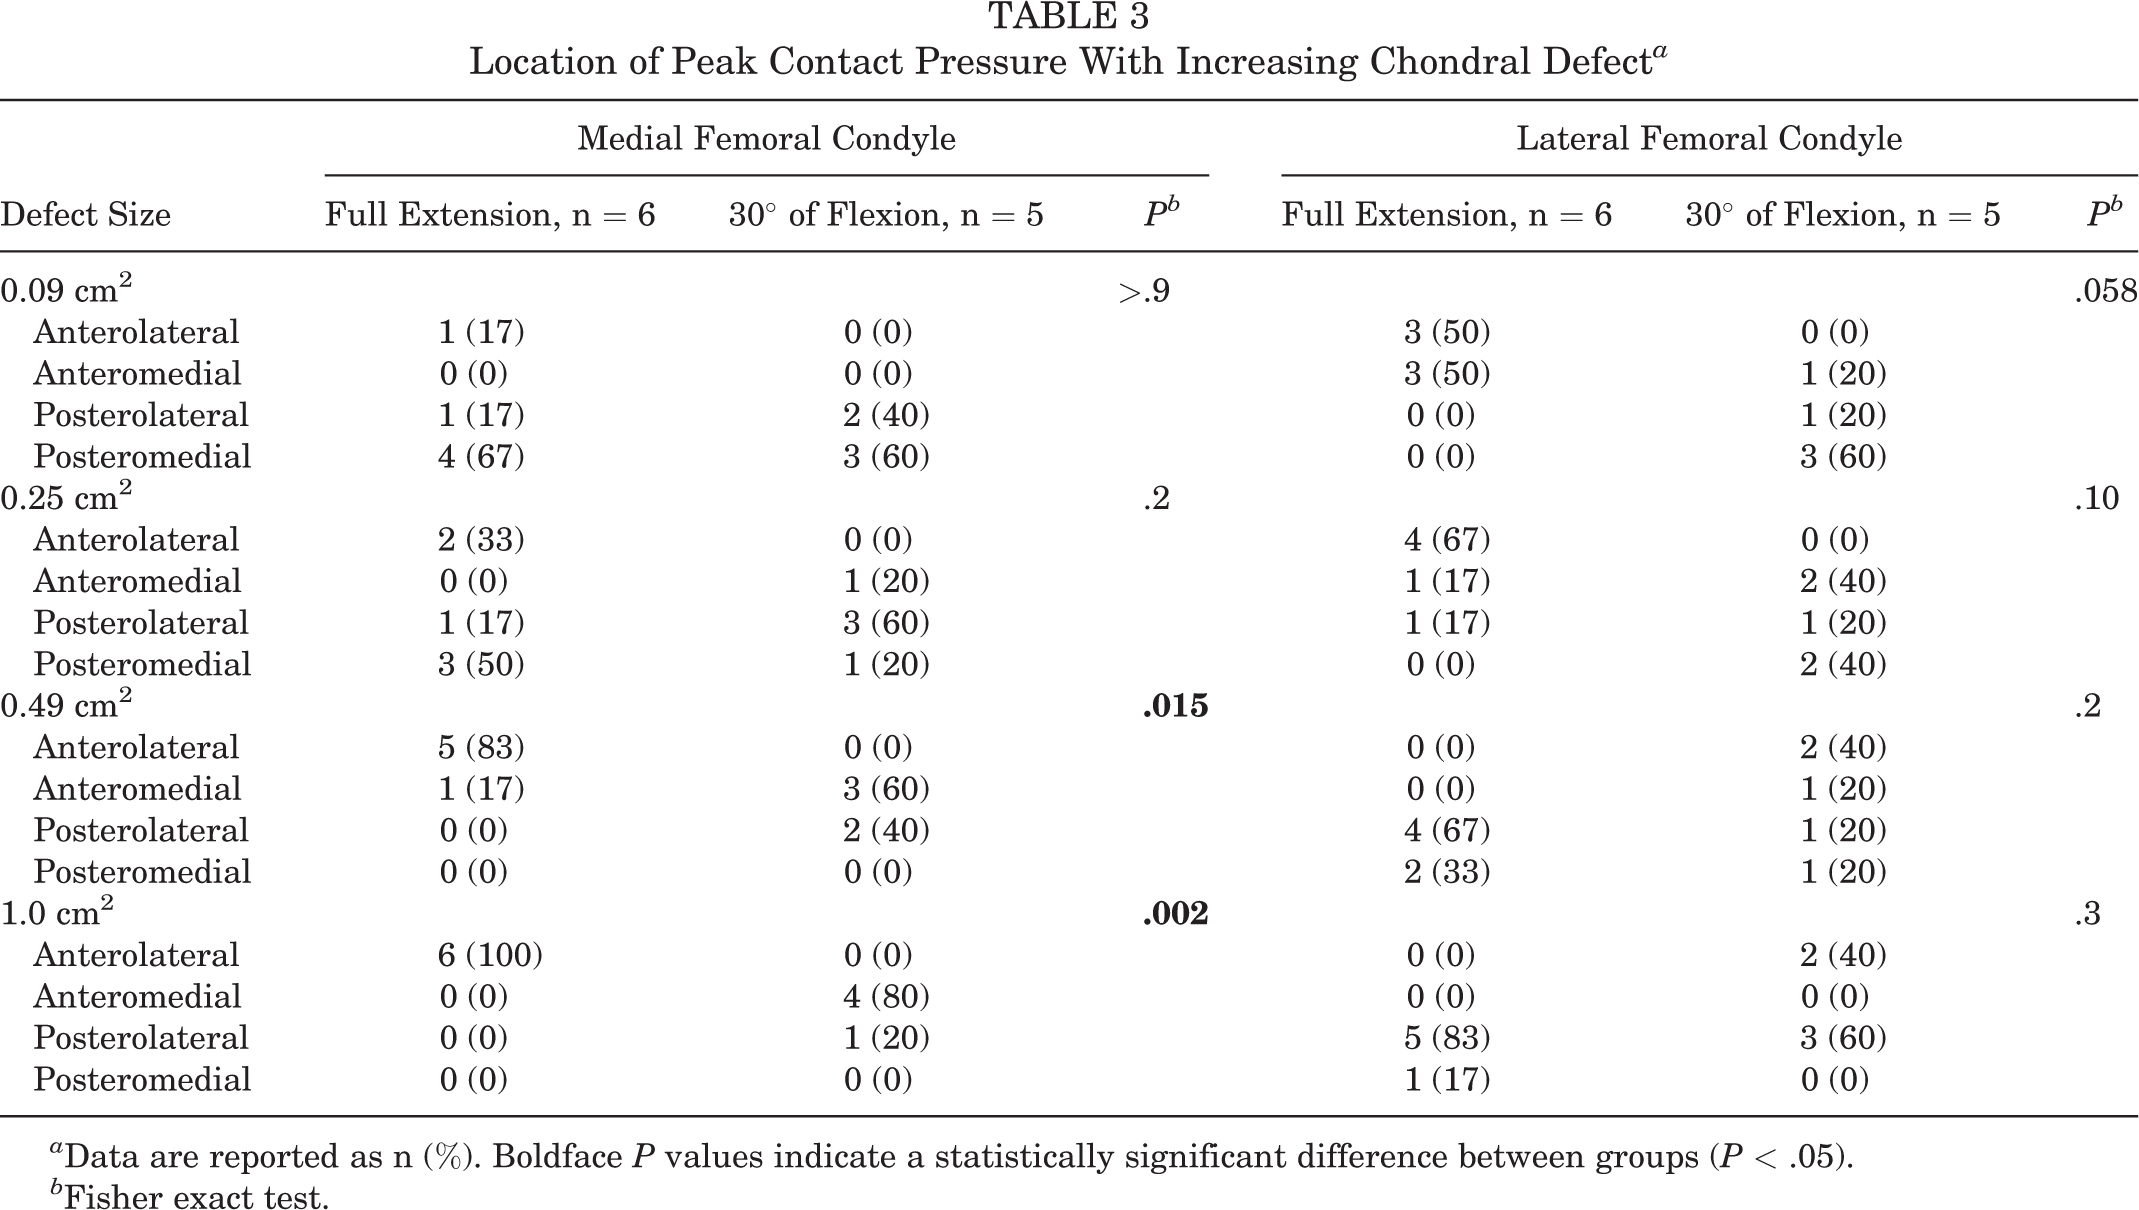
a Data are reported as n (%). Boldface P values indicate a statistically significant difference between groups (P < .05).
b Fisher exact test.
The most common peak contact pressure point for the LFC was found posteromedial in defect size of 0.09 cm2 (3/5 knees; 60%) and posterolateral in defect size of 1.0 cm2 (3/5; 60%). However, the location of maximum pressure was not different with different defect sizes (Table 3). In addition, there was no difference in peak contact pressure between full extension and 30° of flexion testing (P > .05).
Discussion
As hypothesized, both the size and location affected the maximum pressure at the chondral defect rim. In knees loaded at full extension, increasing defect sizes in both femoral condyles led to a significant increase in contact pressure in the surrounding intact cartilage. Full-thickness, square, chondral defects on both condyles led to more considerable cartilage stress after reaching a defect size of 1.0 cm2. In addition, the point of maximum pressure shifted anterolaterally from the center of the defect for sizes >0.49 cm2 on the MFC and posterolaterally for defect sizes ≥0.49 cm2 on the LFC. This effect may be evidence of force and contact area redistribution after the defect reaches 0.49 cm2 in size.
Notable differences in contact pressure patterns were observed when the defects were re-created posteriorly in both femoral condyles and the knees were loaded at 30° of flexion. The location of peak contact pressure on the MFC shifted anteromedially after defect sizes reached 0.49 cm2. No changes in the LFC’s location of the maximum contact pressure point were observed. Peak contact pressures around the rim of the defect in both femoral condyles were not different from those observed at full extension. These changes in contact area redistribution and cartilage stress in the 0.49- to 1.0-cm2 range may affect cartilage integrity around the defect in the long term, as cartilage has a limited healing capacity. 16,17
Articular cartilage lesions are commonly found in the knee joint’s patella, MFCs, and LFCs. 27 Approximately 39% and 25% of chondral lesions have a total area of <0.5 and between 0.5 and 1.0 cm2, respectively. 27 However, the natural progression of chondral defects in the knee is poorly understood. Chondrocyte apoptosis and cartilage degradation occur dose dependently, with peak pressures as low as 4.5 MPa in bovine knees. 18 Our study found peak pressures around the rim of full-thickness defects as small as 0.49 cm2 to exceed this threshold in both human MFC and LFC (5.91 and 5.28 MPa, respectively). Additionally, contact pressures in both femoral condyles rose as defect sizes increased to 1.0 cm2. In the LFC, contact pressures for defect sizes of 1.0 cm2 were 1.3 (5.8/4.5 MPa) times larger than those pressures known to cause cartilage degradation in bovine knee cartilage, 18 and these pressures were 1.6 (5.81/3.63 MPa) times larger than pressures observed in the 0.09-cm2 defect. At 1.0 cm2, contact pressures in the MFC were 1.5 (6.9/4.5 MPa) times larger than those needed to cause cartilage damage 18 and 1.6 (6.91/4.30 MPa) times larger than those observed initially in 0.09-cm2 defects. Taken together, these data suggest that defect sizes as small as 1.0 cm2 may be more injurious than previously thought. 1
Given the poor regenerative capacity of cartilage, lesions as small as 0.49 cm2 may not heal spontaneously without intervention. 17 While our peak stress is evaluated in the presence of defects and under normal loading conditions, one would anticipate that the peak stresses would increase dramatically when ramping up the compressive load or cyclical load above a threshold of 1000 cycles.
While nonoperative treatment for articular cartilage lesions may provide satisfactory symptomatic relief, it may not prevent further damage within the knee joint. In fact, radiographic signs of osteoarthritis and joint space reduction have been observed in a 14-year prospective study for lesions 1 cm2 or larger. 20 These lesions persist over time even if associated ligamentous deficiencies are addressed. 8 Cartilage restoration surgery for articular cartilage lesions is often indicated only after nonoperative and physical therapy has failed. For example, marrow stimulation techniques elicit the formation of fibrocartilage over the defect, but fibrocartilage has inferior wear characteristics compared with hyaline cartilage. 4,22 Cartilage replacement and other biologic techniques intend to overcome these limitations by utilizing hyaline and hyaline-like cartilage to correct chondral defects. Still, these techniques may lead to more surgeries, higher costs, and prolonged postoperative periods. 1 Therefore, careful preoperative planning and surgical indication should consider defect location, size, orientation, and the patient’s physical demands and characteristics.
However, the gold standard treatment algorithm for articular cartilage lesions does not consider important biomechanical characteristics within the knee joint. 1,10,11 For example, the algorithm does not distinguish between MFC and LFC lesions despite these having distinct biomechanical stresses. 1 In a bovine model, intra-articular location and orientation of a femoral condyle chondral defect significantly influenced femoral subchondral bone contact within the defect and the threshold at which subchondral bone contact occurred within the defect. 10,11 Our human cadaveric study findings suggest that the locations of maximum contact pressures in the MFC are different from those observed in the LFC. Our study also found that the intracondylar location of the defect may also influence contact area redistribution throughout different arcs of knee motion, as the MFC experienced shifts in the location of the maximum contact pressure once the defect had reached an area of 0.49 cm2 from posteromedial to anterolateral of the defect.
These findings are similar to those seen in the pressure heat maps generated by the finite element model from Peña et al, 24 demonstrating that increased defect sizes from 0.78 cm to 3.14 cm on the MFC led to increases in anterolateral pressures. These findings suggest that the inter- and intracondylar location of chondral defects affects contact pressure patterns differently within the tibiofemoral joint, so the specific location of the femoral chondral defect should be taken into consideration during the evaluation and treatment of articular cartilage lesions in the knee. Additionally, this study utilized static loading of the tibiofemoral joint during mechanical testing. During the gait cycle and in activities of daily living, increased contact pressures and changing deformation location have been observed in in vivo human models. 2,7
Finally, the size cutoff commonly used for defects in the femoral condyle may need to be revisited to consider recent biomechanical research. In the study by Flanigan et al, 11 subchondral bone contact in both MFCs and LFCs occurred below the upper limit of 3 cm2 proposed by the algorithm. 1 Our study showed contact area redistribution and a significant increase in cartilage stress at defect sizes of 0.49 cm2 to 1.0 cm2, while the algorithm does not differentiate between articular cartilage lesions until 3 cm2. In other words, the size cutoff proposed in the algorithm may not be sensitive enough to guide a surgeon’s decision-making process. Our findings contribute to an ever-growing body of evidence that suggests that current treatment algorithms should be updated to reflect current research on cartilage restoration, as lesions’ inter- and intracondylar location, size, and geometry affect the biomechanical properties of these lesions and the success of different restoration techniques. 10,11,25,28 Future studies should focus on applying defect location, size, geometry, and orientation to indicate other cartilage restorative procedures.
Limitations
Our study is not without limitations. The pressure at the rim of the defect is challenging to measure using the Tekscan sensors, as the independent piezoelectric units variably overlap with the chondral defect rim. By analyzing peak pressures in the 3 mm surrounding the rim of the defect, this study chose to assess cartilage at risk of degradation. Additionally, this study focused on examining chondral defects of sizes smaller than currently addressed in the clinical treatment algorithm. Therefore, these results do not handle the pressure experienced by the exposed subchondral bone within full-thickness chondral defects, as the small defect edge size minimized intralesion contact. Furthermore, a 600-N uniaxial load was applied during mechanical testing, which may not mimic the shear forces and varying load during in vivo walking, pivoting, or cutting activities in sports. Finally, as with all cadaveric models, the regenerative properties of cartilage, although minimal, cannot be assessed.
Future studies should assess the wall stress within the defect, the subchondral bone below the defect, and its effect on chondral defect propagation. Similarly, more histological studies are needed to characterize the extent of cartilage degeneration at the rim of the defect and the progression of the articular cartilage lesion. Finally, while our experiment evaluated the biomechanical changes caused by full-thickness chondral lesions in the MFC and LFC, further research needs to be performed to understand the effects of chondral lesions in the patella, trochlea, and medial and lateral tibial plateaus.
Conclusion
Taken together, these findings suggest that biomechanical size cutoffs may exist earlier in the development of full-thickness chondral defects than previously realized. Although current algorithms for articular cartilage lesions recommend more aggressive interventions after lesions exceed 2 to 3 cm2, our study suggests a lower threshold size over which the treatment of full-thickness chondral defects should change. The present study found size cutoffs for changing biomechanical parameters as small as 0.49 cm2 in full-thickness chondral defects, although it did not find differences in contact pressures for chondral defects at 2 locations within the femoral condyles. These results may be used to better inform surgical treatment decision making for managing chondral defects.
Footnotes
Final revision submitted June 29, 2022; accepted July 27, 2022.
One or more of the authors has declared the following potential conflict of interest or source of funding: J.K. has received education payments from Midwest Associates and consulting fees from Flexion Therapeutics. AOSSM checks author disclosures against the Open Payments Database (OPD). AOSSM has not conducted an independent investigation on the OPD and disclaims any liability or responsibility relating thereto.
Ethical approval was not sought for the present study.