
Abstract
Background:
Seminal classifications of degenerative arthritis of the shoulder (DAS) describe either cuff tear arthropathy in the coronal plane or primary osteoarthritis in the cross-sectional plane. None consider a biplanar eccentricity.
Purpose/Hypothesis:
The purpose of this study was to investigate humeroscapular alignment (HSA) of patients with DAS in both the anteroposterior (A-P) and superoinferior (S-I) planes on computed tomography (CT) after 3-dimensional (3D) reconstruction and develop a classification based on biplanar HSA in 9 quadrants. It was hypothesized that biplanar eccentricity would occur frequently.
Study Design:
Cross-sectional study; Level of evidence, 3.
Methods:
The authors analyzed 130 CT scans of patients who had undergone shoulder arthroplasty. The glenoid center, trigonum, and inferior angle of the scapula were aligned in a single plane using 3D reconstruction software. Subluxation of the HSA was measured as the distance from the center of rotation of the humeral head to the scapular axis (line from trigonum through glenoid center) and was expressed as a percentage of the radius of the humeral head in both the A-P and the S-I directions. HSA was described in terms of A-P alignment first (posterior/central/anterior), then S-I alignment (superior/central/inferior), for a total of 9 different alignment combinations. Additionally, glenoid erosion was graded 1-3.
Results:
Subluxation of the HSA was 74.1% posterior to 23.5% anterior in the A-P direction and 17.2% inferior to 68.6% superior in the S-I direction. A central HSA was calculated as between 20% posterior to 5% anterior (A-P) and 5% inferior to 20% superior (S-I), after a graphical analysis. Posterior subluxation >60% of the radius was labeled as extraposterior, and static acetabularization was labeled as extrasuperior. Overall, 21 patients had central-central, 40 centrosuperior, and 1 centroinferior alignment. Of 60 shoulders with posterior subluxation, alignment was posterocentral in 31, posterosuperior in 25, and posteroinferior in 5. There were 3 patients with anterocentral and 4 anterosuperior subluxation; in addition, 4 cases with extraposterior and 17 with extrasuperior subluxation were identified.
Conclusion:
There was a high prevalence of biplanar eccentricity in DAS. The 3D classification system using combined HSA and glenoid erosion can be applied to describe DAS comprehensively.
The characteristics of glenoid morphology and alignment in degenerative arthritis of the shoulder (DAS) have typically been classified according to primary osteoarthritis (OA) in the cross-sectional plane or cuff tear arthropathy (CTA) in the coronal plane. The widely used modified Walch classification of glenohumeral OA uses cross-sectional computed tomography (CT). 1,21 CTA is categorized using the Hamada classification, which relies on anteroposterior (AP) x-ray images. 8 The Favard classification 4 further classifies the resulting glenoid wear also using AP x-rays (Table 1).

a A-P, anteroposterior; CT, computed tomography; CTA, cuff tear arthropathy; OA, osteoarthritis.
These commonly used seminal classification systems for DAS are based on 2-dimensional descriptions; however, none consider biplanar eccentricity. Several studies have since investigated the glenoid wear patterns in DAS in great detail and have found a combined eccentricity of the erosion sites. 1,5,9,13,17 –19,22 Biplanar eccentricity in shoulder arthritis has also been documented in terms of humeroscapular alignment (HSA); Jacxsens et al 11 showed, on average, a posteroinferior alignment in cases classified as Walch type B1. However, there are little data regarding HSA in 3 dimensions in DAS.
The purpose of the present study was to investigate HSA in both the anteroposterior (A-P) and the superoinferior (S-I) planes in patients with DAS and to determine whether existing classifications describe the disease comprehensively. We aimed to create a 3-dimensional (3D) CT classification that encompasses alignment in both planes as well as glenoid erosion. We hypothesized that biplanar eccentricity would be found frequently.
Methods
Study Population
For this descriptive cohort study, we identified patients who had received a primary shoulder prosthesis (total shoulder arthroplasty, reverse shoulder arthroplasty, or hemiprosthesis) between 2009 and 2020 at the Department of Orthopaedic Sports Medicine of the University Hospital Rechts der Isar in Munich using a database search. Operative reports were assessed for a diagnosis of DAS (as type OA or CTA). Shoulders with diagnoses other than CTA or OA or without the availability of CT scans were excluded from the investigation. Of 299 shoulders undergoing primary shoulder replacement, 243 had a diagnosis of DAS. For 135 of these cases preoperative CT scans, performed according to a standardized in-house protocol (slice thickness, 0.9 mm; pitch, 0.39; tube current, 82 mA [range, 50-115 mA]; tube voltage, 120 kV), were available for analysis. All CT scans were taken less than 6 months before surgery. Five CT scans had to be excluded from the analysis: 2 for inadequate exposure of the scapula, 1 for movement artifact, and 2 for extreme erosion, which did not allow for reliable placement of the landmarks for measurement. The remaining CT scans of 130 shoulders were included in the study.
Demographically, the study patients had a mean age of 69.7 years (range, 38-88 years), and 60 (46%) were male. The diagnosis leading to arthroplasty had been documented as OA in 52 cases (40%) and CTA in 78 cases (60%).
Measurements
The analysis of the CT scans was performed by 2 experienced orthopaedic residents (B.D.K. and M.H.) with an interest in shoulder surgery, using a standardized self-developed protocol that was adapted from methods found in the literature. 6,11,12,25 First, glenoid morphology was described using the existing classifications for shoulder OA (modified Walch, 1 Favard, 4 and Hamada 8 ), as has previously been done using CT. 20 This was done in consensus between the 2 observers.
Next, we used clinical 3D medical image viewing software (IDS7 Workstation Version 22.2; Sectra) to align the glenoid center, trigonum, and inferior angle of the scapula in a single plane. This reconstruction has previously been described as the scapular plane. 11,12,18 To ascertain the glenoid center, the midpoint was defined in the cross-sectional and coronal planes, disregarding osteophytes. The scapular axis was defined as a line passing through the scapular trigonum and glenoid center, in corroboration with previous work 11,12,18 (Figure 1). Placing a best-fit circle on the humeral head that followed the articular surface (where intact) and reliably intersected preserved extra-articular landmarks at the borders of the articular surface allowed an accurate determination of the center of rotation and size of the humeral head. 25 The center of rotation of the humeral head was always determined at the widest part of the ellipse of the humeral head in the coronal and cross-sectional views of the scapular plane, respectively, and then translated to the level of the scapular axis. This was particularly relevant to determine the center of rotation accurately in cases with a high degree of subluxation.
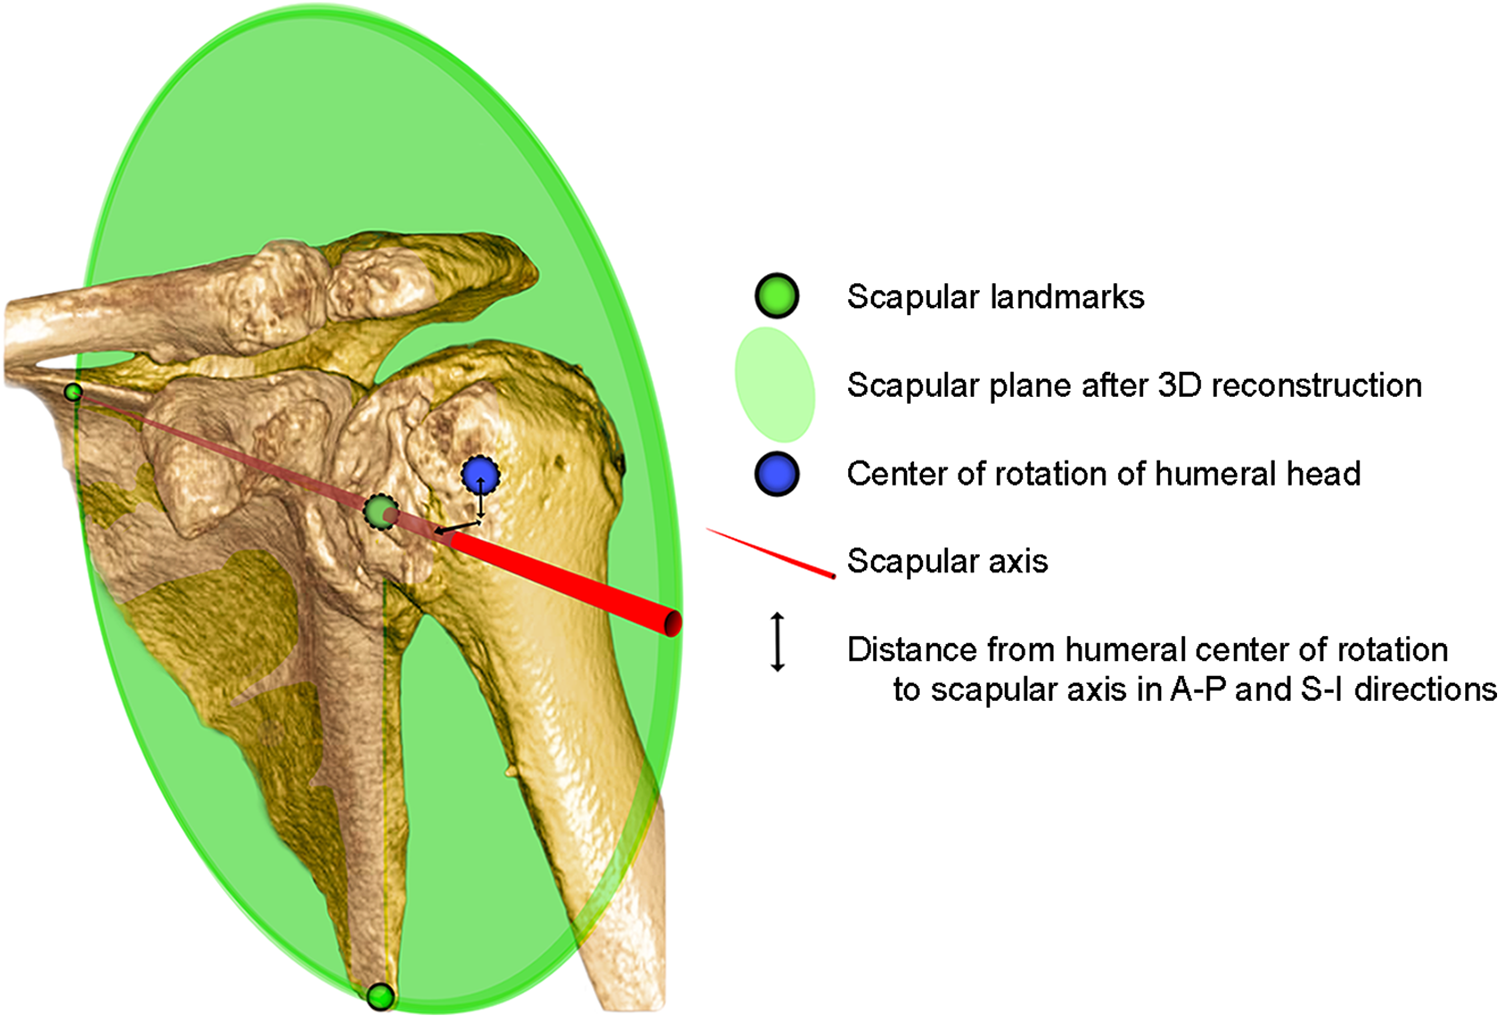
A 3-dimensional (3D) computed tomography reconstruction illustrating the scapular plane using the trigonum, glenoid center, and inferior angle of the scapula as landmarks. The scapular axis is the line passing from the trigonum through the glenoid center in this plane. The eccentricity of the center of rotation of the humeral head was measured as the distance to the scapular axis in both the anteroposterior (A-P) and superoinferior (S-I) directions.
The amount of subluxation of the humeral head was then determined by measuring the distance of the center of rotation of the humeral head from the scapular axis in both the A-P and the S-I directions, as has previously been reported 12 (Figure 2). To correct for patient size, this was expressed as a percentage of the radius of the humeral head (similar to the method of describing subluxation in terms of diameter 23 ) (Figure 3) in the corresponding plane using the following formula:

When calculated for each plane, respectively, this created vector coordinates where (0%, 0%) is the center.

Measurement of humeroscapular alignment on (A) coronal plane and (B and C) cross-sectional plane computed tomography scans, after reconstruction of the scapular plane in 3 dimensions. (B) The center of rotation of the humeral head is determined at the widest part of the head and (C) is then translated down to the level of the scapular axis for measurement of subluxation. (D) Where there is higher-grade erosion with partial humeral head collapse and osteophytes, measurement is more challenging. Osteophytes (red arrow), whether on the humeral or glenoid side, must be disregarded. The center of rotation is determined with the aid of the intact outer margins of the humeral joint surface (blue stars).
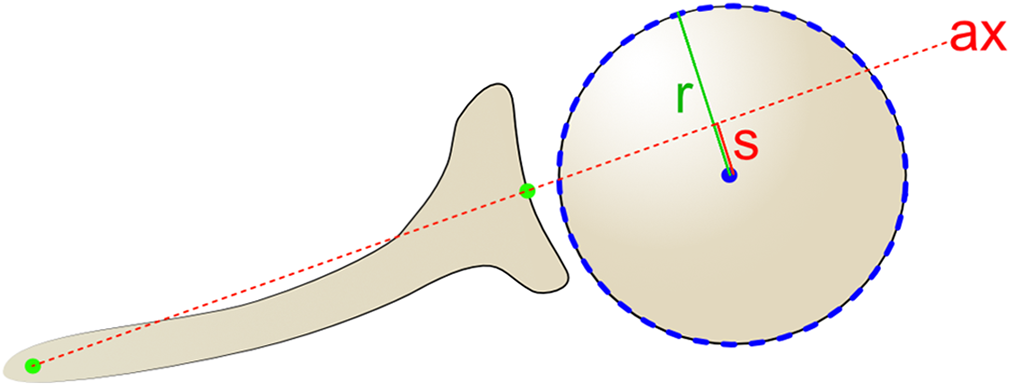
Method for determining the percentage of subluxation, s, of the center of rotation of the humeral head from the scapular axis, ax, relative to the radius, r, using the given formula.
Both observers measured all CT scans independently. Where large differences in measurements (>10%) occurred, the cases were reassessed together until a consensus was reached.
Finally, reconstructed coronal, cross-sectional, and sagittal CT planes were assessed to classify glenoid erosion (the third dimension). This was done according to a grading system which was based on previous studies and adapted for the 3D concept. 1,4 According to our descriptive observations, erosion was categorized into 3 types: grade 1, no significant bony erosion; grade 2, erosion causing a biconcavity if eccentric or a central crater; and grade 3, neoglenoid covering the entire glenoid surface in a single plane (or severe central erosion including the glenoid rim) (Figure 4). All shoulders were graded accordingly, and the grade of erosion was combined with the alignment type to complete the 3D classification.
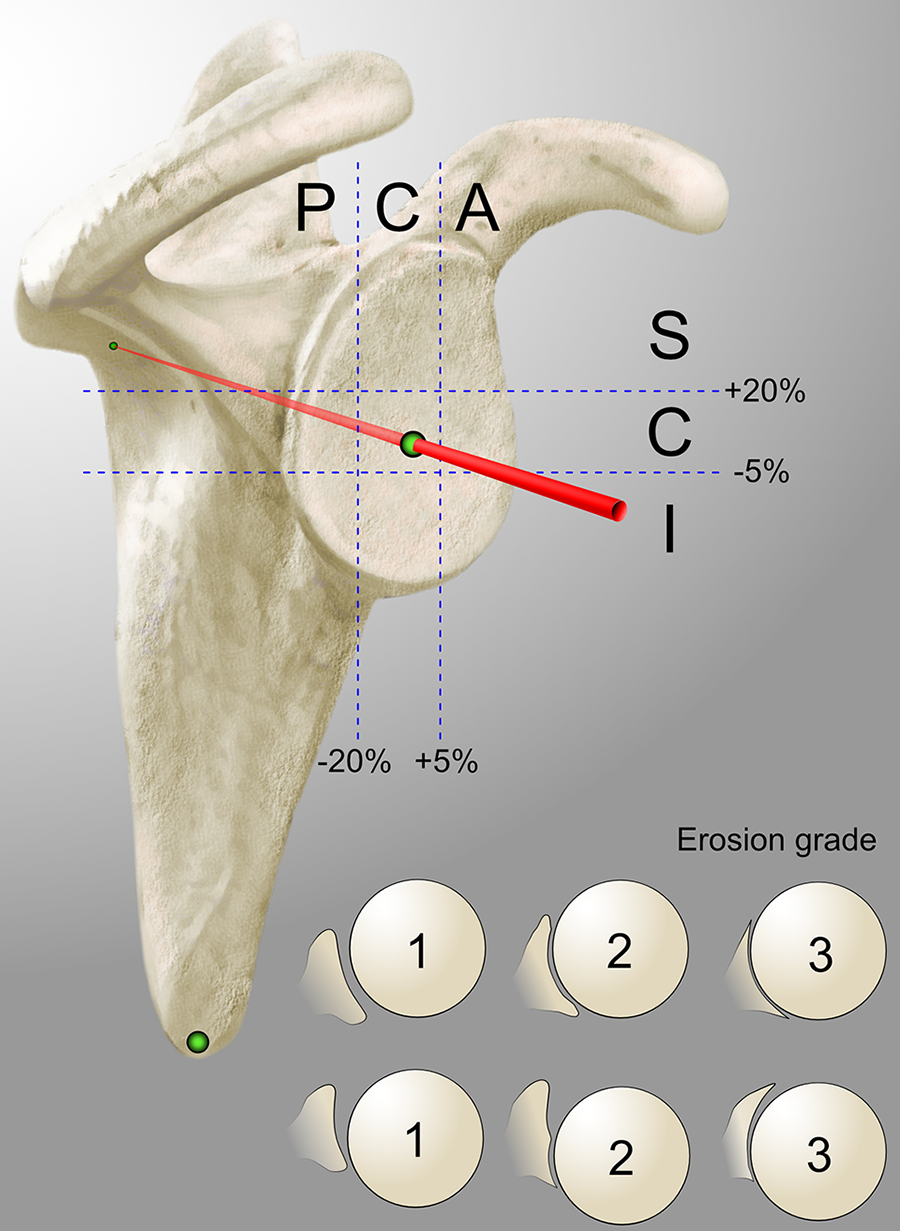
Diagrammatic representation of the 3-dimensional classification for degenerative arthritis of the shoulder. The humeroscapular alignment was described in terms of subluxation of the center of rotation of the humeral head in the anteroposterior direction (posterior [P]/central [C]/anterior [A]) and the superoinferior direction (superior [S]/central [C]/inferior [I]), for a total of 9 different combinations. Erosion was graded from 1 to 3, where 1 = no significant bony erosion, 2 = focal erosion forming a crater or biconcavity of the glenoid (in any location), and 3 = severe glenoid erosion involving the entire glenoid surface in any single plane (central or eccentric).
Statistical Analysis
The statistical analysis was performed using SPSS Version 26.0 (IBM Corp) software. The intraclass correlation coefficient (ICC) was used to measure reproducibility of the measurements between the 2 observers. Normal distribution was confirmed using the Shapiro-Wilk test. The Student t test was used to measure the significance of differences in normally distributed data sets, with the significance level set at P = .05. Values for measurements were rounded to 1 decimal place, and values for standard deviation as well as the ICC to 3 decimal places. As all available CT scans matching the inclusion criteria were included, a power analysis was not performed.
Results
The results of DAS classification of the 130 shoulders according to the coronal (modified Walch 1 ) and cross-sectional (Hamada 8 and Favard 4 ) planes frequently suggested a biplanar eccentricity (Table 2), which none of the existing classification systems were able to comprehensively describe.

a Data are reported as number of shoulders. DAS, degenerative arthritis of the shoulder.
The mean diameter of the humeral head was 44.4 ± 4.05 mm (range, 36.1-55.8 mm) in the cross-sectional plane and 47.0 ± 4.02 mm (range, 36.5-56.2 mm) in the coronal plane of the reconstructed CT scans. A paired t test showed a significant difference between these values (P < .001), confirming an elliptical shape of the humeral head. The ICC values indicated a high degree of intrarater reproducibility for all measured variables: humeral head diameter (cross-sectional, 0.988; coronal, 0.981), A-P subluxation (0.901), and S-I subluxation (0.971).
Humeroscapular Alignment
In the A-P plane, the HSA ranged from 74.1% posterior to 23.5% anterior (SD, 19.3%) when expressed relative to the radius of the humeral head (absolute values, 16.9 mm posterior to 5.2 mm anterior). These values were then plotted graphically in ascending order (Figure 5). With the aid of this graph, as well as the impression gained while performing the measurements, HSA in the A-P plane was classified into 3 types: anterior (>5% anterior subluxation), central (between 5% anterior and 20% posterior subluxation), and posterior (>20% posterior subluxation). A posterior shift of the range for central alignment was supported by both the graphical analysis and our subjective impression and is probably due to the physiological retroversion of the glenoid. A further subtype (referred to as extraposterior) for particularly severe posterior subluxation was defined for those with >60% posterior subluxation, which corresponded to a notable step in the graph (see Figure 5, green arrow).
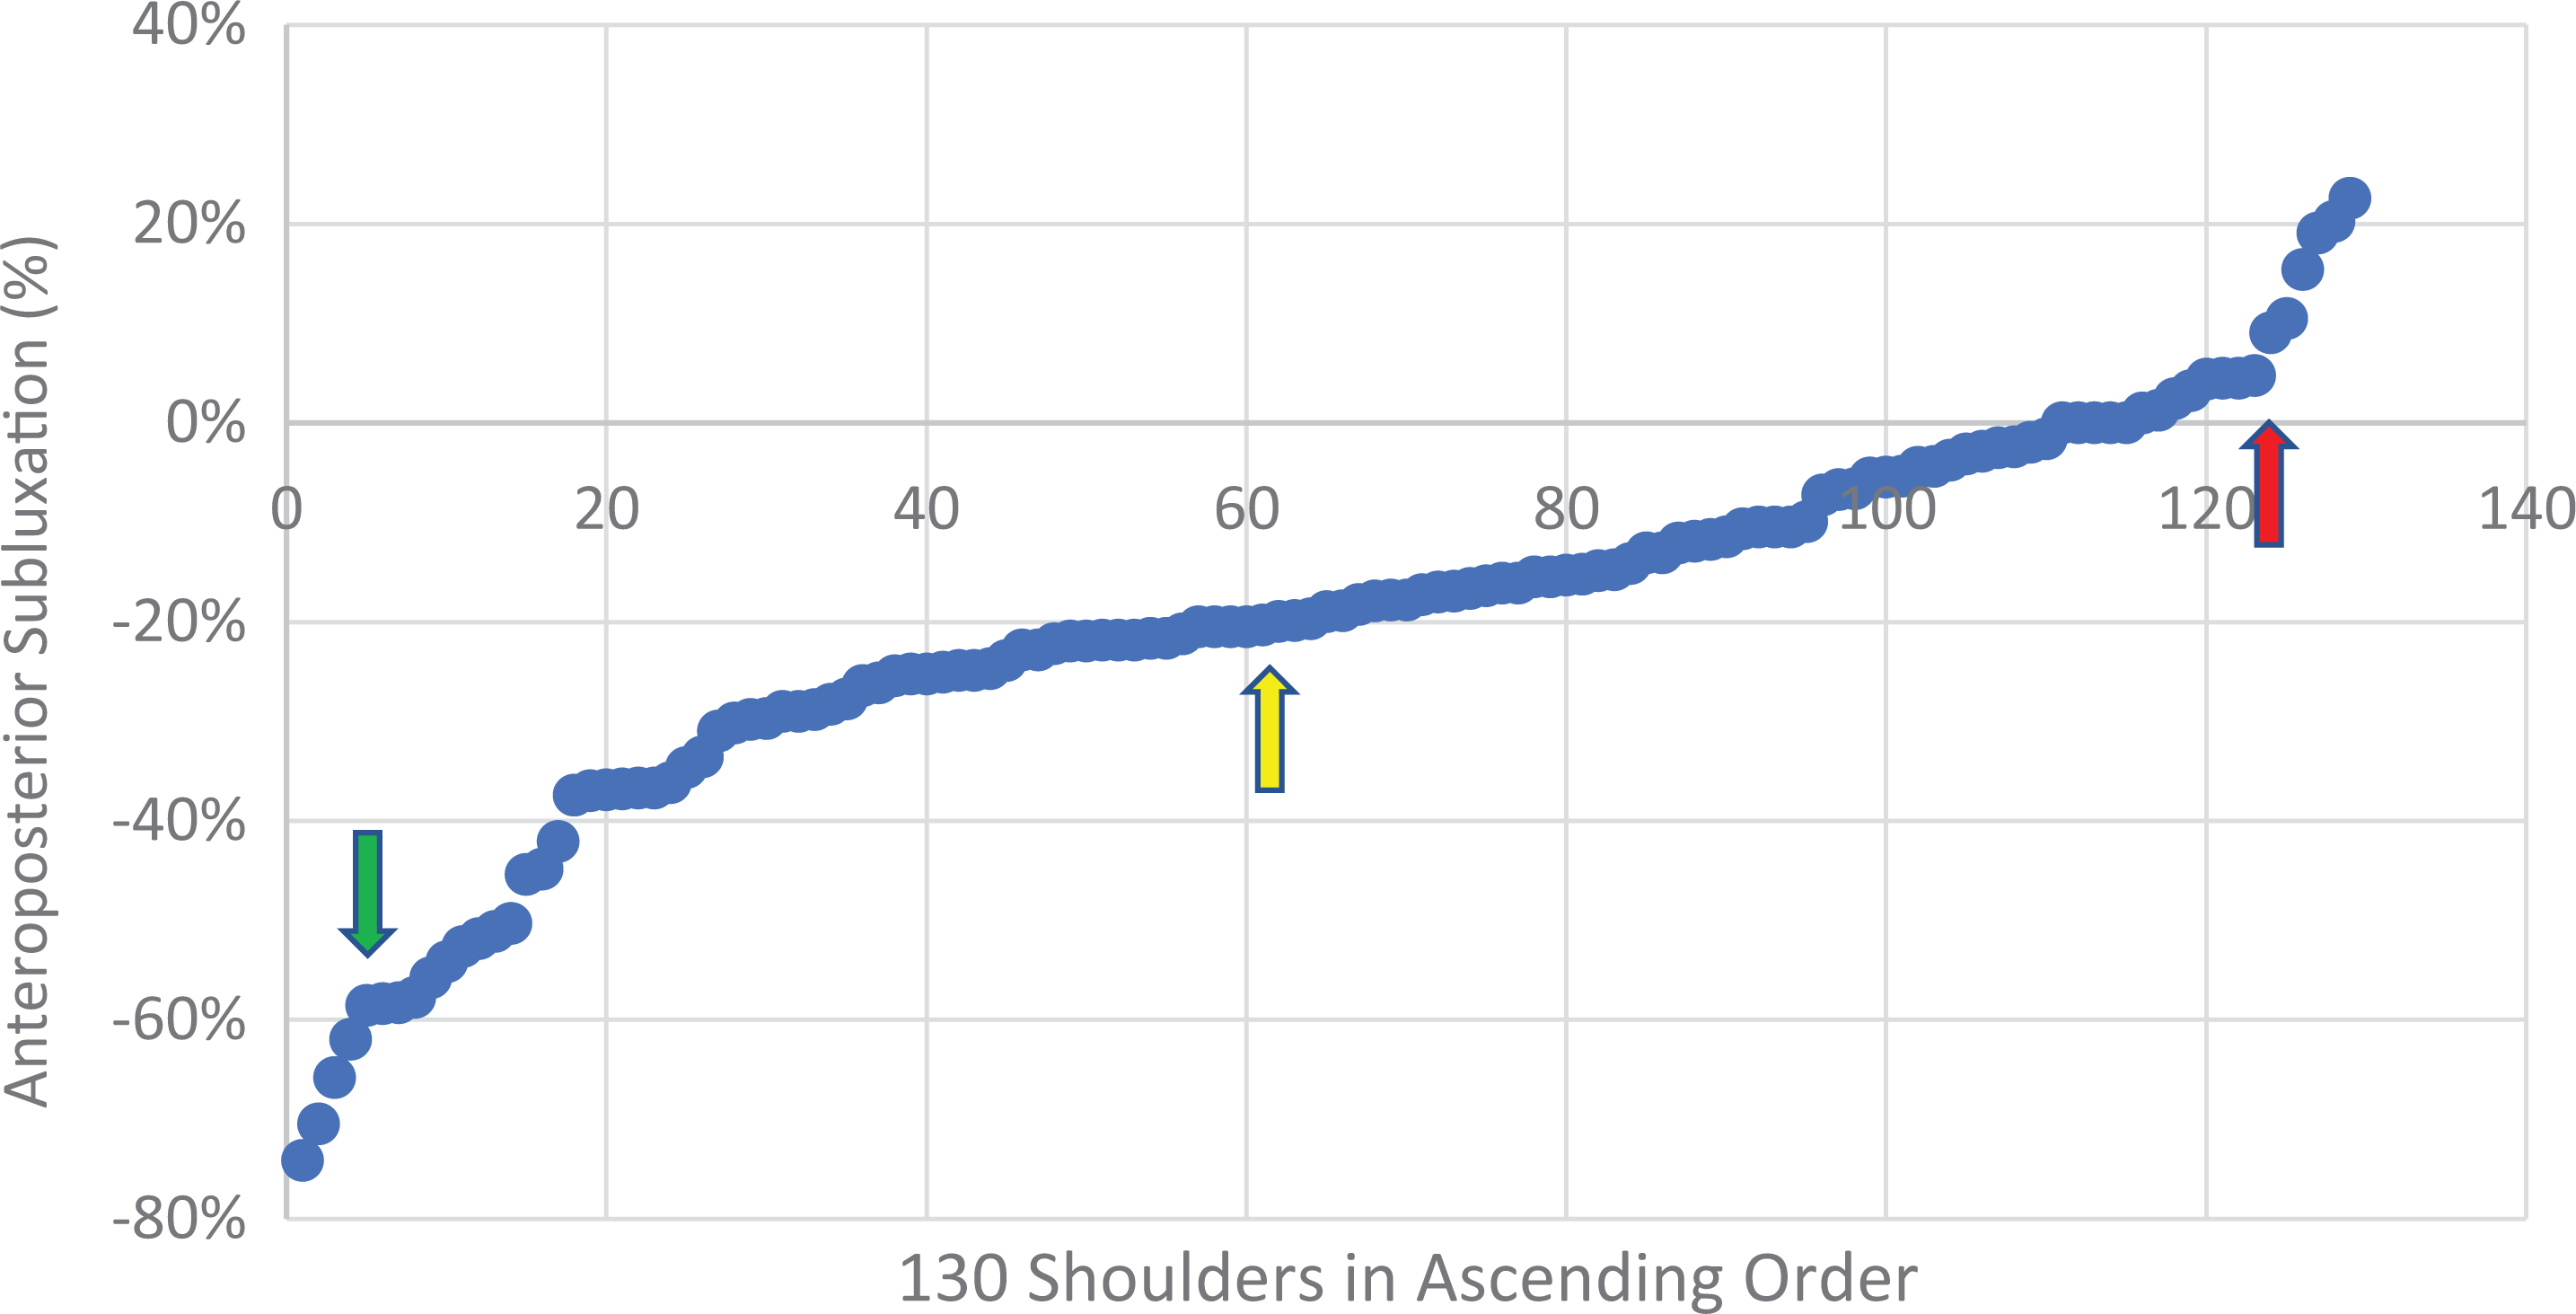
Values for anteroposterior subluxation plotted in ascending order; negative values indicate posterior subluxation. The red arrow marks the step from central to anterior alignment, the green arrow the step from posterior to extraposterior, and the yellow arrow the turning point of increasing posterior subluxation, seen around –20%, which was taken as the defining value between central and posterior alignment.
In the S-I plane, subluxation ranged from 17.2% inferior to 68.6% superior (SD, 17.1%) relative to the radius of the humeral head (absolute values, 4 mm inferior to 16.8 mm superior). These values were also plotted graphically in ascending order (Figure 6) and were classified into 3 types: superior (>20% superior subluxation), central (between 5% inferior and 20% superior subluxation), and inferior (>5% inferior subluxation). A superior shift of the range for central alignment was again supported by both the graphical analysis and our subjective impression and is probably due to the physiological inclination of the glenoid as well as the tension of the deltoid muscle. Additionally, a further subtype for those with extreme superior subluxation (referred to as extrasuperior) was defined for those with static acetabularization. All patients with >50% of superior subluxation (a notable step in the Figure 6 graph) were included in this subtype. Other cases with established acetabularization but <50% subluxation were unable to shift further superiorly because of the bony obstruction, which is why the absolute value of subluxation was not taken as the cutoff for this group.
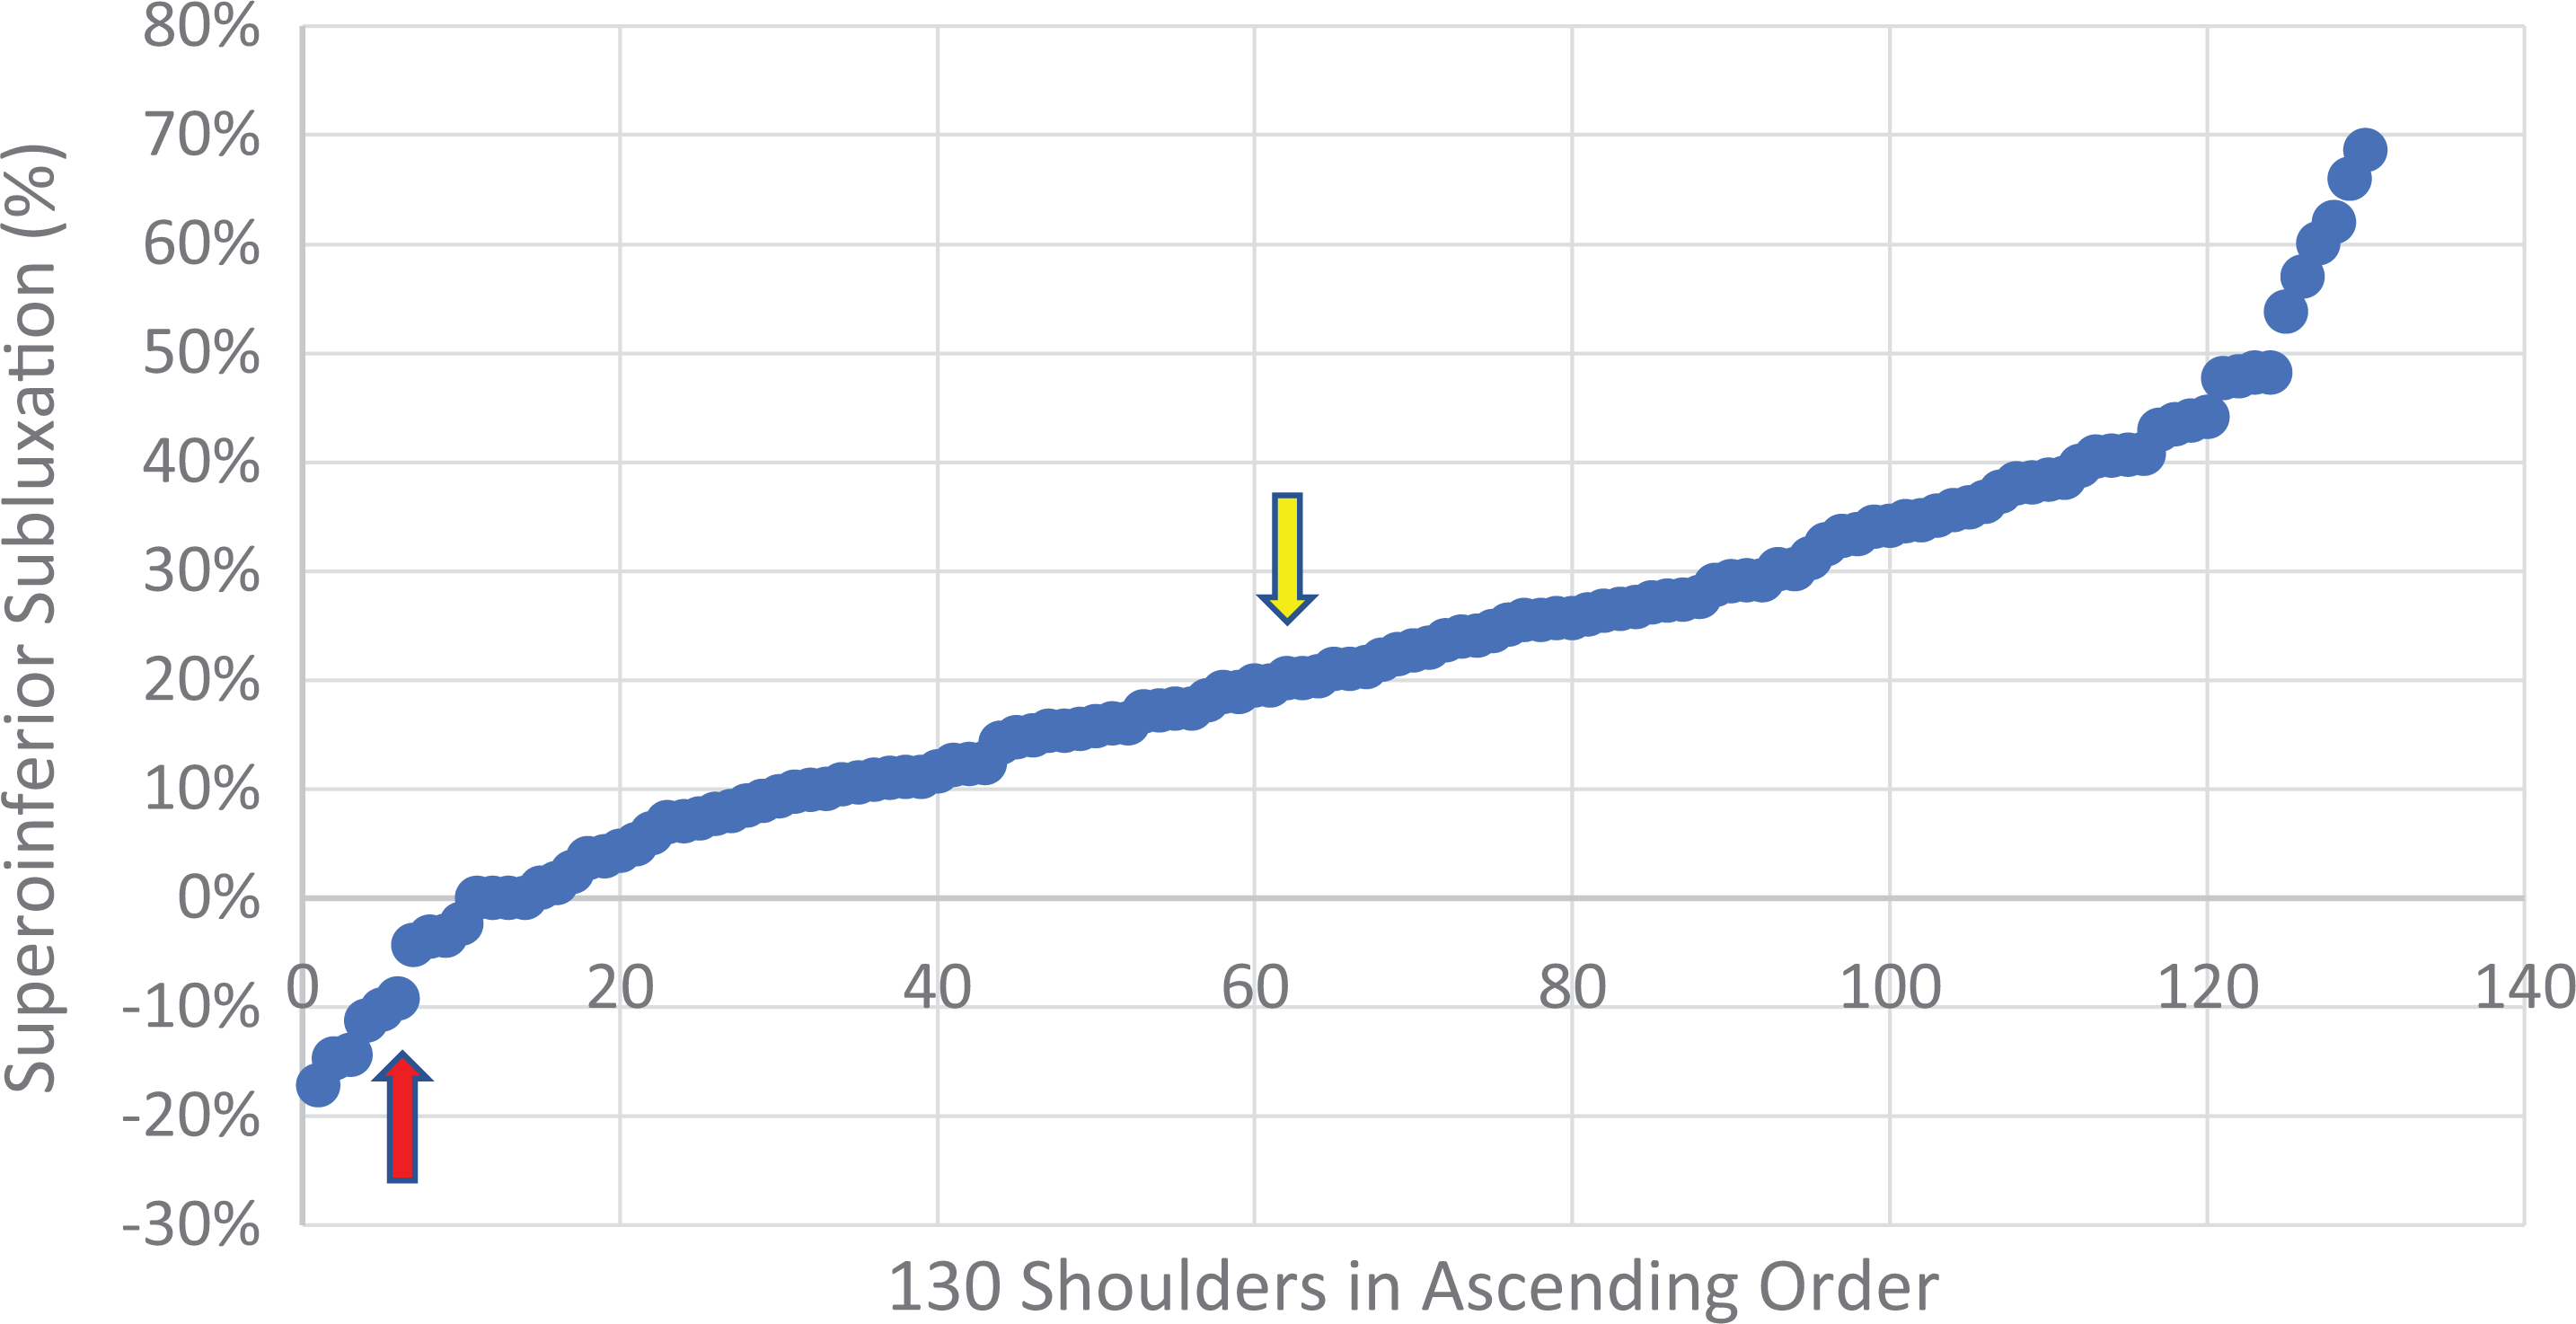
Values for superoinferior subluxation plotted in ascending order; negative values indicate inferior subluxation. The red arrow marks the step from central to inferior alignment, and the yellow arrow identifies the turning point of increasing superior subluxation, seen at around 20%, which was taken as the defining value between central and superior alignment.
Using these values to categorize the HSA, the 130 shoulders were classified into the 9 possible combinations, as seen in Table 3. Only 21 shoulders were found to be centered in both planes. Biplanar eccentricity was found in 25 patients with posterosuperior, 5 patients with posteroinferior, and 4 patients with anterosuperior alignment (34/130; 26%).
Frequency of Cases According to the Categorization System of HSA a

a Data in parentheses indicate the number of shoulders additionally defined as having extraposterior (XP) or extrasuperior (XS) alignment. HSA, humeroscapular alignment.
The mean % A-P and S-I subluxation values for each alignment type can be found in Table 4. There was a significant difference in patients with anterior versus central versus posterior A-P subluxation (P < .001; Student's t test), as well as in patients with superior versus central versus inferior S-I subluxation (P < .001; Student's t test).
A-P and S-I Subluxation for Each Alignment Type a

a Data are reported as mean ± SD (range). Negative values indicate posterior (anteroposterior [A-P] direction) or inferior (superoinferior [S-I] direction) subluxation. The values are ranges of subluxation in each group of the classification, expressed in %. Dashes indicate none.
Glenoid Erosion
The frequency of the various glenoid erosion grades according to HSA alignment type is shown in Table 5. Figure 7 shows examples of grade 2 erosion, and Figure 8 shows an example of grade 3 erosion.
Frequency of Cases According to HSA Type and Erosion Grade a

a HSA, humeroscapular alignment. Blank cells indicate no cases.
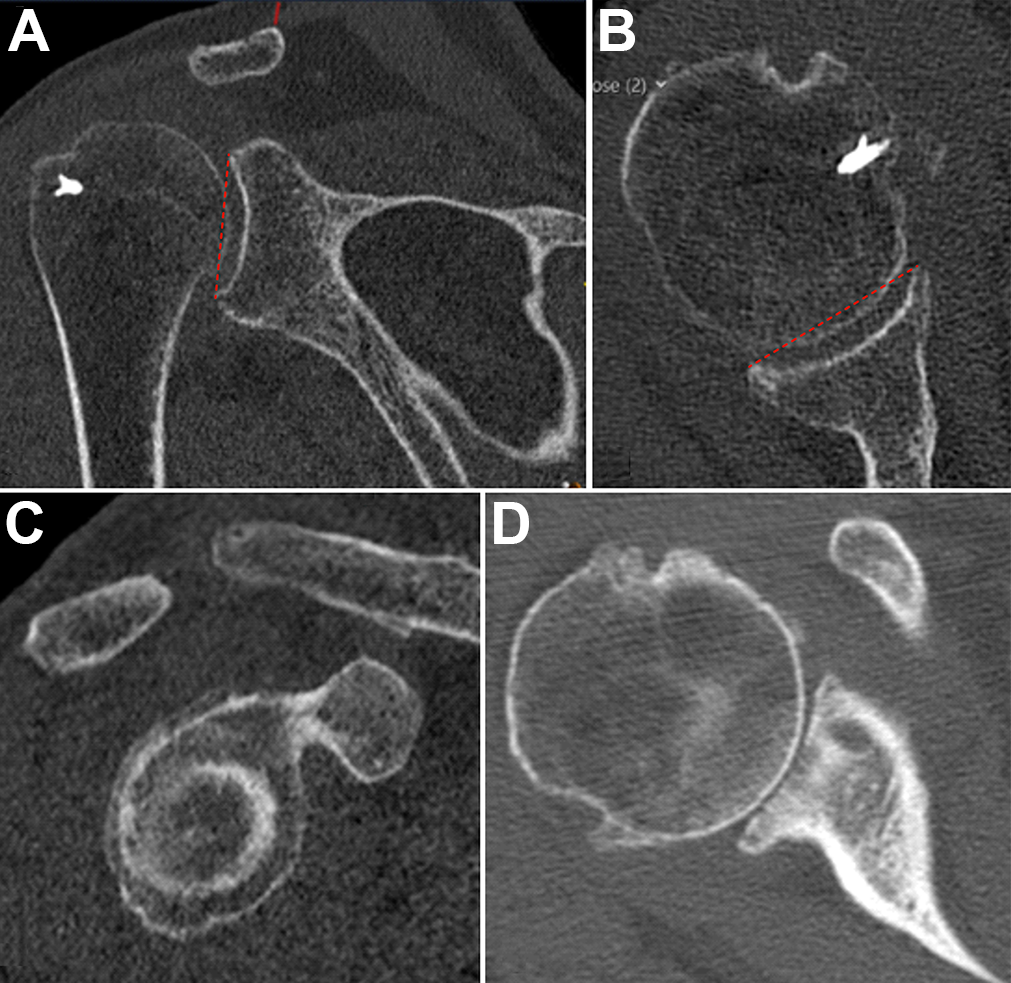
An example of grade 2 central-central erosion shown on computed tomography: (A) coronal, (B) cross-sectional, and (C) sagittal planes. There is medialization of the humeral head, and it bisects a line (dashed red line) drawn between the anterior and posterior and/or superior and inferior glenoid rim, as described previously. 1 (D) An example of grade 2 erosion with a central crater but without involvement of the entire glenoid surface.

An example of grade 3 central-central erosion shown on computed tomography: (A) coronal and (B) cross-sectional planes. The entire glenoid surface, including the rim, is eroded and the humeral head is embedded.
Discussion
The findings of this study can be applied to quantify and categorize alignment of DAS. This will modernize and combine the findings of previous seminal studies that have classified arthritis of the shoulder. 1,4,8,9,21 Much of how previous classifications described glenoid erosion has been incorporated into this classification 1,4,8,21 and adapted for the 3D concept according to our descriptive observations. New to this classification is that the eccentricity is quantified in both the A-P and the S-I planes and combined with the associated glenoid wear in 3 dimensions. This seems to be important, as our study shows that a biplanar eccentricity is common, representing 26% of this cohort. Overall, we accept our hypothesis that biplanar eccentricity is common and alignment can be categorized into 9 sectors, of which we have found cases in 8. This suggests that to comprehensively describe DAS, a 3D classification such as the one outlined in this work should be used.
Our findings align with a recent study that reported posterior glenoid erosion to be present superiorly, centrally, and inferiorly. 17 Terrier et al 19 also found glenoid erosion to be present in all 3 posterior sectors, as well as anteriorly, but predominantly posterosuperiorly. Jacxsens et al, 11 who assessed HSA in patients with Walch type B1 arthritis and averaged the values between all patients, showed a predominance of the combination of posterior with inferior subluxation of the humeral head. The results from our cohort, in which each patient was assessed individually, are more in line with those of Terrier et al 19 than those of Jacxsens et al. 11 This difference is likely to be in part due to the inclusion of not only OA but both types of DAS (CTA and OA) in our cohort.
In our classification, the grading of glenoid erosion has been adapted from the Walch and Favard systems and modified according to our descriptive observations for the 3D concept. 4,21 In contrast to this, the Lévigne classification of glenoid erosion, which was developed using A-P radiographs of patients with rheumatoid arthritis, categorizes the extent of erosion with reference to the coracoid process. 14 We did not incorporate this into our classification, because while it is useful in describing the depth of erosion on A-P radiographs, it does not describe the localization of erosion and does not transfer well to our 3D CT classification.
The extraposterior alignment type described in this classification (>60% posterior subluxation relative to the radius of the humeral head) corresponds to the cutoff, 80% humeral head subluxation relative to the diameter, for implanting an anatomical prosthesis suggested by Walch et al. 23
Interestingly, not all patients diagnosed with CTA in our cohort had superior subluxation (69 cases with superior alignment, 78 cases of CTA, 8 cases labeled as OA with superior subluxation). It may be that these were cases with early disease (Hamada grade 1), but it is also possible that in some cases the subluxation was greater in the A-P plane after reconstruction. For example, a posterosuperior defect with intact subscapularis may cause little static superior but significant posterior subluxation, still reducing the distance to the acromion that lies posteriorly. This will require further investigation. Of cases with superior subluxation with a diagnosis of OA, 4 had posterosuperior and 4 centrosuperior alignment. This is an important finding and underlines the need to analyze DAS in both planes.
The underlying pathology leading to eccentric glenohumeral arthritis, which is described by our classification, has been investigated to some extent. While direct causality has not been clearly proven, it has been shown that posterior subluxation, preceded by degeneration of the posterior rotator cuff (RC), precedes the development of cartilaginous wear and glenoid erosion in Walch type B cases. 2,24 Increased retroversion/anteversion has also been described as a possible influencing factor. 2,20 Whereas fatty infiltration of the subscapularis muscle leads to arthritis with anterior subluxation, 18 progression of OA can lead to degeneration of all muscles of the RC, culminating in fatty infiltration and dysfunction. 3 Although not yet fully understood, it can be said that to some extent eccentric OA of the glenohumeral joint is, akin to CTA, a disease associated with RC insufficiency. Furthermore, initially centered disease may later become eccentric. 15 As the disease progresses, the RC tendons may degenerate and tear, resulting in a mixed pathology (ie, both OA and CTA). It therefore seems reasonable to describe these diseases in 1 combined classification.
The results of arthroplasty for cases with posterior subluxation are inconsistent. 10,16 Causes for this may include differences in the surgical procedure. However, this may also in part be because the extent of the disease, possibly of a bidirectional nature, is not fully understood by the surgeon preoperatively. Outcomes of cases with biplanar eccentricity may not be comparable to those with unidirectional subluxation, and specific treatment strategies may need to be developed. These may include the use of augmented glenoid components or bone grafting for eccentric erosion. Importantly, cases of OA with superior subluxation may not be suitable for anatomical shoulder replacement and instead require a semiconstrained reverse shoulder arthroplasty. Further studies will be required to determine the clinical significance of this classification.
The 3D reconstruction of the scapular axis has been shown to have a significant effect on measurements of HSA, with which we concur in our own experience. 12 We therefore recommend the use of an image-viewing program that allows a reconstruction of the scapular plane in 3 dimensions when assessing CT scans with this classification. While humeroglenoid alignment is more reproducibly measured than HSA, with and without 3D reconstruction of the scapular plane, this cannot be used to sensitively describe malalignment, as increased/decreased retroversion or inclination will lead to a falsely central measurement of the alignment. 12
Limitations
One point of criticism that may be made regarding our work is that S-I alignment is usually not assessed in the lying patient on CT scans but rather on the standing radiographs, according to known refence values regarding the acromiohumeral interval. 7 However, we propose that the CT scan with a resting arm, without the interference of gravity, will show an insufficiency of the rotator cuff more sensitively than a standing A-P radiograph. The supine position in CT may also lead to differences in the alignment in the A-P plane when compared with axillary view radiographs taken while standing. Nevertheless, as this is a CT-based classification, all images are taken with the patient lying down, making comparisons fair.
The frequency of high-grade erosion and eccentricity in our cohort may not be representative of patients who undergo joint replacement overall. This is likely to be because, as a university hospital department, we are referred many patients with severe disease. Furthermore, the lack of shoulders with an anteroinferior alignment in our sample does not preclude the existence of these, which may be present in other cohorts. Our study focused purely on patients with OA and CTA. The spectrum of alignment may also differ if the use of the classification is extended to other diagnoses (eg, to patients with arthritis of instability, rheumatoid arthritis, and posttraumatic arthritis).
While the ICC for the measurements showed a high grade of reproducibility, we do not expect clinicians to spend as much time as we did for this in the clinical setting. A validation study to confirm reproducibility of the classification within and between clinicians is required in the future. Three-dimensional reconstruction, however, is paramount, and therefore adequate software and practice, as well as time, will be needed to do this reliably, which may limit the use of this classification. Having said this, 3D planning software with automated reconstruction protocols is becoming more widely used, which will simplify the application of this classification. The clinical significance of this classification is yet to be determined. However, the present publication presents a method to analyze HSA and erosion in 3 dimensions using a 3D clinical image–viewing software, which gives clinical transferability to much of the knowledge gained by previous authors using complex modeling software.
Conclusion
This work has shown a high prevalence of biplanar eccentricity in DAS and has suggested cutoff values for the boundaries of centered HSA in both planes. We therefore suggest the use of a 3D classification, which applies the combined HSA as well as glenoid erosion to comprehensively describe DAS. The clinical significance of a classification like this has yet to be determined.
Footnotes
Final revision submitted March 8, 2022; accepted March 23, 2022.
The authors declared that they have no conflicts of interest in the authorship and publication of this contribution. AOSSM checks author disclosures against the Open Payments Database (OPD). AOSSM has not conducted an independent investigation on the OPD and disclaims any liability or responsibility relating thereto.
Ethical approval for this study was obtained from the Technical University of Munich.