
Abstract
Background:
The current clinical standard for the evaluation of cam deformity in femoroacetabular impingement syndrome is based on radiographic measurements, which limit the ability to quantify the complex 3-dimensional (3D) morphology of the proximal femur.
Purpose:
To compare magnetic resonance imaging (MRI)–based metrics for the quantification of cam resection as derived using a best-fit sphere alpha angle (BFS-AA) method and using 3D preoperative-postoperative surface model subtraction (PP-SMS).
Study Design:
Descriptive laboratory study.
Methods:
Seven cadaveric hemipelvises underwent 1.5-T MRI before and after arthroscopic femoral osteochondroplasty, and 3D bone models of the proximal femur were reconstructed from the MRI scans. The alpha angles were measured radially along clockfaces using a BFS-AA method from the literature and plotted as continuous curves for the pre- and postoperative models. The difference between the areas under the curve for the pre- and postoperative models was then introduced in the current study as the BFS-AA–based metric to quantify the cam resection. The cam resection was also quantified using a 3D PP-SMS method, previously described in the literature using the metrics of surface area (FSA), volume (FV), and height (maximum [FHmax] and mean [FHmean]). Bivariate correlation analyses were performed to compare the metrics quantifying the cam resection as derived from the BFS-AA and PP-SMS methods.
Results:
The mean ± standard deviation maximum pre- and postoperative alpha angle measurements were 59.73° ± 15.38° and 48.02° ± 13.14°, respectively. The mean for each metric quantifying the cam resection with the PP-SMS method was as follows: FSA, 540.9 ± 150.7 mm2; FV, 1019.2 ± 486.2 mm3; FHmax , 3.6 ± 1.0 mm; and FHmean, 1.8 ± 0.5 mm. Bivariate correlations between the BFS-AA–based and PP-SMS–based metrics were strong: FSA (r = 0.817, P = .012), FV (r = 0.888, P = .004), FHmax (r = 0.786, P = .018), and FHmean (r = 0.679, P = .047).
Conclusion:
Strong positive correlations were appreciated between the BFS-AA and PP-SMS methods quantifying the cam resection.
Clinical Relevance:
The utility of the BFS-AA technique is primarily during preoperative planning. The utility of the PP-SMS technique is in the postoperative setting when evaluating the adequacy of resection or in patients with persistent hip pain with suspected residual impingement. In combination, the techniques allow surgeons to develop a planned resection while providing a means to evaluate the depth of resection postoperatively.
Femoroacetabular impingement syndrome (FAIS) represents a structural abnormality of the hip at the articulation of the proximal femur and acetabulum, leading to altered contact forces at the joint level with resultant pain and injuries to the cartilage and labrum. 4,14,42,43 For patients with FAIS who have symptoms, hip arthroscopy has been shown to yield successful outcomes for the treatment of intrapathologies. 1,16 However, certain patients may report recurrent symptoms and pain after primary hip arthroscopy, necessitating revision hip arthroscopy and hip preservation procedures. 7,10,45,50 Revision hip arthroscopy occurs in 5% to 14% of patients after the index surgical procedure, with multiple investigations citing inadequate bony resection, primarily of cam lesions, as the most common indication for revision. 10,13,43,45 While patient-reported outcomes have demonstrated improvement after revision hip arthroscopy, outcomes are substantially lower when compared with those of patients undergoing primary hip arthroscopy. 13,48,50 Previous literature has noted the presence of high-grade chondral lesions in a majority of patients undergoing revision surgery secondary to inadequate bony resection at the index procedure, potentially accounting for the inferior outcomes in patients undergoing revision surgery. 23
While underresection and residual cam impingement represent inadequate treatment of cam impingement, overresection of cam lesions reportedly increases the risk for femoral neck fracture 8,39 and may disrupt the labral suction seal properties of the hip, potentially causing iatrogenic instability of the hip. 2,27 The presence of persistent impingement or overresection after primary hip arthroscopy has been speculated to occur as a result of limited pre- and intraoperative imaging, leading surgeons to underappreciate the degree of anterosuperior bony overgrowth. 21,38
While plain radiographs remain the clinical standard in screening for bony abnormalities in patients with FAIS, 5,20 radiographic measurements of cam deformity provide limited visualization of the complex 3-dimensional (3D) morphology of the hip joint. 37 Given the recognized limitations of 2-dimensional (2D) radiography, the incorporation of 3D methods to evaluate the hip joint has increased in popularity, improving characterization of deformity extent and location while aiding surgeons in determining appropriate cam resection. 37,47 In 2013, Kang et al 28 described the use of the best-fit sphere alpha angle (BFS-AA) method to characterize the size and location of cam deformity, demonstrating that 3D computed tomography (CT) could be used to define the boundaries of the cam deformity. Cong et al 12 evaluated the relationship of cam deformity between the best-fit sphere (BFS) method on 3D CT and reformatted oblique axial, oblique coronal, and radial views. The authors reported that the cam area displayed using the BFS method was greater than that evaluated on reformatted CT images, with the radial view demonstrating the greatest area among the sequences. Malloy et al 37 validated the use of magnetic resonance imaging (MRI) for evaluating the anatomy of the proximal femur in patients with cam-type FAIS, reporting that 1.5-T MRI produced femoral surface models that more accurately represented the actual bone surface than did CT with respect to the laser-scanned ground-truth models. More recently, Guidetti et al 22 incorporated postoperative imaging to quantify the amount of bone resected after osteochondroplasty via a 3D preoperative-postoperative surface model subtraction (PP-SMS) technique.
As the primary metric for evaluating the sphericity of the femoral head, alpha angle measurements have been established using multiple imaging modalities and views. 3,6,18,32,33 Given the complex 3D morphology associated with cam-type FAIS, multiple 2D views are necessary to accurately evaluate cam morphology in the assessment of patients with hip pain secondary to FAIS. 12,36,52 Increased accessibility of 1.5-T MRI scanners and advancements in imaging techniques have allowed for increased utility of MRI in the clinical setting, thereby eliminating the need for radiation exposure. Additionally, the ability to use MRI to assess soft tissue and bony anatomy has streamlined the preoperative workup by reducing the need for multiple diagnostic tests, with the added benefit of reducing cost. Advancements in commercial software allowing for the clinical application of 3D studies have opened the field for opportunities to generate new metrics to accurately quantify the 3D nature of bony deformities. However, the introduction of new metrics (ie, PP-SMS) requires comparison with the current standard (ie, the alpha angle). The purpose of the study was to compare MRI-based metrics for the quantification of cam resection as derived using a BFS-AA method and a 3D PP-SMS technique. We hypothesized that a strong association between BFS-AA and PP-SMS in quantifying the cam resection would be present.
Methods
Specimen Selection
Seven fresh-frozen cadaveric hemipelvises with attached femur and intact hip capsules were procured from ScienceCare for this study. The inclusion criteria were cadavers with an alpha angle >50° on the axial slice of an MRI scan. The exclusion criteria were hips with evidence of previous surgical intervention performed on the pelvis or proximal femur, evidence of osteoarthritis (Tönnis grade >1), or history of metastatic cancer with osseous involvement. The mean ± standard deviation donor age and body mass index were 51.0 ± 12.5 years and 19.3 ± 3.6, respectively. All specimens were stored in a laboratory freezer at –20°C until approximately 48 hours before use and then thawed to room temperature for testing and imaging. 15,44 Institutional review board approval was not required for this study.
Pre- and Postoperative MRI
Pre- and postoperative MRI scans were performed on all specimens on a 1.5-T Magnetom Espree system (Siemens) using a sequence previously described. 22,37 All MRI scans were exported as DICOM (Digital Imaging and Communication in Medicine) files and stored in an institutional picture archiving and communication system. All pre- and postoperative MRI scans were segmented using a semiautomatic segmentation process with commercially available software (Mimics version 21; Materialise). All segmentations were performed by a trained biomedical engineer (M.G.).
Hip Arthroscopy: Surgical Technique
Arthroscopic femoral osteochondroplasty was performed on all cadaveric specimens by a single fellowship-trained, high-volume hip arthroscopic surgeon (S.J.N.) in standard surgical fashion as previously described, 17,24 with a postoperative target alpha angle of 42°. 41
BFS-AA Method
The alpha angles were measured radially on the pre- and postoperative 3D femoral bone models based on the femoral clockface from 10 to 4 o’clock in 1-hour increments using 3-matic 3D modeling software (Materialise) (Figure 1). Use of 1-hour increments (ie, 30° intervals) were based on previous literature. 31 The software reads the commonly used .STL format (Standard Tessellation Language), which describes the surface geometry of a 3D object. The surface of the femoral head and neck was manually selected from the 3D model, making sure to exclude the fovea capitis region for the selection of the femoral head surface. The surface selected for the femoral head region was fitted to a spherical surface, with the center of the BFS identifying the center of the femoral head. The center of the femoral neck was identified as the center of gravity of the surface selected as the femoral neck region. The alpha angle was defined as the angle between 2 lines originating at the center of the femoral head. Line 1 was taken as the femoral neck axis, which extended from the center of the femoral head to the center of gravity of the femoral neck. Line 2 extended from the center of the femoral head to the point at which the bone surface exceeded the surface of the BFS by 0.5 mm. A threshold of 0.5 mm was used to account for the mean segmentation error. 37

Alpha angle measured in 1-hour increments from 10 to 4 o’clock in the (A) pre- and (B) postoperative 3-dimensional models. Dark green represents the surface of the best-fit sphere to the femoral head. Light gray indicates where the femoral surface deviates from the best-fit sphere. The heat map quantifies the deviation in millimeters for the region where it exceeds the 0.5-mm set threshold. The blue points represent the boundary where the deviation exceeds 0.5 mm; therefore, they delineate the cam boundary in panel A. The blue points moved to different positions in panel B as the cam was resected during surgery.
Quantifying the Cam via the BFS-AA Method
The pre- and postoperative alpha angle measurements based on the 3D model, obtained along the femoral clockfaces using the BFS-AA method, were plotted as continuous curves. The areas under the curve (AUCs) for the pre- and postoperative alpha angles (AUCpreop and AUCpostop, respectively) were determined (Figure 2, A and B). The plots were then superimposed (Figure 2C), and the difference (▵AUC = AUCpreop– AUCpostop) was used to quantify the cam resection during the arthroscopic surgery (Figure 2D).
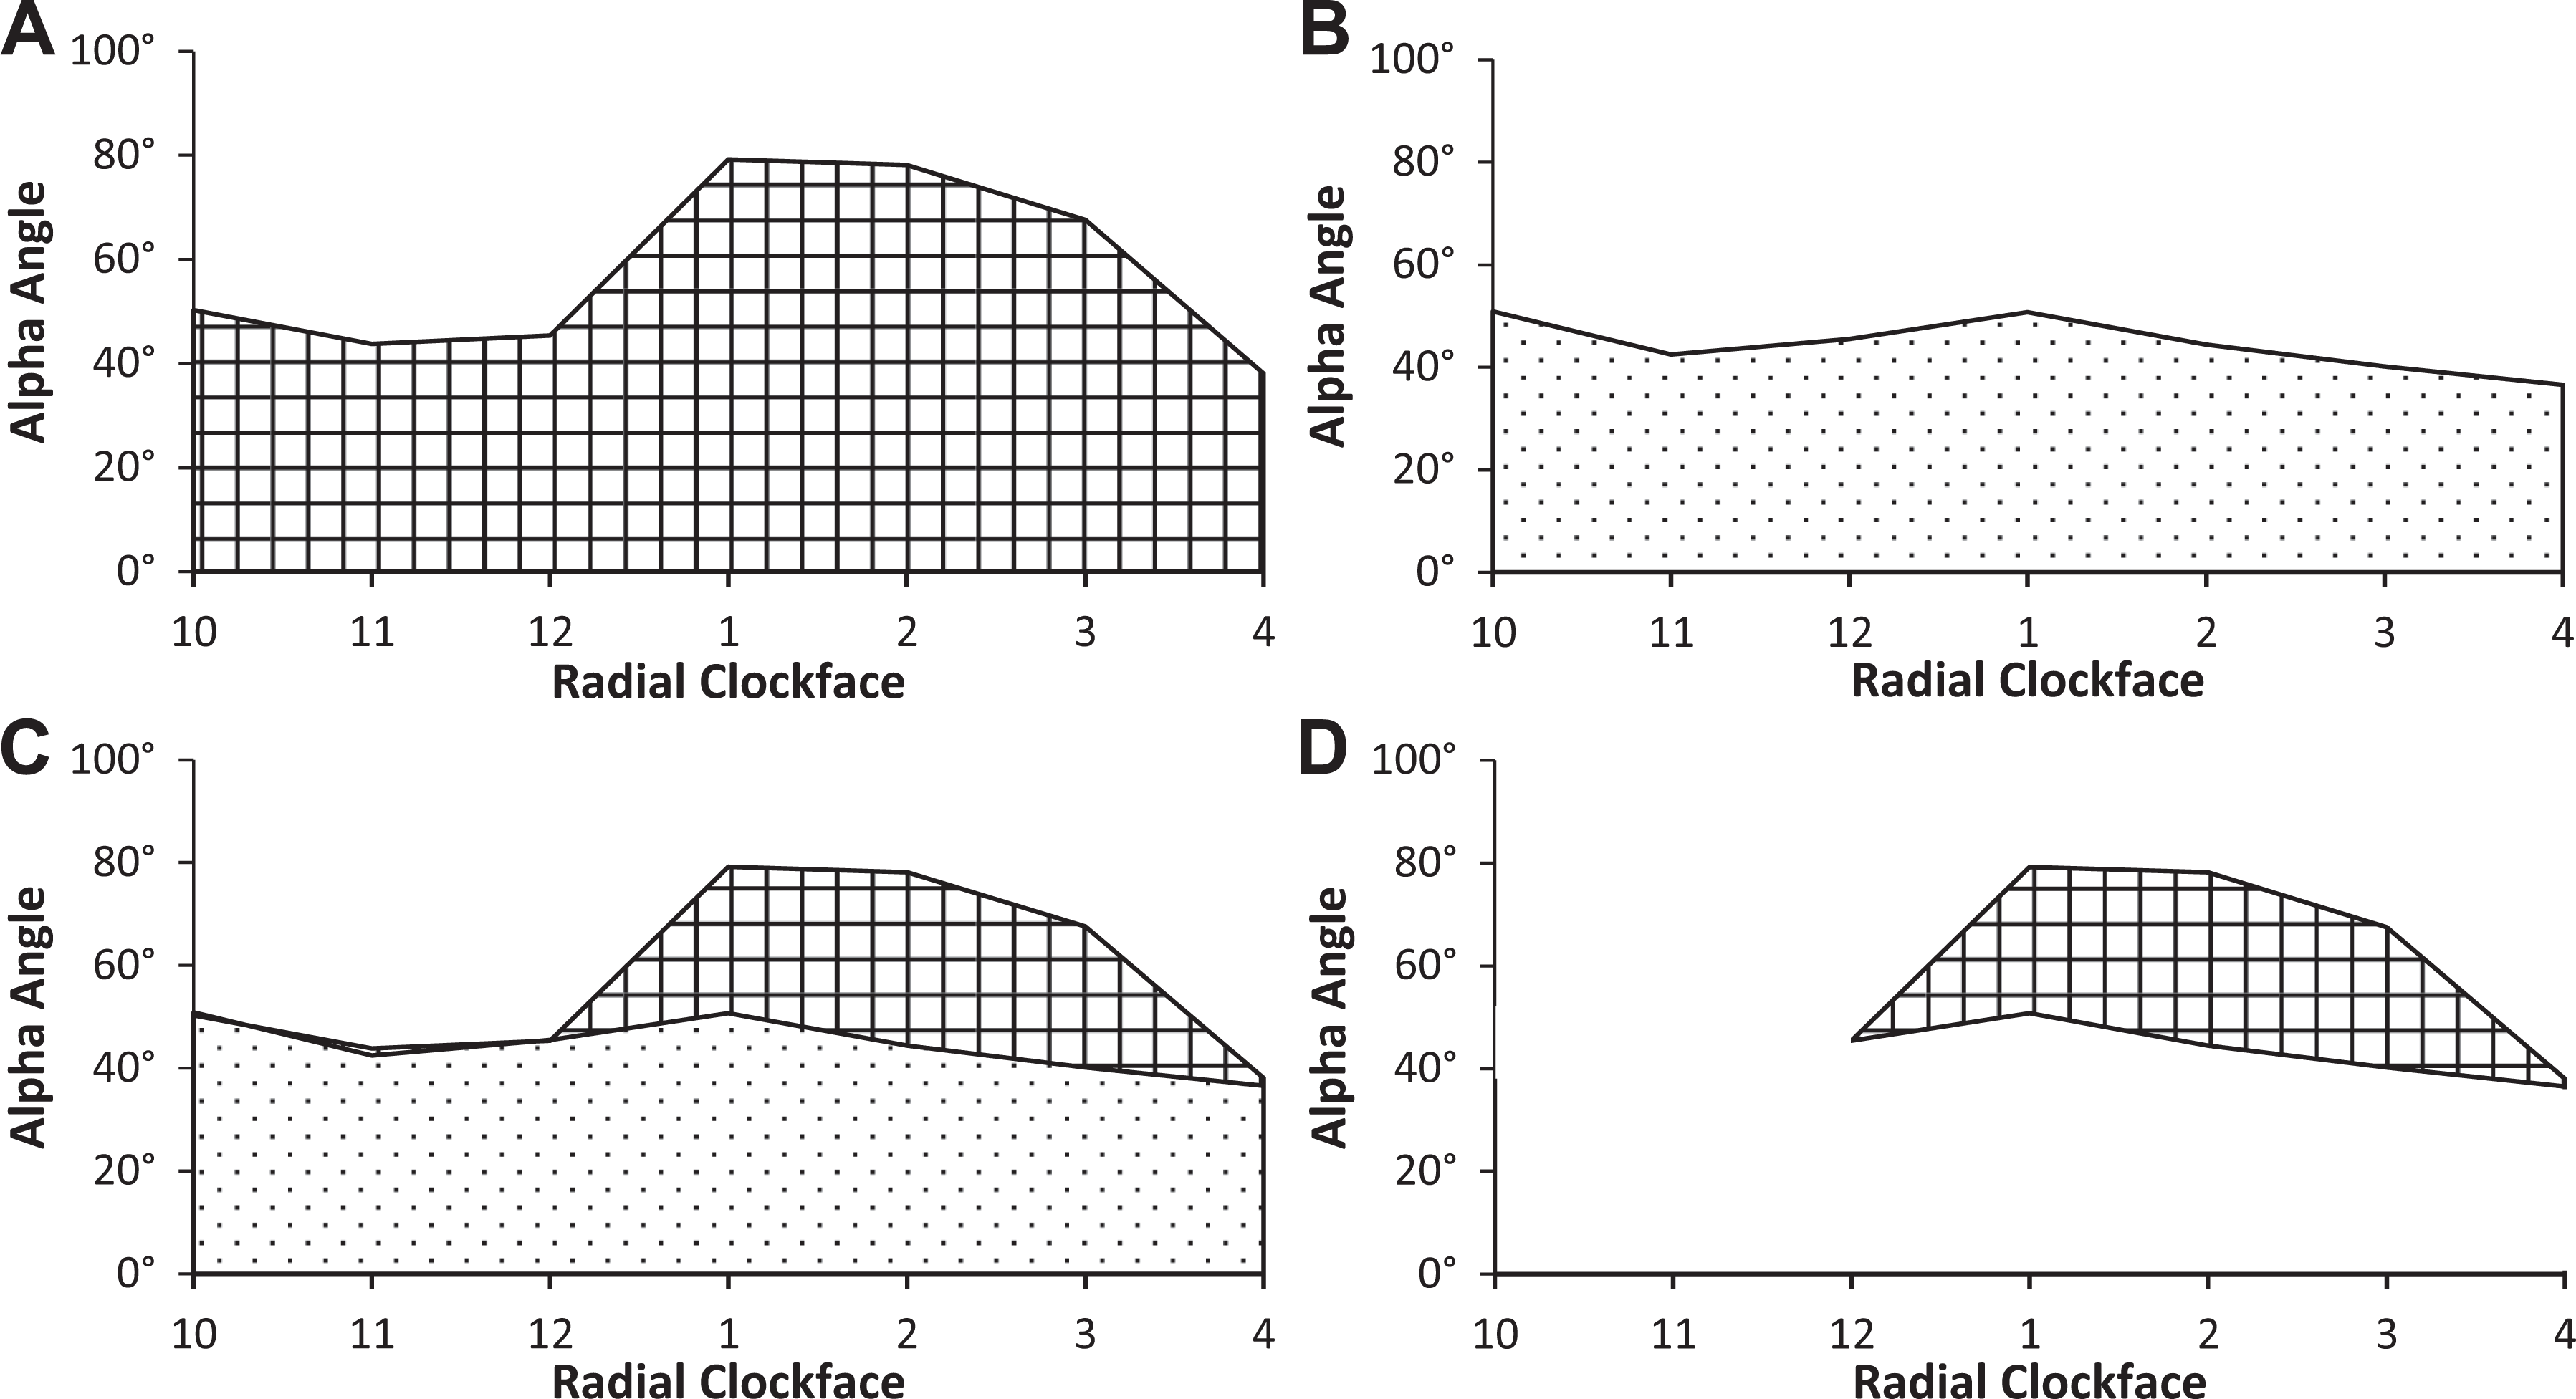
(A) Pre- and (B) postoperative alpha angle curve for the measurements performed on 3-dimensionally reconstructed hip bone models from 10 to 4 o’clock. The grid-like and dotted surfaces represent the areas under the curve for the pre- and postoperative alpha angles, respectively. (C) Superposition of the pre- and postoperative curve plots in panels A and B. (D) Difference between the areas under the pre- and postoperative curves quantifies the cam resection as the difference in bony morphology before and after surgery.
Quantifying the Cam via the 3D PP-SMS Technique
The postoperative 3D bone model was subtracted from the preoperative model to quantify the bone resected during hip arthroscopy as previously described. 22 The postoperative 3D bone model was subtracted from the preoperative model to quantify the bone resected during hip arthroscopy, with a threshold of greater than 0.5 mm (Figure 3) required to define the cam resection. The cam resection was quantified using the following metrics: maximum height (FHmax; mm), mean height (FHmean; mm), surface area (FSA; mm2), and volume (FV; mm3).
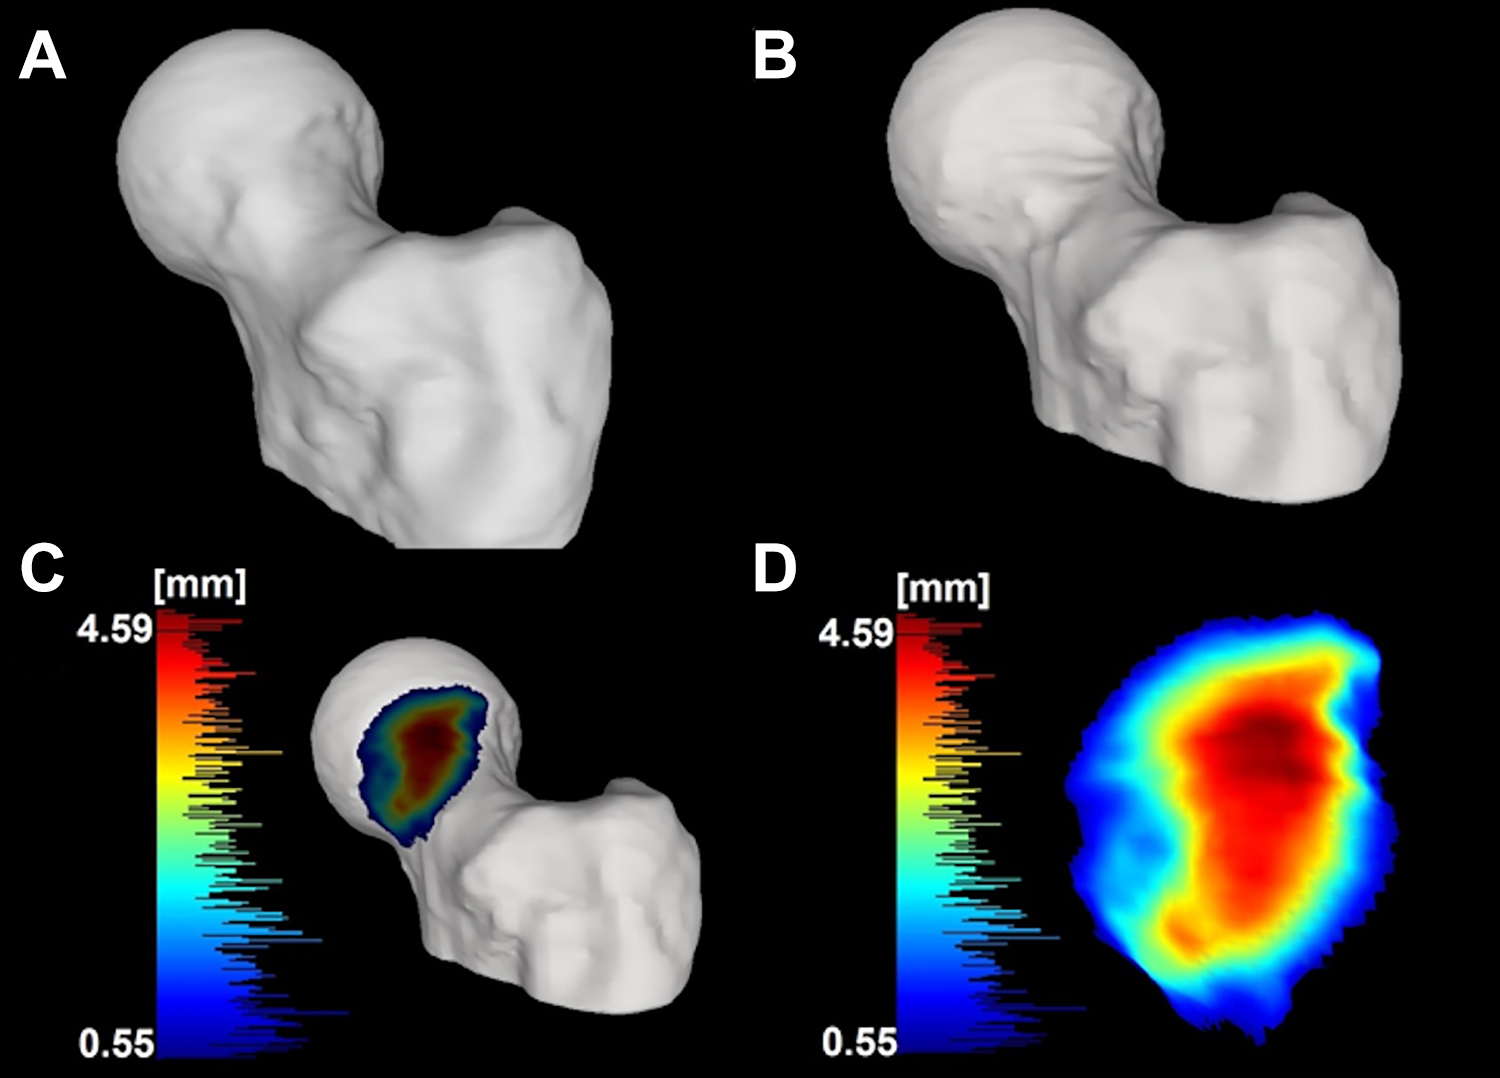
Example of the application of the preoperative-postoperative surface model subtraction technique. (A) Pre- and (B) postoperative models and (C) cam resection resulting from the subtraction of the latter from the former. A heat map of the height of the cam resection in millimeters is based on the surface-to-surface distance between the cam resection model and the postoperative bone model. The scale of the histogram has a lower threshold set at 0.5 mm (blue = minimal resection) with increasing depth (red = substantial resection). (D) Zoom-in of the cam resection with the same heat map scale in panel C.
Statistical Analysis
The primary dependent variables of interest were as follows: the metrics quantifying the cam resection (FHmax, FHmean, FSA, FV) and the difference in the AUCs between pre- and postoperative alpha angles (▵AUC). All data were inspected before analysis to determine if parametric statistical analysis assumptions were met. The Shapiro-Wilk test was used to determine normality, and box plots were used to identify outliers. In the event of violation of parametric assumptions, nonparametric statistical analyses were performed for the considered variables. A paired-samples t test was used to compare the pre- and postoperative alpha angles. Bivariate correlation analyses were performed to determine the relationship between the metrics quantifying the cam deformity based on the BFS-AA and PP-SMS methods. The strength of the bivariate correlations was defined as follows: weak, 0.1 to 0.3; moderate, 0.3 to 0.5; and strong, 0.5 to 1.00. 11 All statistical analyses were performed using SPSS (Version 26; IBM Corp). An a priori α level was set at .05 to indicate statistical significance.
Results
The mean pre- and postoperative alpha angles at each femoral clockface plane are displayed in Figure 4 as determined using the BFS-AA method. The mean maximum pre- and postoperative alpha angle measurements were 59.73° ± 15.38° and 48.02° ± 13.14°, respectively. There were significant reductions in alpha angle measurements at the 1-, 2-, and 3-o’clock femoral clockface planes after the arthroscopic femoral osteochondroplasty (P < .05) (Appendix Table A1). The mean for each PP-SMS–based metric quantifying the cam resection is displayed in Table 1.

Mean pre- and postoperative alpha angle measurements based on the best-fit sphere alpha angle method for the 7 cadaveric specimens. *P < .05.
Metrics Based on Preoperative-Postoperative Surface Model Subtraction a

a FHmax, maximum height; FHmean, mean height; FSA, surface area; FV, volume.
Correlations Between Alpha Angle and Femoral Osteochondroplasty Metrics
Strong positive correlations were identified between the BFS-AA–based metric (▵AUC) and all the PP-SMS–based metrics quantifying the cam resection (P < .05 for all) (Table 2). Scatterplots with a best-fit line were constructed between PP-SMS–based and BFS-AA–based metrics (Figure 5).
Bivariate Correlations Between BFS-AA–Based and PP-SMS–Based Metrics a

a Bold P values indicate statistical significance (P < .05). BFS-AA, best-fit sphere alpha angle; FHmax, maximum height; FHmean, mean height; FSA, surface area; FV, volume; PP-SMS, preoperative-postoperative surface model subtraction.

Scatterplots of significant correlations between metrics based on the best-fit sphere alpha angle method and preoperative-postoperative surface model subtraction technique. AUC, area under the curve; FHmax, maximum height; FHmean, mean height; FSA, surface area; FV, femoroplasty volume.
Discussion
The main findings from this in vitro cadaveric investigation were that the metrics quantifying cam resections based on MRI scans using the BFS-AA and PP-SMS methods were strongly correlated. The severity of cam morphology according to plain radiography is often determined using the magnitude of the alpha angle from a single radiographic 2D projection; however, this method often fails to reveal the extent of deformity, especially in cases when cam morphology extends distally along the neck. The BFS-AA method, which makes use of the radial alpha angles measured along the clockface, could be expanded for use in surgical planning by flattening the curve of the preoperative alpha angles to a target postoperative value. 41 The method provides a simplified way to quantify the full extent and location of the cam deformity that requires resection, emphasizing the necessity of evaluating all potential regions contributing to bony impingement along the femoral head and neck to minimize the rate of revision arthroscopy owing to inadequate surgical correction.
The frequency of insufficient or excessive cam resection is well established and often attributed to error in recognition or extent of decompression. 36 While sports medicine fellowships have improved training in hip arthroscopy, Gordon et al 19 reported a 64-fold difference in exposure among fellowship programs. Moreover, higher rates of revision surgery have been observed among surgeons performing a low volume of hip arthroscopy, 30,38 likely owing to the significant learning curve associated with hip arthroscopy. 9,29,49 Interactive computer vision interface (CVI) programs have recently been introduced, making use of multiple fluoroscopic views to ensure complete bony resection. Looney et al 36 evaluated the use of CVI-guided femoroplasty in 102 hips with FAIS (51 hips treated with CVI, 51 treated without it). Using plain radiography as the reference standard, the authors noted that CVI more reliably detected cam deformities at the 12:30 and 1:45 views when compared with the 11:45 view. In addition, the authors stated that the strength of the correlation between CVI views and clinic radiographs was moderate at best, suggesting that improvements in diagnostics may be obtained using advanced imaging modalities incorporating radial cuts. 46
In the present study, the 3D bone model–based metrics obtained using the PP-SMS technique demonstrated FHmax and FHmean of 3.6 ± 1.0 mm and 1.8 ± 0.5 mm, respectively, while the FSA resected was 540.9 ± 150.7 mm2. These results are comparable to the metrics of cam morphology obtained using alternative techniques. 12,25,28 Kang et al 28 used a BFS method to describe cam morphology in 5 patients and reported a mean deformity height ranging from 0.78 to 2.65 mm. In a series of 26 patients with cam deformity, Cong et al 12 used the BFS method to quantify cam surface area and cited a mean area of 329.75 ± 42.7 mm.2 Harris et al 25 used statistical shape modeling on CT-based 3D bone models between patients with FAIS and control participants to evaluate morphologic differences. They found that the mean cam protruded above the control mean by a maximum of 3.3 mm, with a sustained protrusion of 2.5 to 3.0 mm along the anterolateral head-neck junction. Despite providing valuable data on the 3D quantitation of cam morphology, the aforementioned techniques do not quantify the actual extent of cam resection.
More recently, Guidetti et al 22 compared pre- and postoperative surface models and provided new metrics (ie, FHmax, FHmean, FSA, FV) of quantifying bone resection during femoral osteochondroplasty. In the present study, the BFS method was used to quantify cam resection, with the ultimate goal of relating these metrics to those presented by Guidetti et al. The BFS-AA and PP-SMS metrics indicated strong positive correlations, with r values ranging from 0.679 to 0.888. A proportion of the variation of these results may be explained by the idealization of the femoral head as a perfect sphere. In a study by Harris et al, 26 the femoral head of 3D reconstructed bone models (n = 15 cam, n = 15 controls) was fit to ideal geometries consisting of rotational conchoids and spheres. According to the authors, conchoids provided a significantly better fit to native femoral head geometry than did spheres for both groups, and femurs with cam deformities demonstrated greater maximum deviations as compared with controls for sphere and conchoids.
The utility of the BFS-AA technique is primarily in preoperative planning. This method provides not only an improved understanding of the extent and magnitude of the patient’s cam lesion based on the alpha angle measurements but also the depth of resection required to restore the abnormal bony morphology. This technique may prove advantageous given the known sex differences in femoral head size, with male patients having larger femoral heads, and therefore may require a greater depth of resection per degree change in alpha angle measurements when compared with female patients. 54,56 The utility of the PP-SMS technique is in the postoperative setting when evaluating the adequacy of resection or in patients with residual hip pain. For patients with persistent pain and suspected residual impingement, postoperative MRI can be conducted to evaluate the actual depth of resection performed during surgery. This may help differentiate bony versus soft tissue causes of pain. Additionally, modifications to the preoperative bone model using techniques such as shape fitting have potential to generate a target postoperative bone model to allow the PP-SMS to also be used for preoperative planning. Future studies may focus on developing these techniques to be used in the clinic and to evaluate the relationship between 3D parameters and clinical outcomes.
Limitations
This study was not without limitations. Standard anteroposterior and Dunn lateral radiographs of the hip specimens were not obtained before osteochondroplasty, limiting comparison of clinical alpha angle measurements on radiographs with measurements obtained from MRI scans. While radiography is part of the standard workup in the patient with FAIS who has symptoms, MRI allows for assessment of cam resection, which is not capable of being measured on 2D radiographs. The sample size in this in vitro study was relatively small (n = 7), increasing the potential for type II statistical error attributed to being underpowered. However, the sample size in the current study is consistent with that of similar in vitro cadaveric investigations. 34,35,40,51,55 Additionally, the parametric tests in this study have been shown to be applicable with studies consisting of sample sizes ≤5. 53 Current technology requires pre- and postoperative MRI models, limiting the clinical utility as postoperative MRI is not standard of care. Although currently beyond our current technologic capabilities, advancements in shape-fitting techniques may allow for clinically applicable preoperative planning, facilitating identification of high-risk regions for impingement. Additionally, advancements in imaging techniques and automatization of bone model segmentation could ultimately allow this technique to be used in the operative setting after osteochondroplasty to confirm complete resection of abnormal bony morphology.
Conclusion
Strong positive correlations were appreciated between the BFS-AA and PP-SMS methods quantifying the cam resection. The utility of the BFS-AA technique is primarily during preoperative planning. The utility of the PP-SMS technique is in the postoperative setting when evaluating the adequacy of resection or in patients with persistent hip pain with suspected residual impingement. In combination, the techniques allow surgeons to develop a planned resection while providing a means to evaluate the depth of resection postoperatively.
Footnotes
Final revision submitted February 17, 2022; accepted February 25, 2022.
One or more of the authors has declared the following potential conflict of interest or source of funding: D.M.K. has received research support from Arthrex and education payments from Medwest and Smith & Nephew. J.C. has received education payments from Arthrex and Smith & Nephew; consulting fees from Arthrex, DePuy, Linvatec, and Smith & Nephew; speaking fees from Linvatec; and hospitality payments from Stryker. S.J.N. has received education payments from Elite Orthopedics and consulting fees and royalties from Stryker. AOSSM checks author disclosures against the Open Payments Database (OPD). AOSSM has not conducted an independent investigation on the OPD and disclaims any liability or responsibility relating thereto.
Ethical approval was not sought for the present study.
APPENDIX
Mean Pre- and Postoperative Alpha Angle a

| Alpha Angle, deg | |||
|---|---|---|---|
| Location, Clockface | Preoperative | Postoperative | P |
| 10 o’clock | 49.0 ± 7.6 | 48.0 ± 6.4 | .155 |
| 11 o’clock | 42.5 ± 2.7 | 43.7 ± 4.0 | .113 |
| 12 o’clock | 46.1 ± 12.0 | 42.4 ± 2.8 | .433 |
| 1 o’clock | 55.3 ± 15.4 | 44.3 ± 6.0 |
|
| 2 o’clock | 59.6 ± 12.0 | 41.9 ± 7.4 |
|
| 3 o’clock | 59.7 ± 7.7 | 45.1 ± 13.1 |
|
| 4 o’clock | 45.2 ± 4.2 | 43.5 ± 10.6 | .373 |
a Data are presented as mean ± SD. Bold P values indicate statistically significant difference between pre- and postoperative (P < .05, paired t test).