
Abstract
Background:
Comparative studies and randomized controlled trials (RCTs) often use the P (probability) value to convey the statistical significance of their findings. P values are an imperfect measure, however, and are vulnerable to a small number of outcome reversals to alter statistical significance. The inclusion of a fragility index (FI) and fragility quotient (FQ) may aid in the interpretation of a study’s statistical strength.
Purpose/Hypothesis:
The purpose of this study was to examine the statistical stability of studies comparing single-row to double-row rotator cuff repair. It was hypothesized that the findings of these studies would be vulnerable to a small number of outcome event reversals, often fewer than the number of patients lost to follow-up.
Study Design:
Systematic review; Level of evidence, 3.
Methods:
We analyzed comparative studies and RCTs on primary single-row versus double-row rotator cuff repair that were published between 2000 and 2021 in 10 leading orthopaedic journals. Statistical significance was defined as a P < .05. The FI for each outcome was determined by the number of event reversals necessary to alter significance. The FQ was calculated by dividing the FI by the respective sample size.
Results:
Of 4896 studies screened, 22 comparative studies, 10 of which were RCTs, were ultimately included for analysis. A total of 74 outcomes were examined. Overall, the median FI was 2 (interquartile range [IQR], 1-3), and the median FQ was 0.035 (IQR, 0.020-0.057). The mean FI was 2.55 ± 1.29, and the mean FQ was 0.043 ± 0.027. In 64% of outcomes, the FI was less than the number of patients lost to follow-up.) Additionally, 81% of significant outcomes needed just a single outcome reversal to lose their significance.
Conclusion:
Over half of the studies currently used to guide clinical practice have a number of patients lost to follow-up greater than their FI. The results of these studies should be interpreted within the context of these limitations. Future analyses may benefit from the inclusion of the FI and the FQ in their statistical analyses.
As the number of patients who undergo arthroscopic rotator cuff repair continues to rise, clinical research has focused on delineating the best possible technique for repair. Many anatomic and biomechanical factors are considered when comparing different techniques, including restoration of the anatomic footprint, 2 biomechanical strength of the construct, 30 and minimized motion at the bone-tendon interface. 18 Currently, the most frequently used techniques are the single-row (SR) and double-row (DR) repairs. 9 However, the designations “single row” and “double row” are inherently broad and encompass techniques such as the modified Mason-Allen (MMA) stitch, triple-loaded anchor repair (TLAR), and classic SR techniques for SR repairs, and the transosseous equivalent (TOE) and classic DR techniques for DR repairs. 30
Despite the wide range of techniques described in the literature, no consensus currently exists as to what should be the standard repair technique, and comparative studies between SR and DR constructs are ongoing. 9 Recently, the literature has suggested that DR repair may offer a more biomechanically sound construct, but it is more costly and time demanding than is SR repair. 2,9 The surgeon’s choice between SR and DR repair is guided primarily by evidence-based medicine, with an emphasis placed on these comparative studies and randomized controlled trials (RCTs). However, the statistical stability of these studies is subject to question and may be more fragile than previously thought.
The significance of the conclusions reached in comparative studies and RCTs is often portrayed using statistical thresholds such as the P (probability) value. The P value is a useful tool for distilling the results of a trial down to either significant or nonsignificant; however, it is limited and fails to consider important aspects of a trial, such as sample size and number of events taking place. 46 Statistical significance, as defined by the P value, can be altered by a small number of event reversals. Furthermore, if the number of event reversals needed to change the significance of the result is smaller than the number of patients lost to follow-up, this biases the study. 46 To account for the shortcomings of the P value and aid in the statistical interpretation of a study, Feinstein 11 introduced the concept of the fragility index (FI). The FI is defined as the number of event reversals needed to change the findings of a study from significant to nonsignificant and vice versa. This value adds to the strength of the study; however, it does not consider the study population size. To control for this, Ahmed et al 1 proposed the fragility quotient (FQ), which is calculated by dividing the FI by the total sample size to arrive at a value of relative fragility for the study. A larger FQ indicates a more stable P value, as an FI of 5 in a study population of 50 (FQ, 0.100) is substantially more stable than an FI of 5 in a study population of 5000 (FQ, 0.001). The inclusion of both the FI and the FQ allows for the reporting of absolute (FI) and relative (FQ) fragility of a study and would therefore contribute greatly to the interpretation of comparative studies; however, they are not often reported.
The purpose of this study was to determine the statistical stability of comparative studies and RCTs evaluating SR versus DR repair for rotator cuff tears by calculating the FI and FQ of the included studies. The secondary objective was to perform a subgroup analysis to determine the proportion of studies for which the fragility was smaller than the number of patients lost to follow-up. We hypothesized that the number of event outcome reversals needed to alter the significance of the study would be fewer than the number of patients lost to follow-up for a majority of the studies included in the analysis.
Methods
Comparative studies and RCTs focusing on the utilization of the SR and DR techniques for rotator cuff tears published in select journals between 2000 and 2021 were identified and collected. Ten journals were selected for their prominence within the field of orthopaedic surgery and shoulder and elbow surgery. According to the 2020 InCites Journal Citation Reports index (https://www.researchgate.net/publication/347504391_InCites_Journal_Citation_Reports_2020_with_Impact_Factors_and_Quartiles_included), these journals are recognized as the most influential in the field of orthopaedic and shoulder and elbow surgery. The 10 orthopaedic journals included and their impact factors were the British Journal of Sports Medicine (12.022), American Journal of Sports Medicine (5.810), Journal of Bone and Joint Surgery–American (4.578), Clinical Orthopaedics and Related Research (4.329), Arthroscopy (4.325), Bone & Joint Journal (4.306), Acta Orthopaedica (2.965), International Orthopaedics (2.854), Journal of Shoulder and Elbow Surgery (2.817), and Journal of Orthopaedic Research (2.728).
Studies from these journals were queried for relevance, screened, and ultimately included or excluded based on criteria symmetric with the current surgical trends for rotator cuff repair. The initial PubMed search criteria included all studies on the rotator cuff, SR repair, and DR repair. This search was then limited to include only comparative studies and RCTs. The titles and abstracts of these comparative studies and RCTs were then screened for the utilization of the SR versus DR technique. Each article was then examined, and studies were included if (1) SR or DR repair for rotator cuff tear was implemented; (2) the patients underwent primary rotator cuff repair for small, medium, or large/massive tears; and (3) the study reported a 12-month minimum follow-up period. The studies were excluded if (1) the surgical technique was not explicitly described or referenced; (2) the study focused on something other than clinical outcomes (cost, operative time, blood flow, etc); (3) the patients underwent revision rotator cuff repair; (4) the study included patients undergoing a procedure other than SR or DR repair; (5) the studies were cadaveric, in vitro, or animal studies; (6) the study used population databases, national registries, or cross-sectional data; or (7) no dichotomous outcomes were reported anywhere in the study. From the studies meeting these criteria, all categorical outcomes were included (Figure 1). Nondichotomous data points were not included, as these are unable to be analyzed using current fragility methodology.
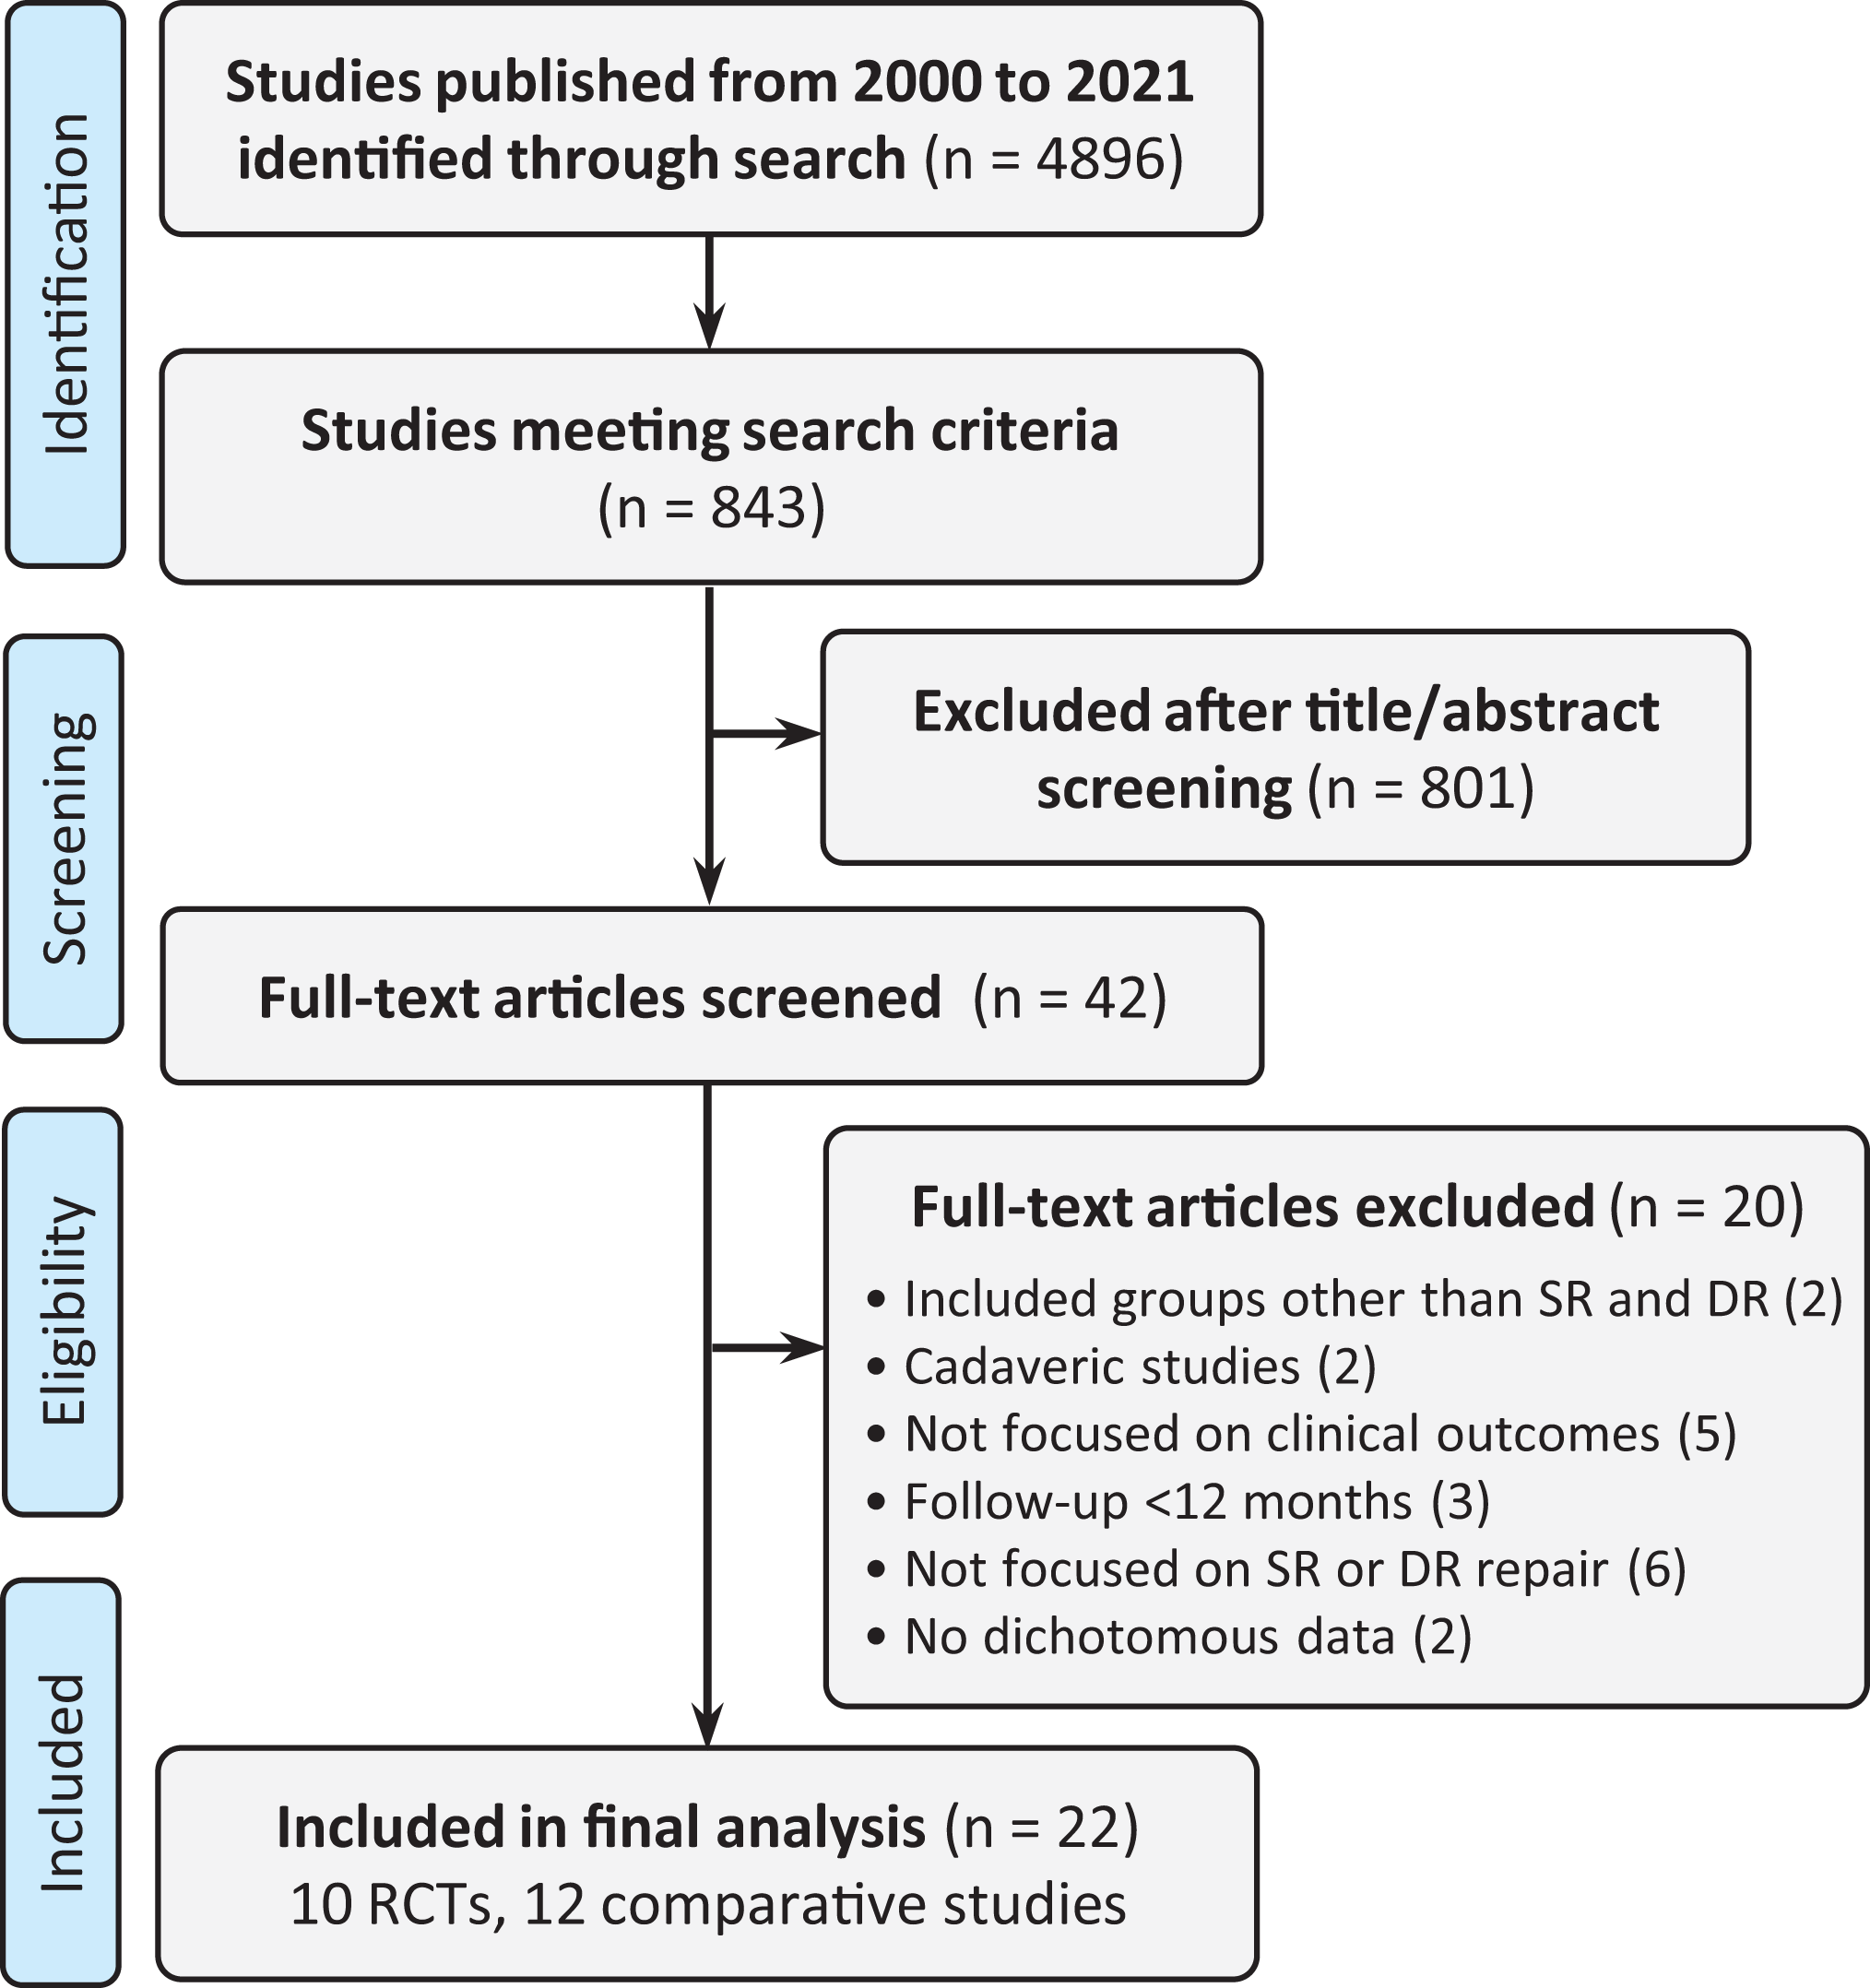
Study inclusion flowchart. DR, double row; RCT, randomized controlled trial; SR, single row.
We extracted data involved in the dichotomous outcomes of each study, which included the number of patients in each outcome group, the outcome being measured, the total population size, and the number of patients lost to follow-up. The reported P value associated with each dichotomous outcome measure was recorded and verified for accuracy using a Fisher exact test. Statistical significance was set at P < .05.
Using a contingency table, we manipulated the results of the outcomes until the significance was reversed. For example, if the P value of a certain outcome was reported as <.05 by a study, the number of outcome reversals needed to increase the P value to >.05 was determined and vice versa (Figure 2). FI was recorded as the number of outcome reversals needed to change the significance of the study. FQ was determined by dividing the FI by the respective sample size, and interquartile ranges (IQRs) were calculated. Studies in which FI was less than the number of patients lost to follow-up were identified.

Hypothetical demonstration using an outcome with a fragility index of 1 of a single outcome event reversal resulting in altered statistical significance. The left panel shows the original data (in number of patients), and the right panel shows the modified data with a single outcome reversal.
Four subgroups were analyzed for significant differences via independent t tests at 95% confidence: (1) significant (P < .05) versus nonsignificant (P > .05) outcomes, (2) outcomes for which the FI was fewer than the number of patients lost to follow-up versus outcomes for which the FI was greater than the number of patients lost to follow-up, (3) outcomes between traditional DR repair and its variants (eg, TOE), and (4) outcomes between traditional SR repair and its variants (eg, MMA, TLAR). All data analysis was performed using Microsoft Excel (Version 16.37; Microsoft Corp).
Results
Of the 4896 studies identified, 843 comparative studies were screened. Ultimately, 22 studies, including 10 RCTs, were included for the analysis. The characteristics of the included studies can be found in Table 1. Overall, the median FI was 2 (IQR 1-3) and the median FQ was 0.035 (IQR 0.020-0.057). The overall mean FI was 2.55 ± 1.29 and the mean FQ was 0.043 ± 0.027.
Characteristics of the Included Studies a

aAJSM, American Journal of Sports Medicine; FI, fragility index; FQ, fragility quotient; JBJS, Journal of Bone and Joint Surgery–American; JSES, Journal of Shoulder and Elbow Surgery; Int Orthop, International Orthopaedics; RCT, randomized controlled trial.
We performed a subgroup analysis in which we examined groups reporting statistically significant outcomes (P < .05), outcomes in which number of patients lost to follow-up was less than the FI, outcomes from variants of classic SR repair, and outcomes from variants of classic DR repair (Table 2).
Fragility of Analyzed Subgroups a

a FI, fragility index; FQ, fragility quotient; LTF, lost to follow-up; MMA, modified Mason-Allen; TLAR, triple-loaded anchor repair; TOE, transosseus equivalent.
Significant (n = 16) and nonsignificant (n = 58) outcomes were analyzed across multiple parameters. The median FIs were 1 (IQR, 1-1) and 3 (IQR, 2-4) for significant and nonsignificant outcomes, respectively. The median FQs were 0.02 (IQR, 0.015-0.029) and 0.05 (IQR, 0.030-0.061), respectively. The mean FIs were 1.25 ± 0.58 and 2.96 ± 1.20, and the mean FQs were 0.023 ± 0.015 and 0.049 ± 0.027, respectively. A significant difference was found between these 2 groups for both FI (P < .001; 95% CI, 1.09-2.32) and FQ (P < .001; 95% CI, 0.019-0.033). A majority of the significant outcomes, 13/16 (81%), needed a single outcome reversal to become statistically nonsignificant.
When comparing the fragility index to the number of patients lost to follow up for a given outcome, the median FIs were 3 (IQR, 2-4) and 1.5 (IQR, 1-4) for FI < LTF and FI > LTF, respectively. The median FQs were 0.054 (IQR, 0.027-0.061) and 0.024 (IQR, 0.009-0.050), respectively. The mean FIs were 2.74 ± 1.15 and 2.22 ± 1.48, and the mean FQs were 0.049 ± 0.027 and 0.033 ± 0.025, respectively. A significant difference was found between these 2 groups for both FI (P = .047; 95% CI, 0.090-1.131) and FQ (P = .008; 95% CI, 0.003-0.028).
For outcomes in studies examining classic DR repair (n = 38) versus a variant version of DR repair (TOE) (n = 36), the median FIs were 2 (IQR, 1-3) and 3 (IQR, 1-4), respectively. The median FQs were 0.036 (IQR, 0.020-0.058) and 0.036 (IQR, 0.021-0.054), respectively. The mean FIs were 2.42 ± 1.18 and 2.69 ± 1.41, and the mean FQs were 0.040 ± 0.023 and 0.046 ± 0.031, respectively. No significant difference was found between these 2 groups for both FI (P = .184; 95% CI,–0.331 to 0.871) and FQ (P = .207, 95% CI, –0.007 to 0.017).
For outcomes in studies examining classic SR repair (n = 59) versus a variant version of SR repair (MMA, TLAR) (n = 15), the median FIs were 2 (IQR, 1-3) and 3 (IQR, 2-4), respectively. The median FQs were 0.033 (IQR, 0.016-0.056) and 0.052 (IQR, 0.034-0.075), respectively. The mean FIs were 2.39 ± 1.31 and 3.20 ± 1.01, and the mean FQs were 0.037 ± 0.022 and 0.062 ± 0.035, respectively. A significant difference was found between these 2 groups for both FI (P = .015; 95% CI, 0.085-1.535) and FQ (P < .001; 95% CI, 0.009-0.039).
Finally, for outcomes reported as retear (n = 21) versus outcomes not reported as retear (n = 53), the median FIs were 2 (IQR, 1-2.5) and 3 (IQR, 2-4), respectively. The median FQs were 0.026 (IQR, 0.018-0.054) and 0.044 (IQR, 0.027-0.061), respectively. The mean FIs were 1.95 ± 1.11 and 2.79 ± 1.29, and the mean FQs were 0.035 ± 0.024 and 0.046 ± 0.028, respectively. A significant difference was found between these 2 groups for FI (P = .005; 95% CI, 0.200 to 1.480) but not for FQ (P = .067; 95% CI, –0.004 to 0.024).
Discussion
For this review, the median FI was found to be 2, and the median FQ was 0.035, which is consistent with previous orthopaedic literature reporting an average median FI of 3.67 ¶ and FQ of 0.036. 9,19,27,35 –37,45 This study’s findings demonstrated that statistical significance can be changed with <3 outcome reversals, or reversal of 3.4% of outcome events. Furthermore, 13 of the 16 significant outcomes (81%) reported needed just a single outcome reversal to become statistically nonsignificant. Our hypothesis was confirmed in that more than half (63%) of the outcomes analyzed had an FI that was smaller than the number of patients lost to follow-up. This study adds to the growing body of evidence in support of the inclusion of FI and FQ into the RCTs and comparative studies that guide clinical decision making.
While P values are helpful in distilling complex statistical information down to a single value, there is growing concern in the medical community that these values may be oversimplifications and that continuing to use P values on their own may be detrimental to our understanding of the clinical significance of a study. 7,46 P values help to explain the probability of obtaining an outcome similar to or more extreme than the one observed if the null hypothesis is true, 4 which may be a good starting point for assessing the strength of a given study. However, they do not account for factors such as size of the study and number of events observed, which are critical to the overall assessment of the strength of a study. 46 The results of a study may be considered significant but only need 1 or 2 outcome reversals to change their significance, which is frequently smaller than the number of patients lost to follow-up. 37,46 Despite these concerns, the reporting of P values continues to increase in the literature by approximately 8.2% annually, with 79% of clinical trials reporting P values in 2015. 7
Inclusion of an FI can add clarity to these studies by ascribing a numerical value to the number of outcome reversals needed to alter the significance of a given study, although it is currently underused in the literature. 9,36 Recent studies have shown that research in orthopaedic sports medicine could benefit from the inclusion of the FI, with studies published in top orthopaedic journals needing an average of 5 outcome reversals, or 5.4% of the study population, to reverse significance. 38 The current study demonstrated similar fragility of orthopaedic literature, with 2.55 outcome reversals, or 3.4% of the study population, needed to reverse significance. With most power analyses accepting <20% loss to follow-up, this level of fragility highlights a risk of bias present within the current orthopaedic literature. 46
While the FI is a useful tool in assessing the overall significance of a study, it fails to consider the size of the population being studied. Ahmed et al 1 saw this weakness in FI and sought to address it by dividing the FI of a study by the total number of patients included in the study, creating the FQ. Svantesson et al demonstrated the importance of the FQ by examining a population database study 44 that reported a median FI of 116, which is far above the average median FI in orthopaedic literature (3.67). However, this study had a very large patient population compared with the average orthopaedic study, with 5540 patients. By dividing the FI by the 5540 patients included in this population database study, Ehlers et al 9 found an FQ of 0.021, which is more consistent with the average FQ reported in orthopaedic literature (0.036) and in this study (0.043). This example highlights how FI can be misinterpreted when used on its own. The inclusion of FQ in concert with FI is warranted for a more holistic interpretation of the results of a study.
The focus of this study was on the clinical outcomes of SR versus DR repair for rotator cuff tears. A systematic review of meta analyses comparing SR repair with DR repair found that a majority of RCTs in the literature demonstrated very few differences in clinical outcomes between the 2 groups; however, DR repair had a lower rate of retear, particularly in patients with a tear >3 cm in size. 32 However, a more recent systematic review found that the labels “single row” and “double row” may be an oversimplification and that new, more biomechanically stable techniques which have yet to be adequately compared exist for both groups. 30 Despite the large number of studies that have been conducted comparing the 2, a consensus has yet to be reached, and further study is needed. Furthermore, no comparative studies to date have included fragility in their statistical analysis. As demonstrated in this analysis, retear rates had a significantly smaller FI than all other dichotomous outcomes observed, needing a single outcome reversal to change the significance of this important outcome. Future studies could benefit from the inclusion of FI and FQ particularly, for primary outcomes such as retear rates, to demonstrate the stability of their findings relative to the current orthopaedic literature.
Strengths and Limitations
There are several strengths to this study. The mean impact factor of the journals examined for this study was 4.67, which is higher than those of recent fragility analyses examining sports medicine (4.28), 38 spine (2.4), 10 and trauma (3.31). 36 The focus on the highest-impact orthopaedic journals limits risk of bias of the studies included in this analysis compared with studies published in journals with lower impact factors. Furthermore, this study included both primary and secondary outcome measures, making the application of FI and FQ in this study more generalizable. While an analysis of a commonly reported dichotomous primary measure, such as rate of retear, may prove valuable, the inclusion of secondary outcome measures allows this technique to be applied more broadly.
This study is not without limitations. Primarily, FI and FQ are only able to be calculated using dichotomous data and cannot be applied to continuous variables such as pain scores and outcome measurements, which make up a majority of the primary outcomes of the studies included in this analysis. Because only dichotomous data could be analyzed, 2 studies that otherwise met inclusion criteria for this review had to be excluded. Additionally, while we consider the inclusion of only the top 10 highest-impact journals in orthopaedic shoulder and elbow surgery to be a strength, there is indeed potential for other influential studies on SR versus DR rotator cuff repair to exist outside of these journals, and this limitation could be considered a relative weakness.
Conclusion
The significance of studies examining SR versus DR repair for rotator cuff tears is fragile and subject to change from even a small number of outcome reversals. The average number of outcome reversals needed to reverse the significance was 2.55. The number of outcome reversals needed was smaller than the number of patients lost to follow-up for 63% of studies. Furthermore, 13 of the 16 outcomes reported as “significant” required just a single outcome reversal needed to alter their significance. Future studies may benefit from the inclusion of an FI and/or FQ in their statistical analyses.
Footnotes
Final revision submitted January 6, 2022; accepted February 17, 2022.
One or more of the authors has declared the following potential conflict of interest or source of funding: R.L.P. has received grant support and education payments from Arthrex. D.W. has received education payments from Arthrex and Smith & Nephew; consulting fees from Newclip, Ipsen Biosciences, DePuy/Medical Device Business Services, and Vericel; and hospitality payments from Linvatec and Stryker. AOSSM checks author disclosures against the Open Payments Database (OPD). AOSSM has not conducted an independent investigation on the OPD and disclaims any liability or responsibility relating thereto.