
Abstract
Background:
The patient acceptable symptom state (PASS) has emerged as a metric for evaluating patient satisfaction after treatment. There is little research on the relationship between sports activity and PASS values after arthroscopic rotator cuff repair (ARCR).
Purpose:
To (1) introduce the sports activity available state (SAAS) as an indicator of whether sports activities are possible based on patient symptoms after ARCR, (2) investigate the correlation between the SAAS and PASS, (3) predict the SAAS using derived PASS values, and (4) identify factors for achieving the PASS and SAAS.
Study Design:
Case-control study; Level of evidence, 3.
Methods:
Included were 201 patients who underwent ARCR between January 2015 and December 2016. At a mean follow-up of 38.7 ± 7.0 months, anchor questions were used to classify patients as SAAS+ (sports group) or SAAS– (nonsports group) and derive the PASS values for the pain visual analog scale (pVAS), American Shoulder and Elbow Surgeons (ASES), and Single Assessment Numeric Evaluation (SANE). The authors analyzed the correlation and difference between PASS and SAAS acquisition, and univariate and multivariate logistic regression analyses were performed to determine factors for PASS and SAAS achievement.
Results:
The final PASS values for the pVAS, ASES, and SANE were 0.5, 93.5, and 82.5, respectively. A significant correlation existed between PASS and SAAS acquisition (phi correlation coefficient, 0.647; P < .001). Sensitivity and specificity were >0.7 for all outcome scores when predicting SAAS using PASS values. A higher preoperative ASES score was significantly associated with achieving both the SAAS (OR, 1.032 [95% CI, 1.005-1.059]; P = .018) and PASS (OR, 2.556 [95% CI, 1.753-3.726]; P < .001). Diabetes (OR, 0.348 [95% CI, 0.130-0.931], P = .036) and a large to massive tear (OR, 0.378 [95% CI, 0.162-0.884]; P = .025) were significantly negatively associated with achieving the SAAS.
Conclusion:
The authors found the SAAS to be significantly correlated with the PASS. Also, SAAS was able to be predicted using the PASS value. Patients with higher preoperative ASES scores had higher odds of achieving both the PASS and SAAS, and patients with diabetes and those with large to massive tears had lower odds of achieving the SAAS.
Keywords
The patient acceptable symptom state (PASS), which has emerged as a metric for evaluating patient satisfaction after treatment, refers to the level of pain and function at which patients consider themselves well. Studies are underway to determine the PASS values for various orthopaedic treatments and clinical scores. 8 Moreover, the importance of patient-based evaluation after orthopaedic surgery has increased. 29 Representative examples of patient-based outcomes are the pain visual analog scale (pVAS), Single Assessment Numeric Evaluation (SANE), 31 and American Shoulder and Elbow Surgeons (ASES) 22,24 scores.
Arthroscopic rotator cuff repair (ARCR) has become a treatment mainstay for patients with rotator cuff tears, 27 and several studies have obtained PASS values after ARCR. 11,17 The availability of sports activity has become an important concern after shoulder surgery because young adults and senior adults alike tend to participate actively in sports activities. 6,13,21,25 However, there is little research on the relationship between sports activity and score systems such as the PASS.
In this study, we introduce a new concept, the sports activity available state (SAAS), as an indicator of whether sports activities are possible based on the symptoms of the patient at follow-up. We aimed to investigate the correlation between the SAAS and PASS after ARCR, predict the SAAS using the PASS value, and identify factors for achieving PASS and SAAS. Our hypothesis was that acceptable PASS values (area under the curve [AUC], >0.7) could be derived for each outcome score used and that the SAAS would be significantly correlated with PASS.
Methods
Study Design
The protocol for this study received institutional review board approval, and the study was conducted in accordance with the 1964 Declaration of Helsinki and its later amendments or comparable ethical standards. We analyzed prospectively collected data from patients who underwent ARCR by a single senior surgeon (I.H.J.) at a tertiary referral hospital between January 2015 and December 2016. All patients who underwent ARCR had been enrolled in a rotator cuff surgery registry and were routinely evaluated at 2 weeks, 4 weeks, 3 months, 6 months, 1 year, and >2 years after surgery. A clinical nurse specialist (J.H.P) contacted the patients periodically to minimize loss to follow-up. The pVAS, ASES, and SANE scores were assessed at 6 months, 1 year, and final follow-up, and the integrity of the repaired cuff was evaluated by magnetic resonance imaging (MRI) at the 1-year follow-up. In addition, anchor questions were also used to evaluate patient satisfaction and sports activity at the final (>2-year) follow-up.
Included were 245 adult patients (≥40 years old) who underwent ARCR between January 2015 and December 2016. Patients who underwent revision ARCR, concomitant superior capsular reconstruction, or tendon transfer and those with a history of surgery on the ipsilateral shoulder joint or workers’ compensation were excluded. Eight patients were excluded for these reasons, and 36 (15.2%) patients were lost to clinical follow-up; thus, the final study population consisted of 201 patients (Figure 1).
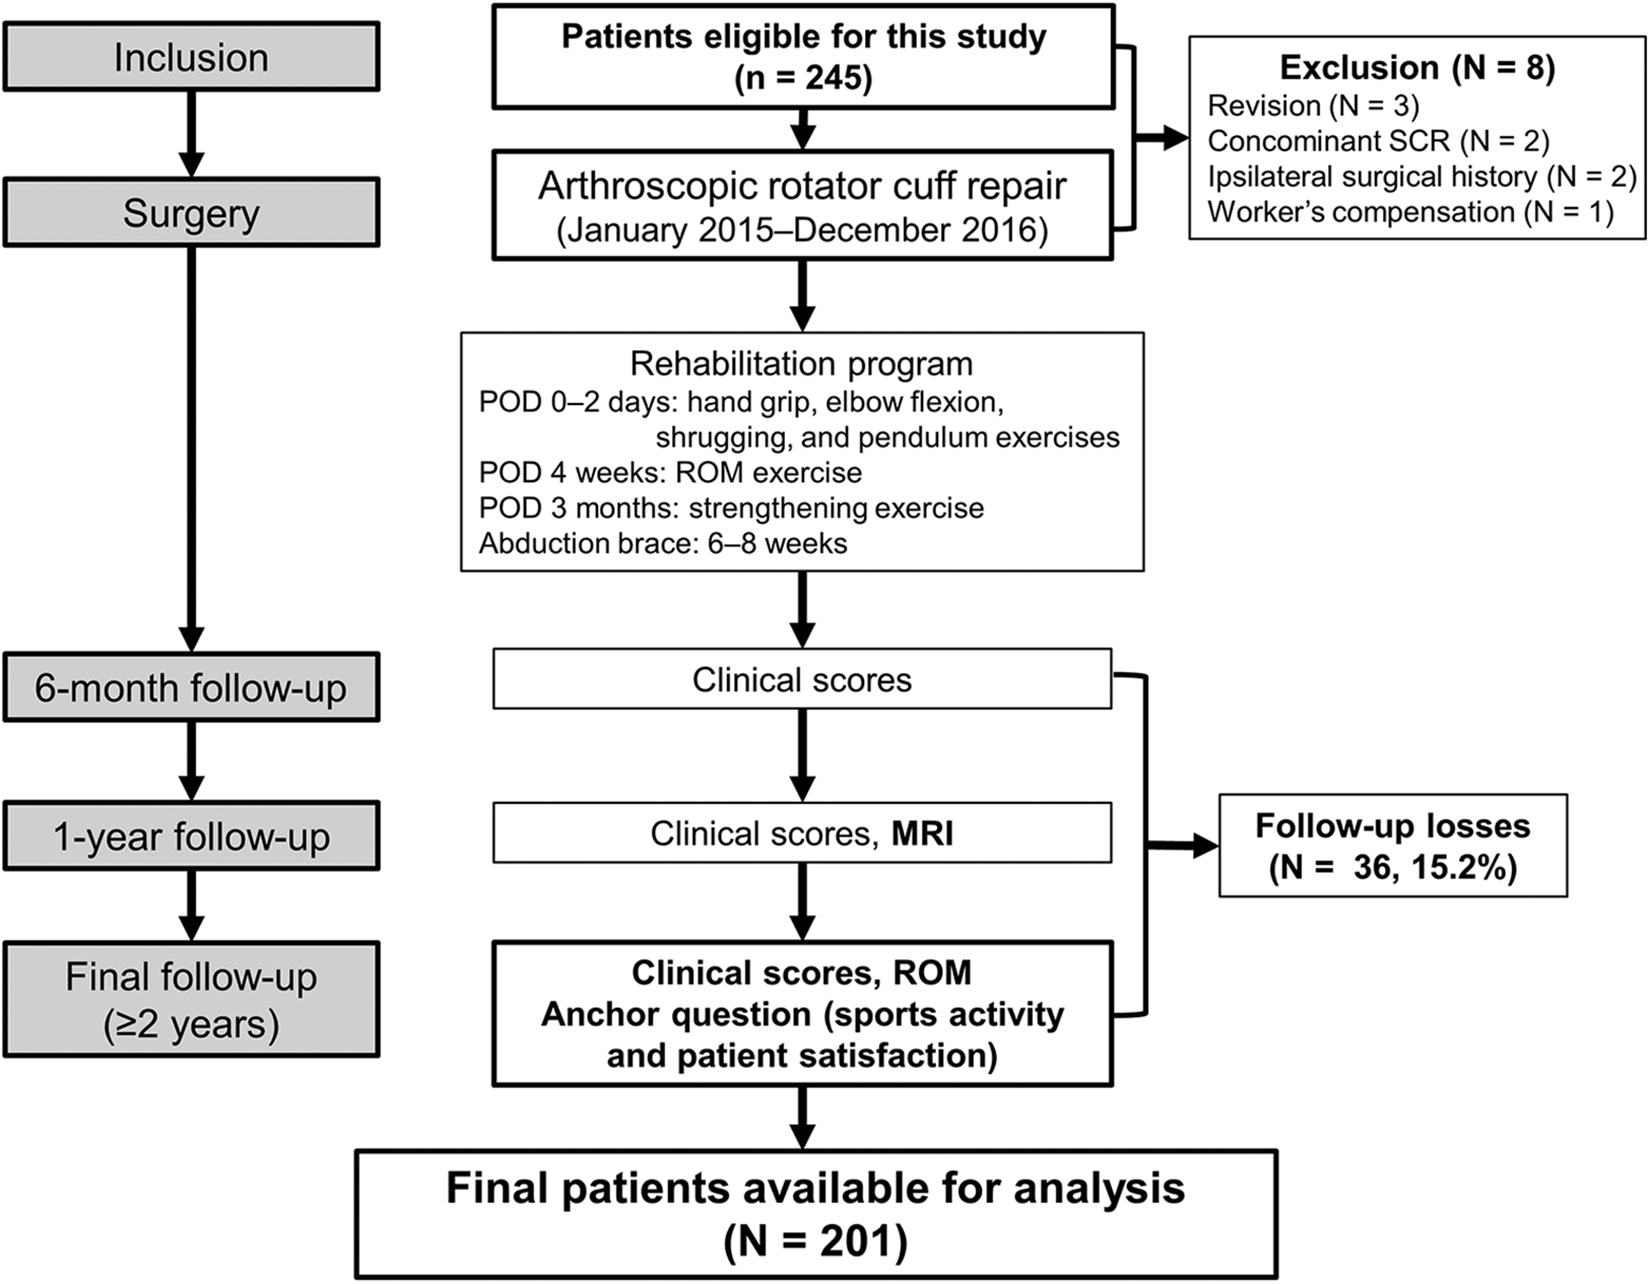
Flowchart showing the overall progress of this study. MRI, magnetic resonance imaging; POD, postoperative day; ROM, range of motion; SCR, superior capsular reconstruction.
The SAAS and PASS
In this study, we defined the SAAS as the degree to which a patient currently (1) enjoys certain sports activities or (2) can immediately perform sports activities even if he or she is not currently active. Achievement was categorized as grade A (impossible), B (possible), or C (active) (Table 1).
Study Group Classifications for Evaluating the SAAS and PASS a
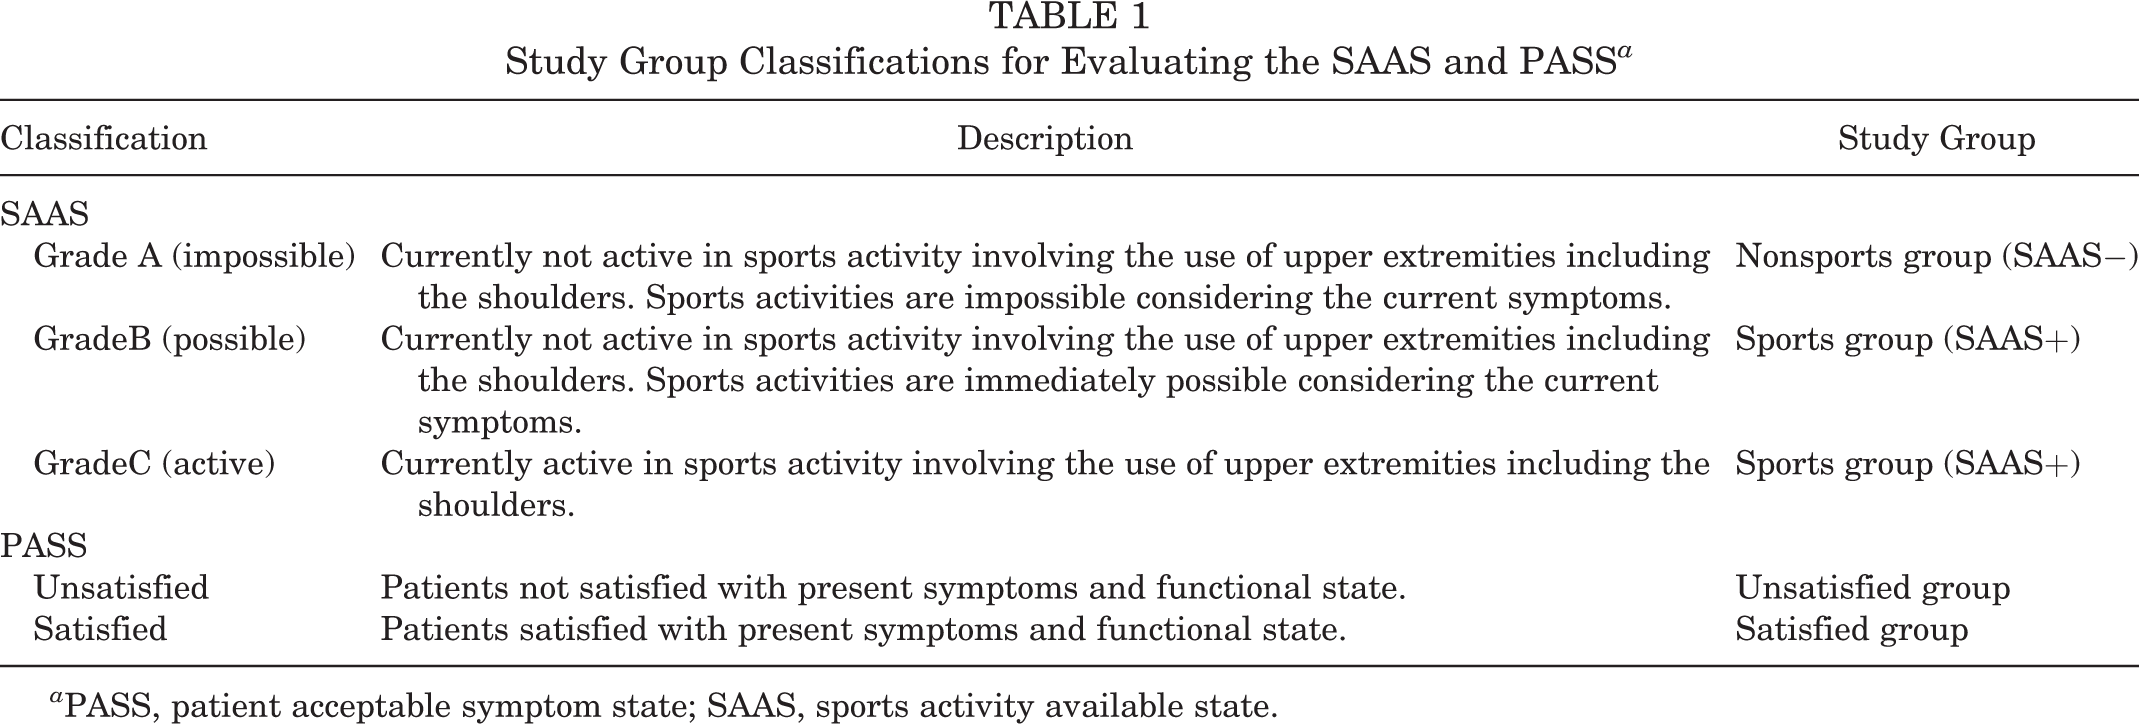
a PASS, patient acceptable symptom state; SAAS, sports activity available state.
Anchor questions were used to define the SAAS and derive the PASS values for pVAS, ASES, and SANE scores. 8,30 For PASS values, patients who answered that they were satisfied with their current condition in terms of pain and function were classified into the satisfied group, and those who responded otherwise were classified into the unsatisfied group. For the SAAS, patients who reported that they were currently active in sports activity (grade C) or who were able to perform sports activity at any time (grade B) were classified into the sports group (SAAS+), and the remaining patients (grade A) were classified into the nonsports group (SAAS−) (Table 1).
Data Collection
Patient sex, age, height, weight, body mass index (BMI), bone mineral density, medical history, Charlson Comorbidity Index (CCI), and smoking status are the demographic data collected from the participants. In addition, imaging and operative data such as tear size (small, medium, large, or massive), 16 modified Goutallier fatty infiltration, 12,14 repair configuration (single or double row), acromioplasty, biceps procedure (none, tenodesis, tenotomy), and subscapularis tear and repair were also collected. Tear size was measured in millimeters using a probe during the arthroscopic surgery. The postoperative integrity of the repaired tendon was evaluated by MRI at the 1-year follow-up. Each case was classified into 5 categories according to Sugaya classification (type 1, sufficient thickness with homogeneously low intensity; type 2, sufficient thickness with partial high intensity; type 3, insufficient thickness without discontinuity; type 4, presence of a minor discontinuity; and type 5, presence of a major discontinuity). 26 Sugaya types 4 and 5 were considered to be retears. All clinical scores during the study period were measured and collected by a clinical nurse specialist with 10 years of experience (J.H.P).
Statistical Analyses
Statistical analysis for deriving PASS values was conducted using MedCalc 19.0.7 (MedCalc Software), which has been used as a reference software. Other analyses were conducted with IBM SPSS for Windows Version 24.0 (IBM).
Derivation of PASS Values
The differences between the sports and nonsports groups and between the satisfied and unsatisfied groups were examined using the t test before the derivation of PASS values. Next, receiver operating characteristic (ROC) curves were drawn for each score, and the AUCs for deriving PASS values were calculated. An AUC ≥0.7 was considered acceptable, and an AUC ≥0.8 was considered excellent. 3 The optimal cutoff value for maximizing the sensitivity and specificity in the ROC curve between the unsatisfied and satisfied groups was defined as the PASS value. 8
Correlation Between the PASS and SAAS
The categorical data (yes or no) of the PASS and SAAS achievement was obtained according to the anchor question. The phi correlation coefficient was analyzed between PASS and SAAS. In addition, the derived PASS values were applied to investigate whether the PASS value would be useful for estimating SAAS. The independent SAAS values would need to be developed if the derived PASS values were not useful for estimating SAAS.
Univariate and Multivariate Logistic Regression Analyses
To identify independent factors for achieving PASS and SAAS after ARCR, we performed univariate and multivariate regression analyses. Categorical and numerical data were analyzed using the chi-square test and the Student t test, respectively, in the univariate analysis, and variables with P <.150 were included in the multivariate analysis. Variables with P <.05 were considered significant for achieving PASS and SAAS. The model derived from the logistic regression analysis was tested using the Hosmer-Lemeshow test.
Results
Demographic and Baseline Data
Included in the study were 100 men and 101 women with a mean age of 60.6 ± 7.9 years (range, 41-79 years) and a mean BMI of 25.1 ± 2.5 kg/m2 (range, 18.9-32.7 kg/m2). The mean age-adjusted CCI was 2.1 ± 1.3 (range, 0-6). The final follow-up was at a mean of 38.7 ± 7.0 months. All participants were either nonathletes or recreational athletes, defined as those who are physically active but have not received professional training for competition. Table 2 shows the baseline data of the number of total patients, nonsports (SAAS−) group, and sports (SAAS+) group included in the study.
Demographic and Baseline Data and Comparison Between SAAS Groups a

a Data are presented as mean ± SD (range) or n (%). BMI, body mass index; CCI, Charlson Comorbidity Index; SAAS, sports activity available state.
The nonsports group had 30 (14.9%) patients, and the sports group had 171 (85.1%) patients (31 [15.4%] with SAAS grade B and 140 [69.7%] with grade C). Similarly, the PASS unsatisfied and satisfied groups had 30 (14.9%) and 171 (85.1%) patients, respectively. Bicipital tenodesis and bicipital tenotomy were performed in 22 (10.9%) and 20 (10.0%) patients, respectively. Of the patients, 19 (9.5%), 73 (36.3%), 75 (37.3%), 26 (12.9%), and 8 (4.0%) were classified into the Goutallier classifications of 0, 1, 2, 3, and 4, respectively. Retears were observed in 21 (15.2%) patients. Significant differences between the groups were noted in diabetes, large to massive tear, Goutallier classification, presence of subscapularis tear, and repair configuration items between the nonsports and sports groups (univariate analysis).
Derivation of PASS Values for Clinical Scores
Figure 2A shows the results of the comparison of each final score between the SAAS nonsports and sports groups. A statistically significant difference (P < .001 for all) in the final score was observed between the 2 groups. Figure 2B shows the results of the current analysis that compared the mean of each final score between the PASS unsatisfied and satisfied groups. Similarly, the means of the final scores between the 2 groups showed a statistically significant difference (P < .001 for all). The ROC curve was drawn and analyzed for the derivation of the PASS value. The AUCs for deriving PASS values were 0.838, 0.859, and 0.872, respectively. The AUCs of ROC curves for all scores were >0.8 (ie, excellent). Thus, the results of the t test and ROC curves showed that reliable PASS values could be derived for all 3 scores.
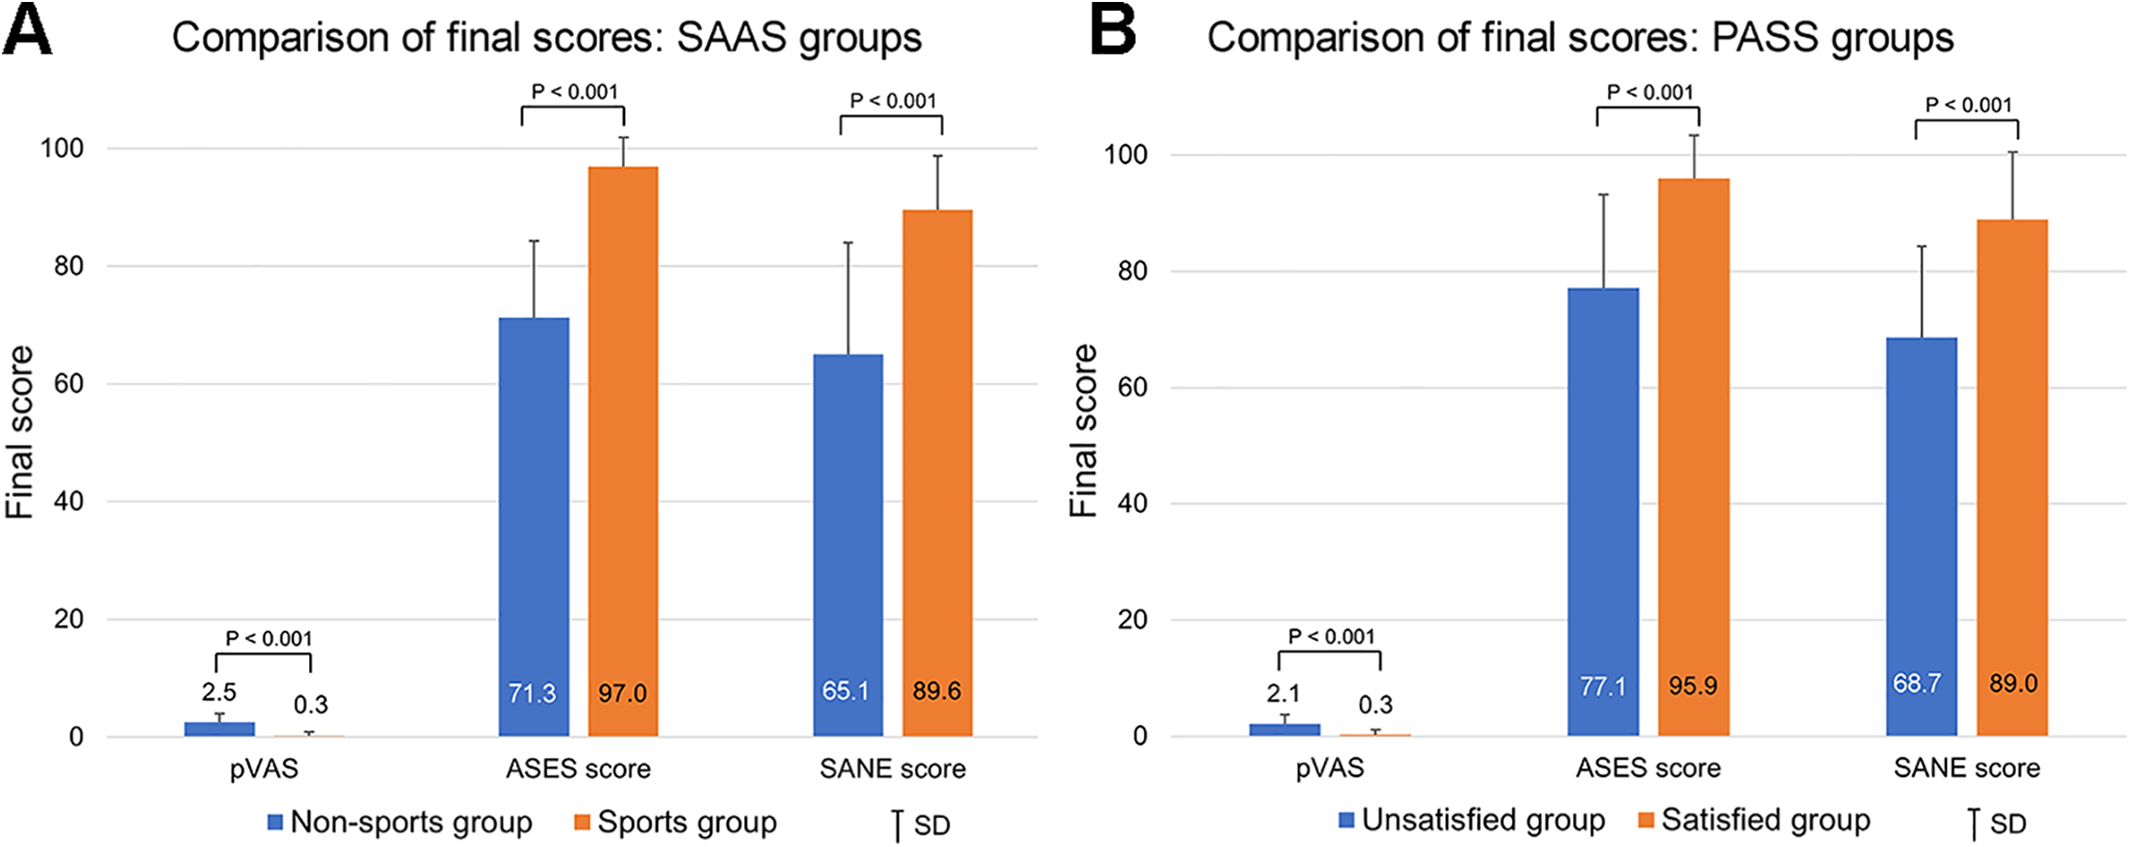
Comparison of final outcome scores between the (A) sports activity available state (SAAS) nonsports and sports groups and (B) patient acceptable symptom state (PASS) unsatisfied and satisfied groups. ASES, American Shoulder and Elbow Surgeons; pVAS, pain visual analog scale, SANE Single Assessment Numeric Evaluation.
Correlation Between the PASS and the SAAS
Table 3 summarizes the PASS values along with their sensitivity and specificity. The PASS values for the pVAS, ASES, and SANE scores at final follow-up were 0.5, 93.5, and 82.5, respectively.
PASS Values for Each Outcome Measure at Final Follow-up a

a ASES, American Shoulder and Elbow Surgeons; AUC, area under the receiver operating characteristic curve; PASS, patient acceptable symptom state; pVAS, pain visual analog scale; SANE, Single Assessment Numeric Evaluation.
The phi correlation coefficient between PASS and SAAS was 0.647 (P < .001), which indicated a strong correlation between the 2 states. An analysis was also conducted to determine whether SAAS could be sufficiently predicted using the derived PASS values (Table 4). The sum of sensitivity and specificity was >1.5, and each value was >0.7, which is the result of predicting the SAAS status using PASS values for all scores. Thus, PASS values for all 3 scores were useful for SAAS prediction.
Prediction of SAAS Using PASS Values a

a ASES, American Shoulder and Elbow Surgeons; PASS, patient acceptable symptom state; pVAS, pain visual analog scale; SAAS, sports activity available state.
Independent Factors for Achieving PASS and SAAS
Table 5 shows the results of the factor analyses that were conducted to identify the factors affecting the achievement of PASS and SAAS. Diabetes showed a lower odds ratio (OR; nearly significant, P = .055) for PASS acquisition, and diabetes (OR, 0.348 [95% CI, 0.130-0.931]; P = .036) and large to massive tear (OR, 0.378 [95% CI, 0.162-0.884]; P = .025) were significantly negatively associated with SAAS acquisition. Moreover, a higher preoperative ASES score was significantly associated with both PASS and SAAS acquisition (OR for PASS, 2.556 [95% CI, 1.753-3.726], P < .001; OR for SAAS, 1.032 [95% CI, 1.005-1.059], P = .018).
Factors Affecting the Achievement of PASS and SAAS a
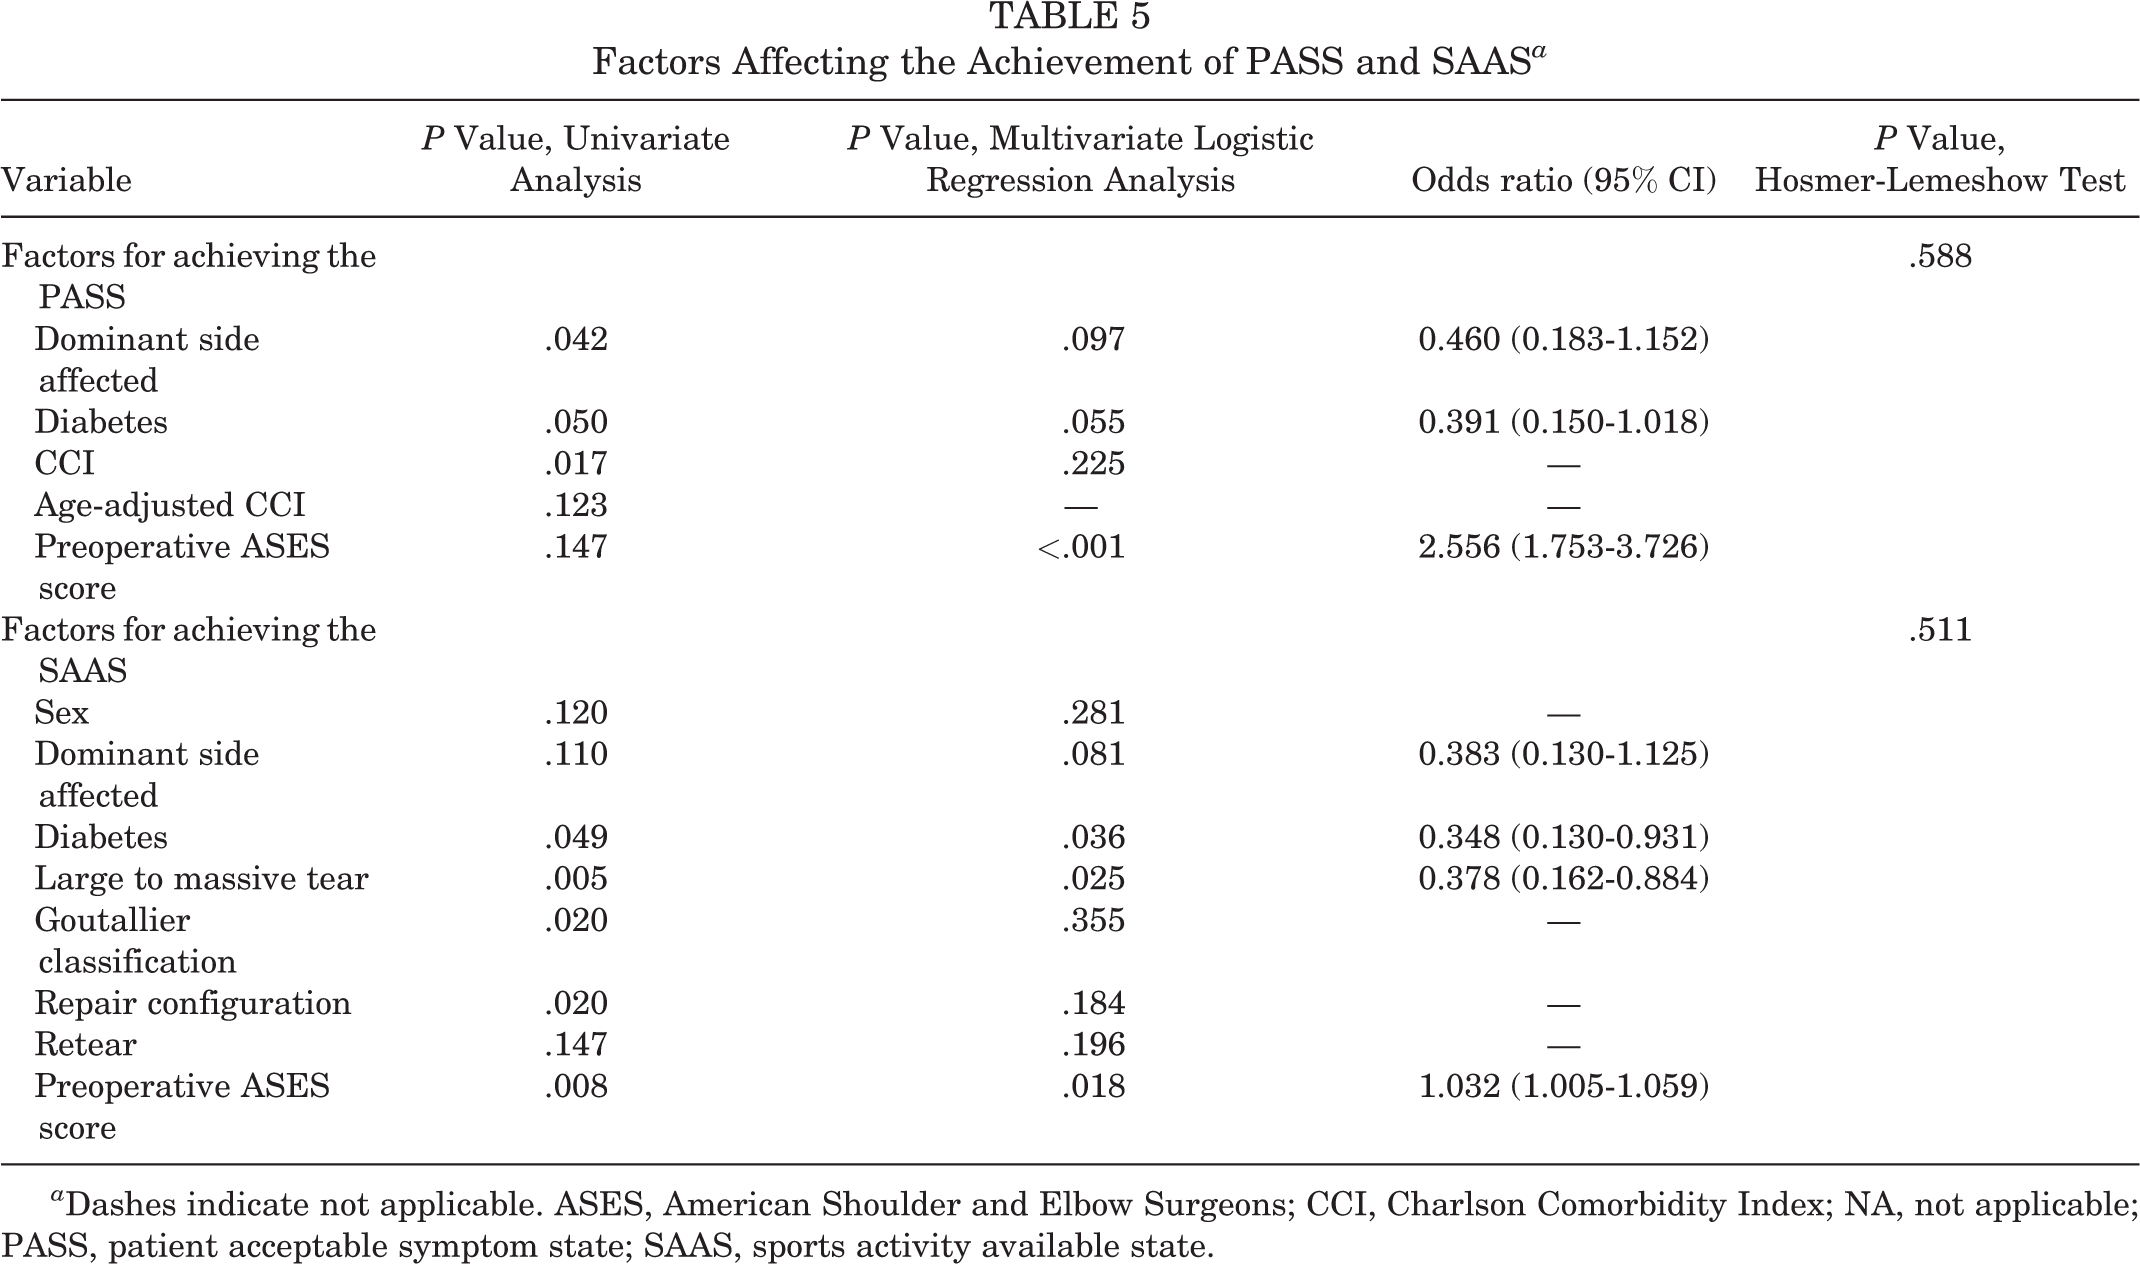
a Dashes indicate not applicable. ASES, American Shoulder and Elbow Surgeons; CCI, Charlson Comorbidity Index; NA, not applicable; PASS, patient acceptable symptom state; SAAS, sports activity available state.
Discussion
The SAAS, a new indicator of sports activity, is presented in this study. The significant correlation between PASS and SAAS was the most impressive finding. Moreover, SAAS was sufficiently predicted using the PASS value with high sensitivity and specificity. Thus, we assume that there is no need to develop an independent SAAS value to predict SAAS. The findings of the current study highlight the importance of the PASS concept, which is useful for predicting SAAS as well as evaluating patient satisfaction.
Reliable PASS values for each score (pVAS, ASES, and SANE scores) were derived. All the AUCs were at an excellent (>0.8) levels. The PASS values for pVAS, ASES, and SANE scores were 0.5, 93.5, and 82.5, respectively. If the patient’s pVAS score is <0.5, ASES score is at least 93.5, or SANE score is at least 82.5, the patient is likely to be satisfied with the present state. The PASS values presented by Cvetanovich et al 11 were 86.7 and 82.5 for the ASES and SANE scores, respectively. However, the values presented by Kim et al 17 were 1.7, 78.0, and 71.0 for pVAS, ASES, and SANE scores, respectively. Differences in PASS values were noted among the studies. This is presumably because of the difference in follow-up duration. The current study, the study by Cvetanovich et al, 11 and the study by Kim et al 17 used the anchor question for PASS at >2, 1, and 1-year follow-up periods, respectively. These results suggest that the patient’s scores may improve even after 1 year of follow-up. However, further studies are needed.
Except for the 2 studies, few studies have been conducted on PASS after ARCR. The minimal clinically important difference (MCID) and substantial clinical benefit (SCB) are also commonly used in patient-based evaluations. MCID and SCB are concepts that are used to evaluate the degree of improvement compared with the patients’ status before treatment. 10,19,23,28 Applying MCID or SCB values to patient care is difficult if preoperative clinical scores are not measured. Moreover, PASS is a concept that is evaluated based on the current state of the patient. PASS values have the advantage that they can be easily applied at every follow-up. The results of this study show that the PASS concept is useful for both predicting the sports activity state and evaluating patient satisfaction. Although SAAS is an indicator for evaluating a patient’s sports activity level, we assume that PASS is easier to perform and more useful in actual clinical practice.
In the analysis of factors related to PASS or SAAS, a variable with an OR >1 indicates the possibility of a positive role in a sports activity or patient satisfaction. In contrast, an OR <1 means that the factor may play a negative role in a sports activity or patient satisfaction. Diabetes and large to massive tears showed significantly lower ORs for SAAS acquisition. Furthermore, diabetes is a risk factor for frozen shoulder, 15,20 retear after ARCR, 9,18 and postoperative shoulder stiffness. 5,7 Thus, diabetes is likely to be a negative factor in shoulder-related treatments, which may have had a negative impact on SAAS (significant) and PASS (nearly significant) acquisition in the current analysis. The results of the current study suggest the possibility that large to massive tears adversely affect patient function (eg, activity) but not patient satisfaction.
The results of the ORs, according to preoperative ASES scores, show that the higher the preoperative ASES score, the more likely the patient is to achieve SAAS. The ASES score also includes the availability of various daily activities, unlike the pVAS or SANE scores. The higher preoperative ASES score may have had a positive effect on SAAS achievement because patients with high preoperative ASES scores were more likely to be active. The results of the current factor analysis can be useful not only for predicting the sports activity of ARCR patients but also for counseling patients who are active in sports activities.
Studies on orthopaedic treatment and sports activity have mainly used return to sports or the type of sports activity after treatment as the main outcomes. Several articles exist on the topic of the return to sports after ARCR. 1,2,4 Moreover, a systematic review by Altintas et al 1 analyzed 15 relevant articles. The overall rate of return to sports at a similar level of play or higher was 70.2%. However, it is believed that no previous study has analyzed the overall rate of SAAS. The current results show that the overall rate of SAAS was 85.1% (171/201) after ARCR. In addition, the application of the SAAS concept will enable sports-related research, including the outcome of the time to achieve SAAS.
Limitations
The current study has several limitations. First, the preoperative SAAS of the patients was not recorded because sports have been overlooked among the existing score systems (pVAS, ASES, and SANE scores). Thus, investigating the preoperative state of sports activity in the future may be necessary. Second, the type of sports activity currently being performed was not examined in detail. Third, none of the patients included in the data of the current study were professional athletes. Further research will enable the verification of values based on the type, intensity, and professionalism of sports activities. Fourth, there were no adults young than 40 years of age among the patients included in this study. As young adults are usually more active, further research is warranted on this age group.
Conclusion
We found the SAAS to be significantly correlated with the PASS. Also, SAAS was able to be predicted using the PASS value. Patients with higher preoperative ASES scores had higher odds of achieving both the PASS and SAAS, and patients with diabetes and those with large to massive tears had lower odds of achieving the SAAS.
Footnotes
Final revision submitted November 17, 2021; accepted December 23, 2021.
The authors declared that they have no conflicts of interest in the authorship and publication of this contribution. AOSSM checks author disclosures against the Open Payments Database (OPD). AOSSM has not conducted an independent investigation on the OPD and disclaims any liability or responsibility relating thereto.
Ethical approval for this study was obtained from Asan Medical Center (ref. No. AMC 2019-0133).