
Abstract
Background:
Track and field (T&F) athletes compete in a variety of events that require different skills and training characteristics. Descriptive epidemiology studies often fail to describe event-specific injury patterns.
Purpose:
To describe the epidemiology of injuries in National Collegiate Athletic Association (NCAA) T&F by sex, setting (practice vs competition), and time of season (indoor vs outdoor) and to compare injury patterns by events within the sport.
Study Design:
Descriptive epidemiology study.
Methods:
Data were obtained from the NCAA Injury Surveillance Program for all indoor and outdoor T&F injuries during the academic years 2009-2010 to 2013-2014. Injury rates, injury rate ratios, and injury proportion ratios (IPRs) were reported and compared by sex, injury setting, season, and event. Analysis included time-loss as well as no-time loss injuries.
Results:
Over the 5 seasons, the overall injury rate was 3.99 injuries per 1000 athletic-exposures (95% CI, 3.79-4.20). After controlling for injury diagnoses, women’s T&F athletes experienced an 18% higher risk of injury (95% CI, 7% to 31%) and missed 41% more time after an injury (95% CI, 4% to 93%) when compared with men. Among all athletes, the injury risk during competition was 71% higher (95% CI, 50% to 95%) compared with practice and required 59% more time loss (95% CI, 7% to 135%). Distance running accounted for a significantly higher proportion of overuse injuries (IPR, 1.70; 95% CI, 1.40-2.05; P < .05) and required 168% more time loss (95% CI, 78% to 304%) than other events. The hip and thigh were the body regions most commonly injured; injury type, however, varied by T&F event. Sprinting accounted for the greatest proportion of hip and thigh injuries, distance running had the greatest proportion of lower leg injuries, and throwing reported the greatest proportion of spine and upper extremity injuries.
Conclusion:
Injury risk in NCAA T&F varied by sex, season, and setting. Higher injury rates were found in women versus men, indoor versus outdoor seasons, and competitions versus practices. The hip and thigh were the body regions most commonly injured; however, injury types varied by event. These findings may provide insight to programs aiming to reduce the risk of injury and associated time loss in collegiate T&F.
By number of participants, track and field (T&F) was the second most popular sport in the National Collegiate Athletic Association (NCAA) in 2018-2019 after football. 19 While the number of NCAA football participants has increased by 18% over the past decade, outdoor T&F has experienced an even greater rise of 25%. 19 With this growth in T&F participation, an increase in T&F-related injuries is also expected. Thus, it is important to understand and examine the incidence, types, and severity of injuries associated with participation.
To date, only 2 large epidemiological studies have reported on collegiate T&F injuries. 22,27 These studies reported only on the incidence of injuries and did not provide any specific data such as the nature, type, or severity of injuries specific to T&F. T&F teams are composed of athletes with diverse body types and skills who compete in distinctive events that may predispose them to different types of injuries. Thus, a large epidemiological study is necessary to investigate how collegiate T&F sprinters, distance runners, jumpers, and throwers might differ in the types and severity of injuries they sustain.
The purpose of this study was to examine data from the NCAA Injury Surveillance Program (ISP) from 2009-2010 through 2013-2014 to describe the epidemiology of men’s and women’s T&F injuries. The objectives of our study were to (1) describe and compare injury rates by sex, setting, and season and (2) examine injury patterns by T&F event.
Methods
Data Collection
Data for NCAA T&F for the academic years of 2009-2010 through 2013-2014 were provided by the NCAA ISP, which is managed by the Datalys Center for Sports Injury Research and Prevention. The ISP collects data from a convenience sample of NCAA Divisions I, II, and III varsity sports teams with athletic trainers (ATs) reporting injury data. The ATs at participating programs report injuries in real time throughout the academic year as well as the number of student-athletes at varsity practice and competition events. The methods of the ISP have been recorded and summarized previously. 11,12
When an injury event was detected by, or reported to, an AT, the AT completed a detailed report on the athlete (eg, sport, position, class year), their injury (eg, body site, diagnosis), and the circumstances of their injury (eg, mechanism of injury, practice or competition, new or recurrent). Before arriving at the Datalys Center for Sports Injury Research and Prevention, common data elements were recoded and stripped of any identifiers and personally identifiable information, retaining only relevant variables and values. 11 An automated verification process conducted consistency checks on exported data, and data were reviewed and flagged for invalid values. The reporting AT and data quality assurance staff would be notified of any flagged values and would work together to resolve the concern. Verified data were then placed into sport-specific aggregate data sets for use by external researchers.
Operational Definitions
The NCAA ISP defines a reportable injury as one that (1) occurred as a result of participation in an organized intercollegiate practice or competition and (2) required attention from an AT or physician. Multiple injuries occurring from a single injury event could be included. Injuries that resulted in time loss (TL) were included, as were injuries that resulted in no time loss (NTL). Injuries that resulted in restricted participation for less than 1 day were considered NTL injuries. NTL injuries were further categorized in terms of how they affected the injured athlete’s participation: “did not interfere with activity,” “returned to team activity within the same session,” or “removed from team activity session (returned within 24 hours).”
Injuries were also stratified by the athlete’s activity at the time of injury. At their discretion, reporting ATs categorized T&F activities as follows: sprinting, distance running, jumping, throwing, and other or unknown. In addition, injuries were stratified by affected body region after evaluation by sports medicine staff. The following body regions were used for analysis: hip/thigh, knee, lower leg, foot/ankle, wrist/hand, elbow/forearm, shoulder, spine, and other. Last, injuries were reported as contact, noncontact, overuse/gradual, illness, or other/unknown at the discretion of the reporting AT. For this study, contact and noncontact injuries were combined into a single category, “acute injury,” which was used for comparison with injuries categorized as “overuse/gradual.”
A reportable athlete-exposure (AE) was defined as a single student-athlete participating in a single NCAA-sanctioned practice or competition, regardless of the time associated with that participation. Competition AEs included only student-athletes with actual playing time recorded in a given competition.
NCAA T&F is divided into 2 separate seasons, with the indoor season beginning in the winter and generally concluding with championships in early March. The indoor season is immediately followed by the outdoor season, which generally concludes with championships in early June. Injury setting was stratified into competition and practice.
Statistical Analysis
Injury rates and rate ratios (RRs) per 1000 AEs were calculated by the number of injuries divided by the number of AEs. Overall injury rates, TL injury rates, and NTL injury rates were determined for the entire sample and stratified by sex, season (indoor vs outdoor), and setting (competition vs practice). RRs and 95% CIs were used for comparisons of injury risk between sexes, seasons, and settings.
The percentage of injuries resulting in time loss were determined for participants and were stratified by sex, season, setting, and activity (sprinting, distance running, jumping, throwing, and other/unknown).
The number of days missed per injury was compared using negative binomial regression, which controlled for sex and injury diagnoses. Negative binomial regression was chosen due to overdispersion of the dependent variable (number of days missed per injury) defined as having greater variance than mean values; the results are reported as RRs with 95% CIs. This method allowed for results to be interpreted as the ratio of days missed per injury by sex, season, setting, and activity. For example, the ratio of days missed per injury between injuries experienced during competitions versus practices while controlling for sex and injury diagnoses.
The proportion of overuse injuries was calculated for each T&F activity and then compared using injury proportion ratios (IPRs). IPRs allow the comparison of relative proportions across categorical variables and are used commonly in injury epidemiology research when certain exposure data may be unavailable. 14 An example IPR in this instance would be the proportion of overuse injuries during men’s sprinting compared with the proportion of overuse injuries during all other men’s activities.

This type of ratio allowed the comparison of injury patterns across T&F activities to understand if certain injury types constituted a greater proportion among certain activities compared with others. IPRs were used to compare the proportion of overuse to acute injuries within each activity and also to compare the proportions of overuse injuries between activities. IPRs are reported as RRs and 95% CIs.
The proportions of injuries by body region were also compared between sexes and activities using IPRs. An example IPR in this instance would be the proportion of knee injuries during sprinting compared with the proportion of knee injuries during all other activities. This type of analysis allowed the comparison of injury patterns to determine if injuries sustained during particular T&F activities accounted for a greater proportion of injuries to specific body regions compared with the other activities.
All data analyses were conducted using STATA 14.2 statistical software (Stata).
Results
Over 5 NCAA T&F seasons (2009-2010 through 2013-2014), there were 1466 injuries sustained during 367,285 AEs among 48 women’s T&F teams and 44 men’s T&F teams. This resulted in an overall injury rate of 3.99 injuries per 1000 AEs for T&F athletes (95% CI, 3.79-4.20). There were 595 TL injuries, 810 NTL injuries, and 61 injuries with unknown time-loss classifications. Therefore, the TL and NTL injury rates were 1.62 injuries per 1000 AEs (95% CI, 1.50-1.76) and 2.21 injuries per 1000 AEs (95% CI, 2.06-2.36), respectively.
The overall injury rate was 16% higher during the indoor compared with the outdoor season (95% CI, 4% to 29%; P < .05), the difference attributed mostly to NTL injuries. Athletes experienced a 27% greater risk of NTL injuries during the indoor season compared with the outdoor season (95% CI, 10% to 46%; P < .05). The risk of experiencing a TL injury was 16% higher during the indoor season compared with the outdoor season, but this difference did not reach statistical significance (95% CI, -1% to 37%; P = .07).
The overall injury rate was 18% higher among women compared with men (95% CI, 7% to 31%; P < .05) (Table 1). The rate of TL injuries was 22% higher among women compared with men (95% CI, 4% to 43%; P < .05), but no significant difference was observed in the rate of NTL injuries between sexes. The overall injury rate was 71% higher during competition compared with practice (95% CI, 50% to 95%; P < .05) (Table 2). The rate of TL injuries was 107% higher during competition compared with practice (95% CI, 71% to 151%; P < .05) and the rate of NTL injuries was also 39% higher during competition compared with practice (95% CI, 15% to 68%; P < .05).
T&F Injury Rates by Sex and Setting a

a Data in parentheses are 95% CIs. AE, athlete-exposure; NTL, no time loss; RR, rate ratio; T&F, track and field; TL, time loss.
b Injury rate per 1000 AEs.
c Women’s injury rate/men’s injury rate.
d Competition injury rate/practice injury rate.
eP < .05.
f 61 injuries with unknown time loss.
Of the 1405 injuries with complete time-loss data, 42.4% required at least 1 day of time lost. The average time lost from an injury, including NTL injuries, was 7.13 days. Table 2 displays the proportion of TL injuries and the average time lost due to injury by sex, setting, and season. Controlling for injury diagnoses, female athletes missed 41% more time than male athletes (95% CI, 4% to 93%; P < .05); injuries occurring during competitions incurred 59% more time loss than injuries occurring during practice (95% CI, 7% to 135%; P < .05).
Time Lost From Injury by Sex, Setting, and Season a

a IQR, interquartile range; RR, rate ratio; TL, time loss.
b Negative binomial regression models controlling for sex and injury diagnoses.
cP < .05.
Table 3 displays the proportion of TL injuries and the average time lost according to the athlete’s activity at the time of injury. Compared with all other activities, distance running injuries resulted in 168% more time loss (78% to 304%; P < .05) after controlling for sex and injury diagnoses.
Time Lost From Injury by T&F Activity a

a RR, rate ratio; T&F, track and field; TL, time loss.
b Negative binomial regression models controlling for sex, activity, and injury diagnoses.
cP < .01.
During the study period, 35.5% of injuries were recorded as overuse or gradual-onset injuries. Sprinting, jumping, and throwing injuries each had a significantly lower proportion of overuse injuries compared with acute injuries; however, no difference was observed among distance running injuries, as 52.1% of distance running injuries were classified as overuse. IPRs were also used to estimate differences in overuse injury proportions between activities. Distance running accounted for a significantly higher proportion of overuse injuries compared with all other activities (IPR, 1.70; 95% CI, 1.40-2.05; P < .05). Conversely, throwing accounted for a significantly lower proportion of overuse injuries compared with all other activities (IPR, 0.57; 95% CI, 0.37-0.88; P < .05). In addition, whereas men’s jumping accounted for a lower proportion of overuse injuries compared with all other men’s activities (IPR, 0.69; 95% CI, 0.47-0.99; P < .05), this difference was not observed among women’s jumping injuries.
Table 4 lists commonly injured body regions for sprinting, distance running, jumping, and throwing. The proportion of injuries affecting each body region for women and men was compared by T&F activity. Sprinting accounted for 21% of women’s and 25% of men’s T&F injuries. Women’s sprinting injuries most commonly involved the hip/thigh (46.8%), foot/ankle (11.5%), and knee (10.3%). Women’s sprinting injuries accounted for a significantly greater proportion of hip/thigh injuries compared with all other women’s T&F activities (IPR, 2.06; 95% CI, 1.55-2.73; P < .05). Men’s sprinting injuries most commonly involved the hip/thigh (53.3%), lower leg (12.8%), and foot/ankle (12.2%). Men’s sprinting injuries accounted for a significantly higher proportion of hip/thigh injuries compared with all other men’s T&F activities (IPR, 2.06; 95% CI, 1.59-2.67; P < .05).
Injuries by Activity, Sex, and Body Region a
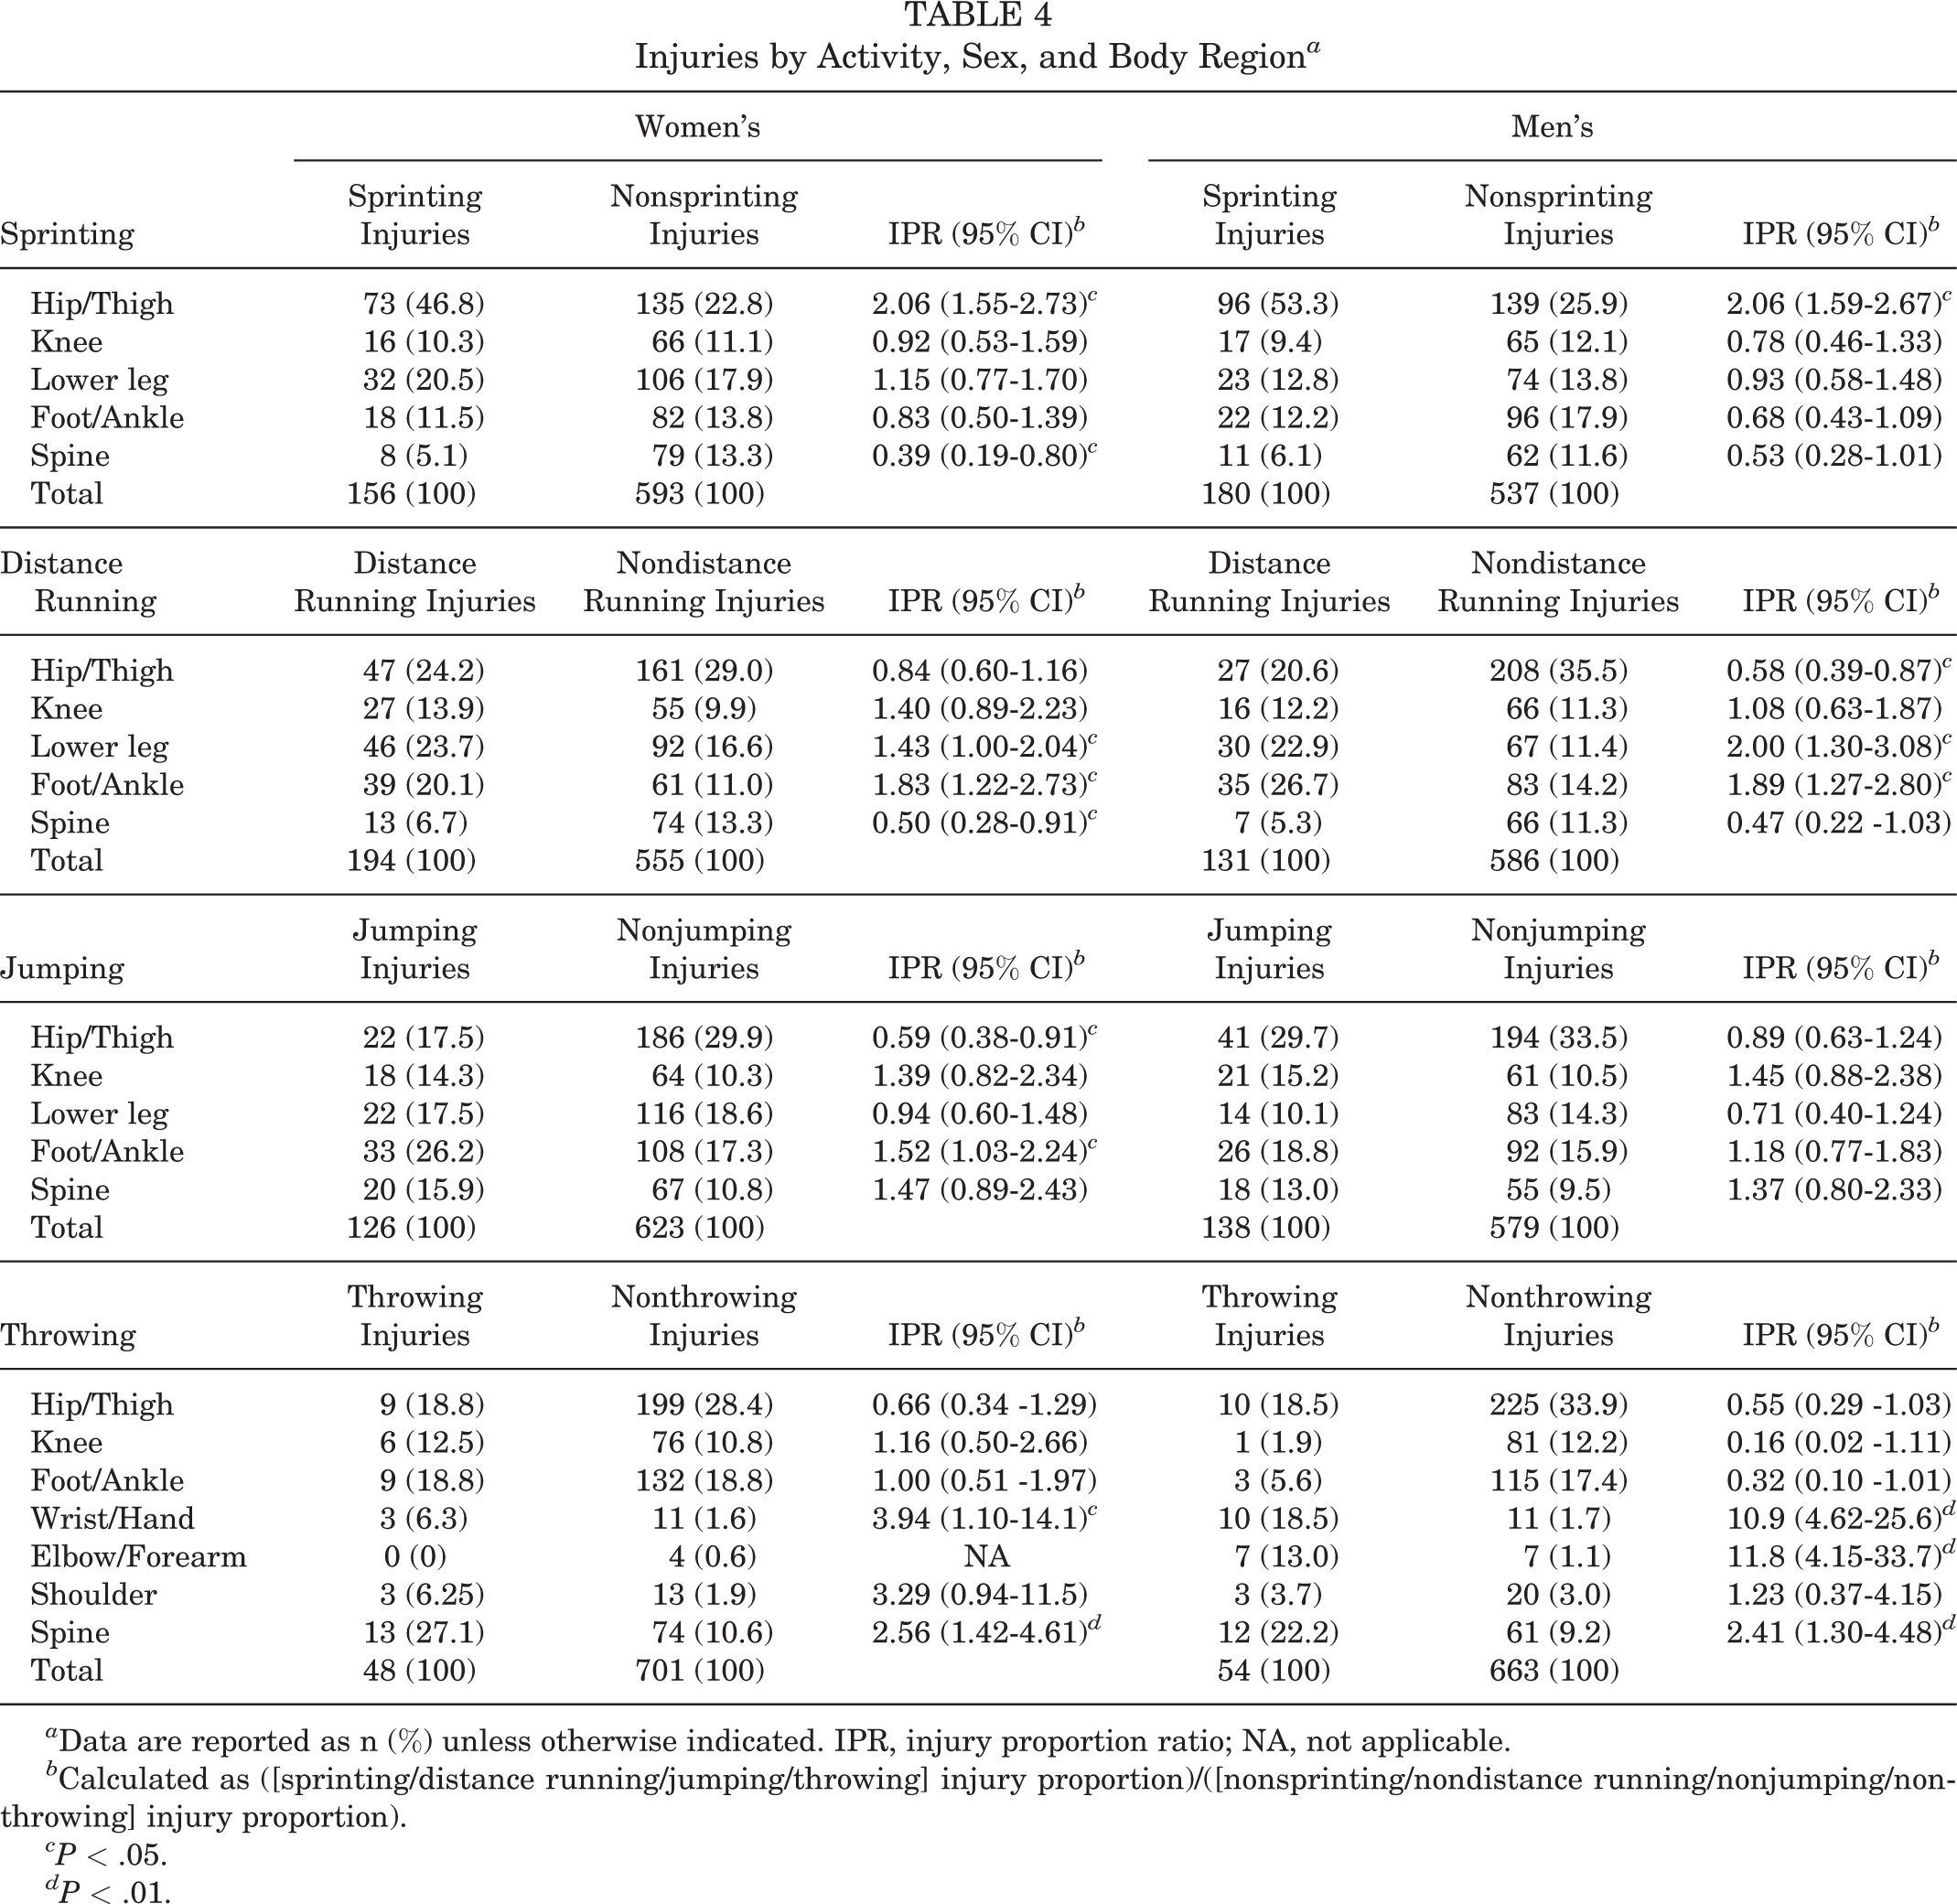
a Data are reported as n (%) unless otherwise indicated. IPR, injury proportion ratio; NA, not applicable.
b Calculated as ([sprinting/distance running/jumping/throwing] injury proportion)/([nonsprinting/nondistance running/nonjumping/nonthrowing] injury proportion).
cP < .05.
dP < .01.
Distance running accounted for 25.9% of women’s and 18.3% of men’s T&F injuries. Women’s distance running injuries accounted for a significantly greater proportion of lower leg (IPR = 1.43; 95% CI, 1.00-2.04; P < .05) and foot/ankle injuries (IPR = 1.83; 95% CI, 1.22-2.73; P < .05) compared with all other women’s T&F activities. Men’s distance running injuries accounted for a greater proportion of lower leg (IPR = 2.00; 95% CI, 1.30-3.08; P < .05) and foot/ankle (IPR = 1.89; 95% CI, 1.27-2.80; P < .05) injuries compared with all other men’s T&F activities.
Jumping accounted for 16.8% of women’s and 19.3% of men’s T&F injuries. Women’s jumping injuries accounted for a significantly greater proportion of foot/ankle injuries compared with all other women’s T&F activities (IPR = 1.51). The body regions affect most commonly in men’s jumping injuries were not significantly different from other men’s T&F activities.
Throwing accounted for 6.4% of women’s and 7.5% of men’s T&F injuries. Women’s throwing injuries accounted for a greater proportion of wrist/hand (IPR = 3.98; 95% CI, 1.11-14.30; P < .05) and spine (IPR = 2.57; 95% CI, 1.42-4.63; P < .05) injuries compared with all other women’s T&F activities. Men’s throwing injuries accounted for a greater proportion of elbow/forearm (IPR = 12.3; 95% CI, 4.31-35.0; P < .05), wrist/hand (IPR = 11.2; 95% CI, 4.74-26.3; P < .05), and spine (IPR = 2.42; 95% CI, 1.30-4.49; P < .05) injuries compared with all other men’s T&F activities.
Discussion
The overall injury rate for collegiate T&F between 2009-2010 through 2013-2014 was 3.99 injuries per 1000 AEs. The injury rate was 18% higher in women’s T&F compared with men’s, 71% higher in competitions compared with practices, and 16% higher during the indoor season compared with outdoor.
The overall injury rate observed in this study is similar to the 3-year injury rate of 3.47 injuries per 1000 AEs reported study by Yang et al, 27 which combined cross-country and T&F injuries in the Big Ten Athletic Conference. However, the current study’s injury rate was significantly lower than the 23.68 injuries per 1000 AEs reported by Powell and Dompier 22 in collegiate T&F during a 2-year observation period with 50 colleges. This large discrepancy may be due to differences in how the ATs examined and reported NTL injuries. For example, NTL injuries accounted for almost 83% of T&F injuries (19.6 NTL injuries per 1000 AEs) in the study by Powell and Dompier compared with 36% of injuries in the study by Yang et al (2.3 NTL injuries per 1000 AEs) and 57.7% (2.2 NTL injuries per 1000 AEs) in the current study. The study by Powell and Dompier also measured all injuries and illnesses, even if they were not sport-related, whereas the current study defined injuries as occurring as a result of participation in an organized practice or competition. As other authors have previously described, 12 there may have been fewer minor injuries recorded in the NCAA ISP than those reported in the study by Powell and Dompier. However, the latter study did not report injury diagnoses, which may contribute to the difference in findings. For example, the current study had fewer than 1% of total injuries reported as abrasions or lacerations. If ATs in the study by Powell and Dompier recorded these types of minor injuries more frequently, it may help partially explain the large discrepancies in rates between the studies.
Sex, Setting, and Season
Overall, women’s T&F athletes had 18% higher injury risk than their male counterparts, which is a similar finding among other studies with collegiate and high school T&F athletes. 21,22 Women experienced 22% higher rates of TL injuries and took 41% more time to recover from injuries and return to sport compared with men. This increased recovery time may be due to their higher rates of TL and overuse injuries. For instance, although only a small occurrence, female athletes also experienced over twice the rate of stress fractures compared with male athletes. This is consistent with previous research in collegiate and high school T&F populations. 21,27 There are likely many factors explaining why women experience higher injury rates than men in T&F, but an often-cited cause is the Relative Energy Deficiency in Sport (RED-S) model. This model refers to impaired physiological function caused by an imbalance between dietary energy intake and the energy expenditure required for sporting activities. 18 Female T&F athletes are observed to have lower energy availability and lower bone mineral density than males, thus potentially (1) placing them at greater risk of bone-stress injuries, (2) impairing their recovery from training, and (3) reducing their neuromuscular function. 16 These physiological consequences of RED-S may increase not only female athletes’ risk of injury but also the time needed to recover from an injury, which was also a finding in the current study.
The risk of injury during competitions was 71% higher than during practice. The higher rate of injury during competitions was consistent among TL injuries as well as NTL injuries. In addition, the severity of injuries incurred during competitions was also greater and the time necessary to return to sport was 59% longer than injuries sustained during practice. Previous studies observing injuries in high school T&F and other collegiate sports have consistently found increased injury risk during competitions. 2,4,6,12,13,15,20,21,25 It is likely that the higher intensity in competition places athletes at a greater risk of injury, especially for those considered acute onset. Athletes experienced acute injuries at twice the rate during competitions compared with practices, whereas there was no observed difference in the rate of overuse injuries between competitions and practices.
This study also observed a 16% higher risk of injury during the indoor season compared with the outdoor season. The indoor season precedes the outdoor season each year, so this higher risk may be similar to the higher injury risk often observed during the preseason in other sports. 5,13,20 This finding may suggest athletes become more acclimated to the rigor of the sport once the outdoor season begins and possibly less susceptible to injury. Other important differences between the indoor and outdoor season pertain to the events that athletes compete in and the equipment they use. Most notably, indoor tracks are traditionally half the length of outdoor tracks, with narrower lanes and smaller curve radii. Athletes compete in different running and throwing events between seasons, which may contribute to different injury risks. For example, the longest running event during the indoor season is 5000 kilometers, whereas outdoor T&F meets include 5000 kilometer and 10,000 kilometer races. In addition, the shortest running event during the indoor season is a 60-m sprint, compared with the 100-m sprint during the outdoor season. The specific training required for events unique to the indoor or outdoor seasons may provide different injury risk exposures, such as training at faster speeds with greater intensity. Throwing events also differ between seasons due to the size of venues. These differing events may cause athletes to train and compete differently between the indoor and outdoor seasons in a shorter time period, which may also contribute to differences in injury risks. In addition, despite having competitions in indoor venues, many T&F teams continue to train outdoor during the winter months, where athletes are exposed to colder weather and possibly harsher conditions, such as snow and ice, which may also contribute to different injury risks than the outdoor season. Last, psychosocial factors may account for differences in injury reporting between the indoor and outdoor seasons. As described in previous literature, periodized training for T&F may be used for athletes to achieve peak fitness for their most important competitions, often during the outdoor season. 9,29 As T&F athletes progress toward their peak fitness and most important competitions, they may be less likely to report injuries due to fear of missing important meets during their peak fitness.
The findings from this study may indicate a need for a longer preseason or acclimation period prior to indoor T&F competitions and warrant future research on environmental and psychosocial factors of T&F injury risk and reporting.
Injury Activities
To date, very little research has compared injury types between various T&F events. Sprinting, distance running, jumping, and throwing require varying demands on athletes’ bodies, so differences in location and type of injuries should likely be expected between them. The current study observed greater proportions of hip and thigh injuries during sprinting in women and men compared with all other T&F activities. A high frequency of hamstring strains during sprinting accounted for much of this difference, as 32% of sprinting injuries involved the hamstring muscle group. Previous studies have found similarly high rates of hamstring strains in sports that require high-speed running, such as football, soccer, and rugby in addition to T&F. 1,3,7,26 Many studies have focused on the biomechanics of high-speed running to understand the mechanism of hamstring injury, and they generally observe forceful eccentric contractions by the hamstring muscles during the late swing phase of the gait cycle when the muscle is the most lengthened and thus susceptible to a strain injury. 10,24,28
The current study found distance running to have greater injury proportions to the lower leg, foot, and ankle when compared with all other activities. Distance running places repetitive stress on the lower leg structures associated with these overuse injuries. 8,23 Thus, as expected, distance running also had the greatest proportion of overuse injuries compared with other activities, and the lower leg was the most common body region to experience overuse injuries such as medial tibial stress syndrome and Achilles tendonitis. Women’s jumping also accounted for higher proportions of foot and ankle injuries compared with other activities; however, jumping injuries to the foot and ankle were more commonly acute injuries such as lateral ankle sprains compared with the frequent overuse injuries observed with distance running.
While throwing accounted for the smallest percentage of injuries in this study, it also had the most unique injury profile with the highest proportion of injuries to the upper extremities and spine. Meron Saint-Phard 17 described how different throwing events such as shot put, discus, hammer, and javelin all rely on efficient transfer of energy from the lower extremities through the spine and the upper extremities. Breakdowns in this kinetic chain can result in injuries affecting any of these regions. Given the demands placed on the upper extremities compared with running and jumping, it is not surprising that throwing accounts for higher proportions of wrist and hand injuries. Furthermore, each type of throw involves hyperextension and rotation of the lumbar spine, which may increase the risk for strain of the core and lumbar musculature and chronic injuries due to the repetitive heightened stress on these axial structures. 17
Limitations
The findings from the current study may not be generalizable to other competition levels such as high school, professional, or recreational T&F athletes. This surveillance study also did not account for the many individual- or institutional-related factors that may have contributed to injury risk, such as the injury history or training load particular to each athlete or injury-prevention programs implemented by coaching and training staff at each college. This study also did not account for differences in NCAA division level or environmental factors such as geography and associated climate.
In addition, injuries were compared by the athlete’s activity at the time of injury, as opposed to the T&F event in which he/she was participating. For instance, if an athlete who competes primarily in jumping events sustained an injury while sprinting, his/her injury may have been included in this analysis as a sprinting injury if the activity was recorded as such. Similarly, athletes competing in combined events such as the decathlon or heptathlon were not analyzed separately in this study; rather, their injury was included in whichever activity they were engaged in at the time of injury. Each athlete’s position was typically reported at the time of injury; however, the “runner” position category did not differentiate between sprinters and distance runners, and the position was more often a missing variable than the activity at the time of injury. Therefore, the activity at the time of injury as recorded by the reporting AT dictated the categories used for our analysis.
Last, since AE data were not specific to positions or activities, injury rates could not be calculated specifically for each individual T&F event. Thus, injury proportions were used to compare and provide information on the common types of injuries experienced in different events. As injury proportion cannot determine the risk of sustaining injuries or the cause of injuries, future investigations should aim to measure exposures specific to each T&F event to effectively compare injury risks between them and incorporate prospective designs to better understand causal factors responsible for the risk and proportions of injuries experienced between events.
Conclusion
The key findings from this study include a higher injury rate among women compared with men, higher injury rates during competitions compared with practices, and higher injury rates during the indoor season compared with the outdoor season. The hip and thigh were the most common body region injured in T&F; however, injury types can vary by T&F event due to the unique demands of each. This study provides an assessment of the frequency and risk of injury in collegiate T&F while highlighting differing injury patterns across T&F events. These findings from the NCAA ISP can help athletic administrators, coaches, athletes, and sports medicine professionals understand the risk and types of injuries in collegiate T&F, while also suggesting areas for future research and injury prevention.
Footnotes
Acknowledgment
This publication contains materials created, compiled, or produced by the Datalys Center for Sports Injury Research and Prevention on behalf of the NCAA. The NCAA ISP data were provided by the Datalys Center for Sports Injury Research and Prevention. The ISP was funded by the NCAA. The content of this manuscript is solely the responsibility of the authors and does not necessarily represent the official views of the Datalys Center or the NCAA. The authors thank the many athletic trainers who have volunteered their time and efforts to submit data to the NCAA ISP. Their efforts are greatly appreciated and have had a tremendously positive effect on the safety of collegiate athletes.
Final revision submitted September 13, 2021; accepted October 3, 2021.
The authors declared that there are no conflicts of interest in the authorship and publication of this contribution. AOSSM checks author disclosures against the Open Payments Database (OPD). AOSSM has not conducted an independent investigation on the OPD and disclaims any liability or responsibility relating thereto.
Ethical approval for this study was obtained from Anderson University.