
Abstract
Background:
The Lysholm knee score and Tegner activity scale are frequently used patient-reported outcome measures in patients with anterior cruciate ligament (ACL) injuries because of their excellent psychometric properties. These questionnaires were originally developed in the English language.
Purpose:
To translate and cross-culturally adapt these measures into the Indonesian language and study their validity and reliability so that they can be used in the Indonesian-speaking population with ACL injuries.
Study Design:
Cohort study (diagnosis/symptom prevalence); Level of evidence, 2.
Methods:
After a forward-backward translation procedure and cross-cultural adaptation, validity and reliability were investigated. A total of 253 patients with an ACL injury were sent 4 questionnaires (36-Item Short Form Health Survey, Kujala anterior knee pain scale, Indonesian Lysholm knee score [I-LK], and Indonesian Tegner activity scale [I-TS]). The responses of those patients were analyzed. Following COSMIN guidelines, construct validity, test-retest reliability, internal consistency, floor and ceiling effects, and measurement errors were determined. The Bland-Altman method was used to explore absolute agreement.
Results:
A total of 106 patients (42% response rate) were included in this study. Construct validity was considered to be good, as more than 75% of the predefined hypotheses on correlations between the I-LK, I-TS, and other measures were confirmed. Reliability proved excellent, with a high test-retest correlation for both questionnaires (intraclass correlation coefficient = 0.99). Bland-Altman analysis showed no systematic bias between testing and retesting. The internal consistency of the I-LK was good (Cronbach alpha = 0.73). For the I-LK and I-TS, floor and ceiling effects were less than 15% (floor: 0% and 4.7%, respectively; ceiling: 12.3% and 3.8%, respectively); the standard error of measurement was 1.8 and 0.9, respectively; the minimal detectable change at the individual level was 5.1 and 0.6, respectively; and the minimal detectable change at the group level was 2.4 and 0.5, respectively.
Conclusion:
Both the I-LK and I-TS appear to be good evaluation tools for Indonesian-speaking patients with an ACL injury.
In most countries, the annual incidence of anterior cruciate ligament (ACL) injuries is between 0.03% and 0.04%. 17 An ACL injury can be managed by either ACL reconstruction (ACLR), ACL repair, or nonoperative treatment. 21,22 The goal of these treatment options is to regain good functional stability of the knee so that patients can return to daily activities, work, and even sports. 15,22 To achieve this goal, the outcome of treatment should be monitored regularly. Patient-reported outcome measures (PROMs) are used to follow up on the patient’s recovery from the perspective of the patient. 28
The Lysholm knee score and Tegner activity scale are frequently used PROMs to assess ACL treatment outcomes. 4 The Lysholm knee score was developed to determine the functional status of the patient after ACL treatment. 24 The Tegner activity scale was developed as an extension of the Lysholm score and designed to assess activity levels based on work and sports activities. 4 Both have been translated and culturally adapted into many languages in different cultural settings, 9,18,29 but this has not yet been done for Indonesian-speaking patients, with a total population of 270 million. 6
Hence, the purpose of this article was to translate and cross-culturally adapt the English versions of the Lysholm knee score and Tegner activity scale into Indonesian versions as well as to study the validity and reliability of these questionnaires in patients with an ACL injury. We hypothesized that the Indonesian version of these PROMs would be both valid and reliable for use in the Indonesian-speaking population with ACL injuries.
Methods
Patients gave informed consent before participating in this study. The study was approved by a local institutional review board (B/008/UN 19.5.1.1.8/KEPKK/2020).
Translation Procedure
The English versions of the Lysholm knee score and Tegner activity scale were translated into Indonesian using the procedure of forward-backward translation as originally proposed by Guillemin et al 10 and revised by Beaton et al. 2 This procedure comprises the following steps: initial translation, translation synthesis, back translation, committee review, pretesting, and submission and appraisal of all written reports to the committee. The expert committee, consisting of 3 sports medicine orthopaedic surgeons (A.M.T.L., R.D., and M.P.), 1 methodological expert, and 1 translator, drafted the final Indonesian versions of the Lysholm knee score and Tegner activity scale, which were both pretested on 10 patients with an ACL injury. One of the researchers (R.D.) documented any difficulties that patients experienced while completing the questionnaires and then processed the questionnaires into their final versions.
Patients and Procedures
A total of 253 randomly selected patients were invited by email to take part in this study between April and July 2020. All were Indonesian patients treated for an ACL injury with ACLR between January 2015 and March 2020 at a hospital in Indonesia. We selected the patients from the data of the ACL member community, a nonprofit organization consisting of patients treated with ACLR in Indonesia. We used the systematic random sampling method by selecting a patient with odd registry numbers as samples. After giving informed consent, participants received 2 sets of questionnaires (parts A and B) by email. Part A was sent in the first week and included the Indonesian versions of the Lysholm knee score (I-LK), Tegner activity scale (I-TS), 36-Item Short Form Health Survey (SF-36), and Kujala anterior knee pain scale. Participants were asked to complete and immediately return the I-LK and I-TS again after 1 week to assess test-retest reliability. To determine whether health status and knee function remained stable between completion of both parts A and B, a global rating of change question to determine a change of status since filling out the previous questionnaire was provided. The 3 possible responses were (1) no; (2) yes, the problem shifted for the better; and (3) yes, the problem shifted for the worse. Participants who reported being much better or getting worse were excluded from test-retest reliability analysis; patients who returned both part A and part B questionnaires on the same day or more than 1 month apart were excluded as well.
Patient-Reported Outcome Measures
The Lysholm knee score is a region-specific PROM. It includes 8 questions and is designed to measure perceived symptoms and function in patients with a variety of knee conditions. Questions concern limping, locking, pain, stair climbing, use of support, instability, swelling, and squatting. The questionnaire is scored by summing the scores for the individual items and then transforming the score to a scale that ranges from 0 to 100, with 100 indicating an absence of symptoms and higher levels of functioning. 24
The Tegner activity scale is designed to assess activity levels based on work and sports activities. This scale consists of a numerical range from 0 to 10, and each value indicates the ability to perform specific activities, with the highest value indicating the best score. The Tegner activity scale was developed as an addition to the Lysholm knee score. 24
The Kujala anterior knee pain scale is a disease-specific outcome measure for patellofemoral disorders of the knee. It consists of 13 questions, with a total score ranging from 0 to 100 and the highest value indicating the best score. Questions are asked regarding whether there is pain while walking, squatting, running, or jumping or during prolonged sitting with the knee in flexion; whether there is limping, swelling, or subluxation of the patella; whether there is a need for a walking aid; and whether there is existing atrophy in the quadriceps muscle, flexion deficiency, or pain. 13
The SF-36 is a generic measure used to examine the quality of life. It consists of 8 components, including physical functioning, physical role functioning, bodily pain, general health perceptions, vitality, social functioning, emotional role functioning, and mental health. Standardized scores range from 0 to 100, with higher scores indicating a better health status. In addition, the sum of the physical functioning, physical role functioning, bodily pain, and general health perceptions subscales generates a physical component summary (PCS), while the sum of the vitality, social functioning, emotional role functioning, and mental health subscales generates a mental component summary (MCS). 27
Validity
Validity is the extent to which a scale measures what it is supposed to measure—that is, whether it has the intended interpretation. The construct validity of the I-LK and I-TS is measured by determining the correlation with other questionnaires. A total of 10 predefined hypotheses were formulated about the magnitude of the correlation between the I-LK, I-TS, each subscale of the SF-36, and Kujala scale following the COSMIN guidelines. 16 In the Turkish version of the I-LK, Celik et al 5 found a correlation of 0.74 with the Kujala scale, based on which the current study expected a correlation of 0.7 or higher for the I-LK with the Kujala scale, and a correlation of 0.4 or higher for the I-TS with the Kujala scale. The I-LK and I-TS were developed to measure physical functioning rather than social and/or emotional aspects; therefore, relatively low correlations were expected between the I-LK and I-TS with the MCS of the SF-36. On the other hand, relatively high correlations were expected between the I-LK and I-TS with the PCS of the SF-36. Swanenburg et al 23 found correlations of 0.60 between the Lysholm score and the PCS of the SF-12, 0.02 between the Lysholm score and the MCS of the SF-12, 0.69 between the Tegner scale and the PCS of the SF-12, and 0.06 between the Tegner scale and the MCS of the SF-12. Based on the correlations found in that study, we expected a correlation of 0.4 or higher between the I-LK and the PCS of the SF-36, 0.4 or lower between the I-LK and the MCS of the SF-36, 0.4 or higher between the I-TS and the PCS of the SF-36, and 0.4 or lower between the I-TS and the MCS of the SF-36. Construct validity is considered good when at least 75% of the hypotheses are confirmed. 25
Floor and Ceiling Effects
The occurrence of floor and ceiling effects was assessed. These effects are considered to be present if more than 15% of respondents achieve the lowest or highest possible score. 25
Reliability
Reliability represents the extent to which participants can be distinguished from each other, despite measurement errors. Internal consistency, test-retest reliability, and measurement errors were measured to determine reliability. The Bland-Altman method was used to assess absolute agreement, which reflects the amount of agreement in repeated measurements. 3
Statistical Analysis
The characteristics of the study population and scores on the questionnaires are described using means and standard deviations or frequencies and percentages. To assess construct validity, Pearson correlation coefficients—if the variable showed a normal distribution—were determined between the scores on the I-LK, I-TS, and other questionnaires. The Cronbach alpha was calculated to determine the internal consistency of the I-LK. 7 Values between 0.70 and 0.95 are considered to indicate good internal consistency. 25
The test-retest reliability of the I-LK and I-TS was determined by measuring the intraclass correlation coefficient (ICC). 16 Values <0.50, 0.50 to 0.74, 0.75 to 0.90, and >0.90 are indicative of poor, moderate, good, and excellent reliability, respectively. 12 The standard error of measurement (SEM) and minimal detectable change (MDC) were measured to determine measurement errors. The SEM was calculated by multiplying the pooled standard deviation by √(1 – r), where r is the ICC. 8 The formula 1.96 × SEM × √2 was used to measure the MDC at the individual level (MDCind) and at the group level (MDCgrp) by dividing MDCind by √n. 25
Bland-Altman plots were used to measure absolute reliability; no systematic bias was present when 0 was in the 95% CI of the mean difference between the first and second administration of the I-LK and I-TS. The formula mean difference ± 1.96 × SDdiff, where SDdiff is the standard deviation of the mean difference between the first and second administration of the I-LK and I-TS, was used to determine the 95% limits of agreement. 3 Statistical analyses were performed using SPSS Statistics Version 26.0 (IBM), with a level of significance set at 5%.
Results
Translation and Cross-Cultural Adaptation
There were some cultural adaptations during the procedure of translation. The word squatting in the Lysholm score was changed to squat during prayer, which is quite common among the Indonesian population. The words bandy, ice hockey, and cross country skiing in the Tegner scale were removed because these kinds of sports are not typical in Indonesia. The activity downhill skiing was changed to mountain biking, and we added taekwondo, volleyball, and the typical Indonesian sports sepak takraw (foot volleyball) and silat (a martial art).
Patient Characteristics
Of the 253 patients who were invited to participate, 106 (42%) responded and returned the first mailing of questionnaires. Of these 106 patients, 75 (70.8%) completed and returned the second mailing. None of the patients were excluded because of a change in functional status when they filled out the questionnaires the second time (as measured with the global rating of change question) or because of missing data. Hence, data of 106 patients were used for validity and internal consistency analyses, and data of 75 patients were used for test-retest reliability analysis. Most patients were male nonathletes with a mean age of 30.5 ± 9.2 years. The mean scores of the first and second assessments of the I-LK were 73.4 ± 18.5 and 73.3 ± 18.5, respectively, and of the I-TS were 4.7 ± 2.7 and 4.8 ± 2.7, respectively. Patient characteristics are described in detail in Table 1. Descriptive statistics of the PROMs can be found in Table 2.
Characteristics of the Study Participants a

a Data are reported as mean ± SD or n (%). ACL, anterior cruciate ligament.
PROM Scores a

a MCS, mental component summary; PCS, physical component summary; PROM, patient-reported outcome measure; SF-36, 36-Item Short Form Health Survey.
Validity
Of the 10 predefined hypotheses on the magnitude of the correlation between the I-LK, the I-TS, and either the Kujala scale or SF-36, 8 hypotheses were confirmed (total of 80%) (Table 3). The I-LK showed a strong correlation with the Kujala scale (r = 0.81) and with the PCS of the SF-36 (r = 0.66). The I-TS showed a moderate correlation with the Kujala scale (r = 0.47) and with the PCS of the SF-36 (r = 0.57). As expected, correlation coefficients between the I-TS and the MCS of the SF-36 were less than 0.4 (r = 0.33). Correlation coefficients between the I-LK and the MCS of the SF-36 were higher than expected (r > 0.62). The I-LK was more strongly related to the PCS than to the MCS of the SF-36 (r = 0.66 and r = 0.62, respectively) (Table 4). The floor and ceiling effects analysis revealed that minimal and maximal possible values were less than 15% of all values given (for I-LK and I-TS: floor: 0% and 4.7%, respectively; ceiling: 12.3% and 3.8%, respectively).
Predefined Hypothesized and Actual Correlation Between PROMs a

a I-LK, Indonesian Lysholm knee score; I-TS, Indonesian Tegner activity scale; MCS, mental component summary; PCS, physical component summary; PROM, patient-reported outcome measure; SF-36, 36-Item Short Form Health Survey.
b Hypothesis was confirmed.
Pearson Correlation Between PROMs a

a MCS, mental component summary; PCS, physical component summary; PROM, patient-reported outcome measure; SF-36, 36-Item Short Form Health Survey.
Internal Consistency
The Cronbach alpha of the I-LK was 0.73, indicating good internal consistency.
Test-Retest Reliability
Both the I-LK and I-TS had an ICC value of 0.99 (P < .001) between the test and retest scores, and the 95% CI ranged from 0.99 to 1.00.
Measurement Error
The SEM, MDCind, and MDCgrp of the I-LK were calculated to be 1.8, 5.1, and 0.6, respectively. Bland-Altman analysis revealed a mean difference between the 2 I-LK assessments of 0.1, with the 95% CI ranging from 4.0 to 4.2 (95% limit of agreement = 36.1-36.2) (Figure 1). No systematic bias was present because a value of 0 was in the 95% CI of the mean difference between the test and retest scores.
The SEM, MDCind, and MDCgrp of the I-TS were calculated to be 0.9, 4.3, and 0.5, respectively. Bland-Altman analysis revealed a mean difference between the 2 I-TS assessments of 0.01, with the 95% CI ranging from 5.09 to 5.11 (95% limit of agreement = 5.38-5.40) (Figure 2). No systematic bias was presented because a value of 0 was in the 95% CI of the mean difference between the test and retest scores.
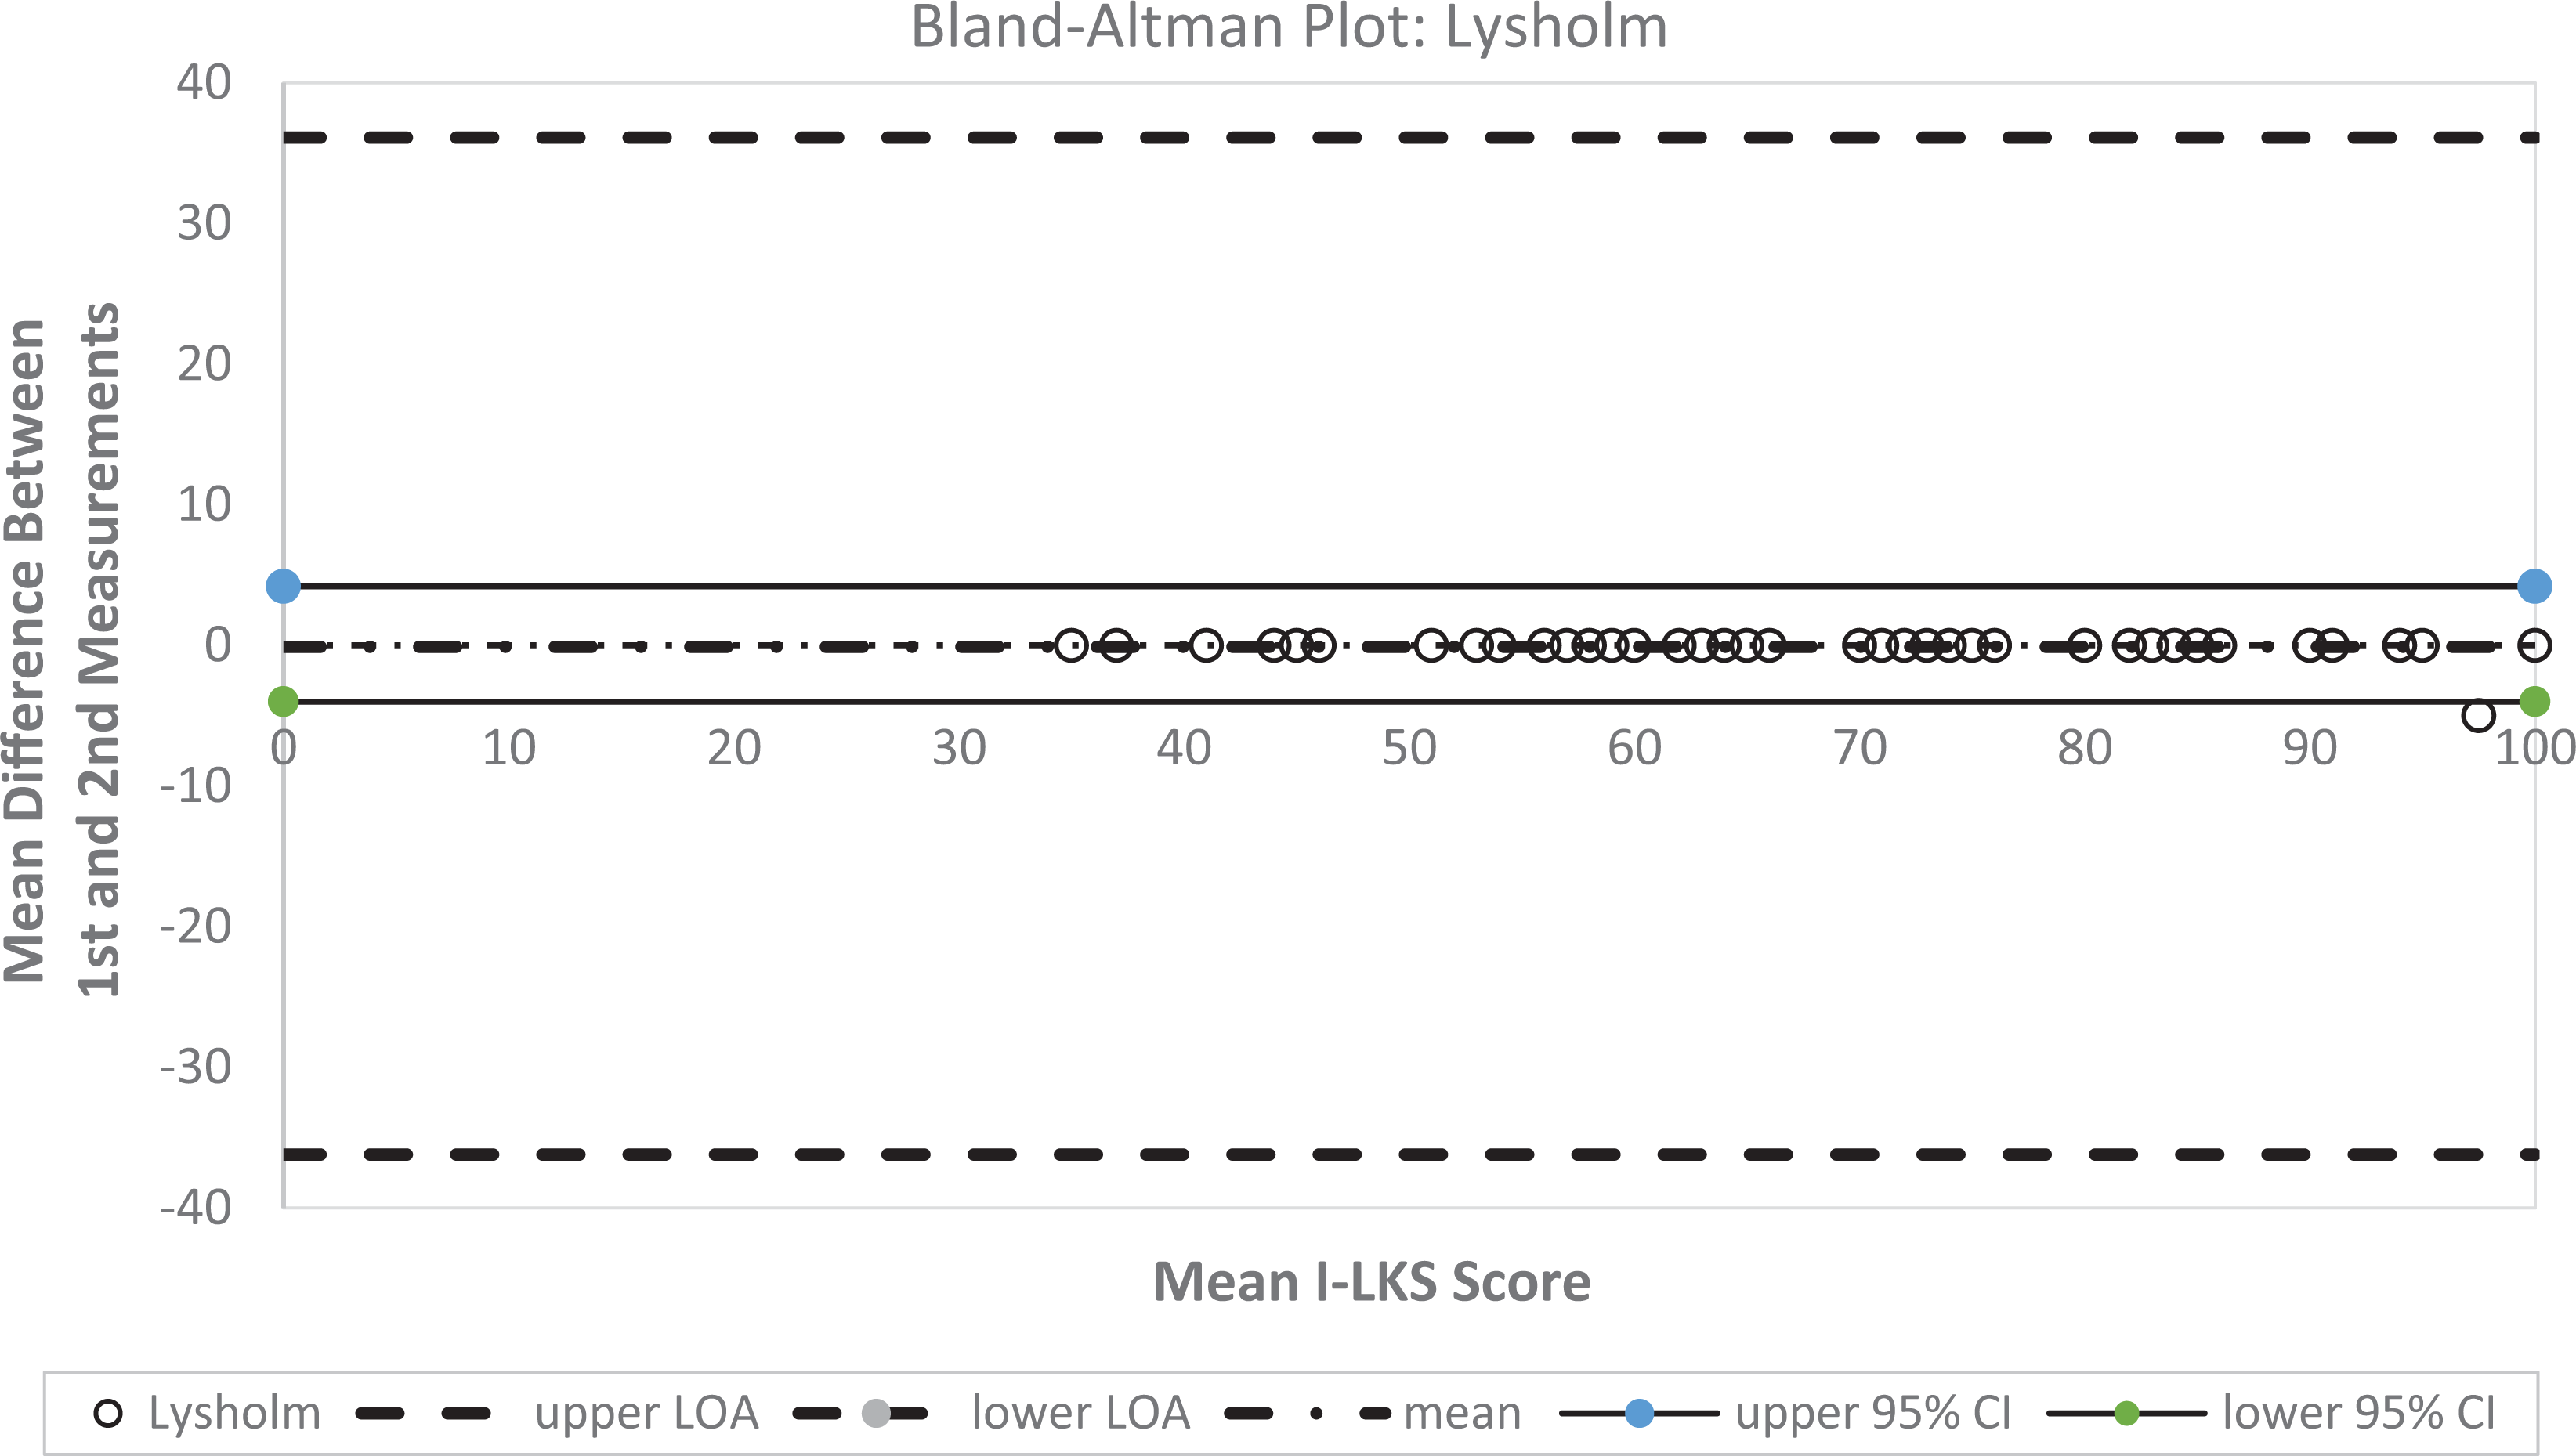
Bland-Altman plot of the Indonesian Lysholm knee score (I-LK), with the 2 dotted lines representing the 95% CI and the 2 dashed lines representing the limit of agreement (superior and inferior) and mean difference (intermediate).

Bland-Altman plot of the Indonesian Tegner activity scale (I-TS), with the 2 dotted lines representing the 95% CI and the 2 dashed lines representing the limit of agreement (superior and inferior) and mean difference (intermediate).
Discussion
This study aimed to translate both the Lysholm knee score and the Tegner activity scale into Indonesian and gain insight into the validity and reliability of those questionnaires in an Indonesian-speaking population with an ACL injury. Based on the results, both questionnaires can be considered valid and reliable for use in Indonesian patients after an ACL injury.
The construct validity of both the I-LK and I-TS can be considered good, with more than 75% of predefined hypotheses confirmed. As hypothesized, the I-LK showed a strong correlation with the Kujala scale (r = 0.81). This is comparable with the Turkish version (r = 0.78). 5 As hypothesized, the I-LK showed a strong correlation with the PCS of the SF-36 (r = 0.66). These results are in line with those of several other versions, such as the English (r = 0.68), 14 German (r = 0.60), 23 and Turkish (r = 0.57) language versions. 5 Although contrary to our hypothesis that the correlation of the I-TS with the Kujala scale was lower than that with the SF-36 PCS, both correlations were higher than 0.40, as hypothesized. The second finding contradicting our hypothesis was that the I-LK showed a correlation higher than 0.40 (r = 0.62), with the MCS of the SF-36. Still, the I-LK was more strongly correlated to the PCS than to the MCS of the SF-36, confirming our hypothesis. The correlation between the I-LK and the MCS of the SF-36 in this study was substantially higher than that found in other studies, for example, in the German (r = 0.02) 18 and Turkish (r = 0.14) 5 versions. We postulate that these results were obtained because of the characteristics of our sample—young athletes and active patients whose physical condition could have a substantial impact on their mental state. 19 The studies on the Turkish and German versions both included an older population of persons with various additional conditions such as knee osteoarthritis, patellofemoral pain, and meniscal lesions, which might explain the lower correlation between the I-LK and the MCS of the SF-36 compared to our study.
Other questionnaires such as the Hip and Knee Questionnaire, which was used in a Spanish Lysholm score study, 1 or the International Knee Documentation Committee subjective knee form, which was used in both a Dutch 9 and Chinese Lysholm score study, 26 could have been used to test construct validity. However, as no validated Indonesian translations are available for those questionnaires, we could not use them to study the construct validity of the I-LK and I-TS.
Further affirming the occurrence of floor and ceiling effects of the I-LK and I-TS, an acceptable level of floor and ceiling effects was found of less than 15%. 16 This is lower than those effects reported in previous studies of the English 4 and Dutch 9 versions, both reporting more than 30%. This result indicates good content validity of the I-LK and I-TS. Also, the internal consistency of the I-LK can be considered good, with a Cronbach alpha of 0.73. This is comparable with the Chinese (0.73), 26 Turkish (0.68), 5 Dutch (0.83), 9 German (0.73), 29 and English (0.73) 4 versions.
Both the I-LK and I-TS showed excellent test-retest reliability (ICC = 0.99). Although the ICC between the 2 assessments of the I-LK was higher than that found in some of the studies on other language versions such as the Turkish (ICC = 0.82) 17 and German (ICC = 0.87) 23 versions, similar correlations implicating excellent reliability were found for the English (ICC = 0.97), 11 Chinese (ICC = 0.93), 26 and Dutch (ICC = 0.93) 9 versions. The time period between the 2 assessments of the I-LK and I-TS may have possibly caused these differences in the ICC. According to COSMIN guidelines, the test-retest time interval should be long enough to prevent recall bias and short enough to ensure that patient characteristics have not changed regarding the construct to be measured. 16 A time interval of 2 weeks used in the Turkish version 5 may have caused the lower ICC value compared to the that found in our study using a 1-week interval.
The I-LK and I-TS indicated sufficient capability for group comparisons, as only small values are needed to detect change. The SEM of the I-LK was 1.8, the MDCind was 5.1, and the MDCgrp was 0.6. These values are comparable to those presented in the Dutch (SEM = 3.2; MDC = 8.9) 9 and German (SEM = 7.84; MDC = 21.72) 23 versions. Further, the SEM of the I-TS was 0.9, the MDCind was 4.3, and the MDCgrp was 0.5. These values also are comparable to those presented in the Dutch (SEM = 0.4; MDC = 1.2) 9 and German (SEM = 0.65; MDC = 1.80) 23 versions. As only values higher than the SEM can be distinguished from measurement errors, to detect a statistically significant change in scores on the I-LK and I-TS, the difference should be higher than the SEM. To distinguish from measurement errors and confirm that a real change occurred, the difference between 2 measurements should be greater than the MDCind value in individual patients. Given that the MDCind values are 5.1 and 4.3, respectively, it is questionable whether the I-LK and I-TS are appropriate tools for monitoring individual patients over time.
Limitations
There are some limitations to this study. The response rate was quite low (42%), but the total number of participants can be considered sufficient: According to COSMIN guidelines, at least 100 patients are needed to examine validity and 50 patients to examine test-retest reliability. 25 Another potential limitation is that we compared the I-LK and I-TS with only 1 other disease-specific questionnaire (Kujala scale) and a general health-related quality of life questionnaire (SF-36). However, no other validated Indonesian versions of a PROM are available to assess knee function or patients’ quality of life besides these scores.
Future research should explore the responsiveness of the I-LK and I-TS as well as the minimal important change (MIC). The MIC should be determined to explore whether a measured difference is also clinically important as perceived by the patient. 25 For the English versions, the reported MIC of the Lysholm knee score ranged from 3.7 to 9.2, 20 and the effect sizes for the Lysholm knee score and Tegner activity scale were 1.1 and 1.0, respectively, with standardized response means of 1.20 and 0.96, respectively. 4 These findings are not transferable to the Indonesian version, though, so the MIC, effect size, and standardized response mean of the I-LK and I-TS should be assessed in future research. Information on the responsiveness and capability of the I-LK and I-TS to detect change over time is required for these measures to be used in longitudinal research and in clinical practice to monitor Indonesian-speaking patients.
Conclusion
The I-LK and I-TS can both be considered valid and reliable questionnaires for use in Indonesian patients with an ACL injury. These questionnaires enable us to measure patient-perceived symptoms, function, and outcomes of treatment in the Indonesian population with ACL injuries. More research is needed into the MIC and responsiveness.
Footnotes
Acknowledgment
The authors extend their gratitude to all members of the Indonesian Orthopedic Society for Sport Medicine and Arthroscopy (IOSSMA) who participated in the study.
Final revision submitted August 26, 2021; accepted September 27, 2021.
The authors have declared that there are no conflicts of interest in the authorship and publication of this contribution. AOSSM checks author disclosures against the Open Payments Database (OPD). AOSSM has not conducted an independent investigation on the OPD and disclaims any liability or responsibility relating thereto.
Institutional Review Board Statement
Number: B/102/UN19.5.11.8/UEPKK/2020. Declared to be ethically appropriate in accordance to 7 (seven) WHO 2011 Standards, 1) Social Values, 2) Scientific Values, 3) Equitable Assessment and Benefits, 4) Risks, 5) Persuasion/Exploitation, 6) Confidentiality and Privacy, and 7) Informed Consent, referring to the 2016 CIOMS Guideline. This is as indicated by the fulfillment of the indicators of each standard.