
Abstract
Background:
Management of anterior shoulder instability (ASI) aims to reduce risk of future recurrence and prevent complications via nonoperative and surgical management. Machine learning may be able to reliably provide predictions to improve decision making for this condition.
Purpose:
To develop and internally validate a machine-learning model to predict the following outcomes after ASI: (1) recurrent instability, (2) progression to surgery, and (3) the development of symptomatic osteoarthritis (OA) over long-term follow-up.
Study Design:
Cohort study (prognosis); Level of evidence, 2.
Methods:
An established geographic database of >500,000 patients was used to identify 654 patients aged <40 years with an initial diagnosis of ASI between 1994 and 2016; the mean follow-up was 11.1 years. Medical records were reviewed to obtain patient information, and models were generated to predict the outcomes of interest. Five candidate algorithms were trained in the development of each of the models, as well as an additional ensemble of the algorithms. Performance of the algorithms was assessed using discrimination, calibration, and decision curve analysis.
Results:
Of the 654 included patients, 443 (67.7%) experienced multiple instability events, 228 (34.9%) underwent surgery, and 39 (5.9%) developed symptomatic OA. The ensemble gradient-boosted machines achieved the best performances based on discrimination (via area under the receiver operating characteristic curve [AUC]: AUCrecurrence = 0.86), AUCsurgery = 0.76, AUCOA = 0.78), calibration, decision curve analysis, and Brier score (Brierrecurrence = 0.138, Briersurgery = 0.185, BrierOA = 0.05). For demonstration purposes, models were integrated into a single web-based open-access application able to provide predictions and explanations for practitioners and researchers.
Conclusion:
After identification of key features, including time from initial instability, age at initial instability, sports involvement, and radiographic findings, machine-learning models were developed that effectively and reliably predicted recurrent instability, progression to surgery, and the development of OA in patients with ASI. After careful external validation, these models can be incorporated into open-access digital applications to inform patients, clinicians, and researchers regarding quantifiable risks of relevant outcomes in the clinic.
Keywords
Anterior shoulder instability (ASI) is a common cause of functional limitation in the young and athletic population, with a reported annual incidence as high as 169 per 100,000 person-years. 22 In addition, recurrent instability is common and can lead to long-term functional limitation and osteoarthritis. Some studies have reported recurrence rates as high as 74% in patients treated nonoperatively, 31 and others have demonstrated recurrent instability in up to 25% of younger patients after surgical stabilization. 16
It has been noted that multiple dislocations increase the risk of bone loss (of both the glenoid and humeral head), whereas the relationship between what is termed “critical” bone loss and a substantial increase in the risk of instability is almost a foregone conclusion. This, and subsequent instability arthropathy, is also a risk factor for the development of symptomatic osteoarthritis over the long term. 16 Multiple studies have evaluated risk factors for recurrent anterior instability after initial nonoperative management, with younger age, male sex, participation in contact sports, and presence of bone loss as some of the most significant risk factors. 34,36 Despite all of the important work that has been done on this topic, many studies evaluating risk factors for recurrence are hindered by relatively small numbers of patients, shorter follow-up, or inadequate analysis of risk factors in a collective fashion. 8,15
Machine learning is increasingly being used in medicine and orthopaedic surgery. It allows for creation of predictive models that, when properly developed and applied, can improve accuracy and better inform decision making for patients, physicians, and researchers. 3,10 Whereas traditional statistics are limited by certain predefined assumptions and may be susceptible to collinearity, machine learning has the versatility to model these relationships more accurately given sufficiently abundant samples. 14,37
There are 3 common questions patients and clinicians want to answer after an initial instability event: what is the risk for (1) recurrent instability episodes, (2) progression to surgery, and (3) developing arthritis in the future? A predictive model for these commonly asked clinical questions can be beneficial to both the surgeon and the patient by allowing patient-specific information to guide decision making while evaluating multiple factors that have previously been correlated with these outcomes. In addition, it will allow for delineation of high-risk patients who may benefit from earlier surgical intervention.
The purpose of this study was to develop and internally validate a machine-learning model to predict the following outcomes after ASI: (1) recurrent instability, (2) progression to surgery, and (3) the development of symptomatic osteoarthritis over long-term follow-up. We hypothesized that machine learning would allow for creation of customized risk-predictive tools for each of the 3 outcomes of interest with >70% discrimination.
Methods
Guidelines
The present analysis was performed adherent to the TRIPOD (Transparent Reporting of a multivariable prediction model for Individual Prognosis or Diagnosis) guidelines and the recommendations from "Guidelines for Developing and Reporting Machine Learning Models in Biomedical Research.” 6,17
Data Source
After receiving institutional review board approval, we identified patients who experienced ASI between January 1, 1994, and July 31, 2016, utilizing the Rochester Epidemiology Project (REP). The REP is an established geographic database of >500,000 patients with complete medical records of all residents in Olmsted County, Minnesota, and neighboring counties in southeast Minnesota and western Wisconsin in the United States. The REP has been described previously in detail, including resident health care between 1966 and the present day, independent of the treating institution, if residents interacted with a health care provider in the system. Patients were identified using the International Classification of Diseases, Revision 9, diagnosis codes for shoulder instability. Patient charts were reviewed individually in detail to confirm the diagnosis of ASI, defined as a documented clinical diagnosis of either dislocation or subluxation by a consulting physician. Inclusion criteria consisted of (1) patients with at least 1 ASI event, (2) patients aged <40 years at the time of initial instability (to avoid potential confounding by preexisting osteoarthritis or concurrent rotator cuff pathology), (3) patients with a minimum 2 years of follow-up, and (4) patients who gave consent for research. Patients with (1) multidirectional instability based on chart-reviewed diagnosis in the medical record or (2) posterior-only shoulder instability were excluded from the analysis.
Variables
Patient medical records were reviewed to obtain patient variables used for feature selection. These variables included age, sex, body mass index, type of sports participation (weights/contact, extreme, throwing, and overhead), clinically documented ligamentous laxity, clinical history of instability, radiographic findings, management, recurrent instability, and development of clinically symptomatic osteoarthritis. Recurrent instability was defined as at least 1 episode of repeat instability (dislocation or subluxation) documented by the treating physician after the initial consultation for shoulder instability. Recurrent instability was assessed for all patients regardless of choice of management. Patients were considered to have undergone an initial trial of nonoperative management if surgical intervention did not occur within 3 months of initial physician consultation and diagnosis of ASI. These patients were then considered to have progressed to surgery if they had an instability surgery after that initial 3-month trial of nonoperative treatment. Patients undergoing acute surgery without nonoperative treatment were also included. Baseline characteristics of patients undergoing acute surgery were compared with those of patients undergoing surgery after initial nonoperative management. Clinically symptomatic osteoarthritis was defined as the presence of progressive degenerative changes within the glenohumeral joint on radiograph, accompanied by pain that the treating physician attributed to the osteoarthritis.
Missing Data
Features with missing data were imputed to reduce bias and improve statistical robustness. 12 If a variable was considered important and missing in >30% of the study population, a complete case analysis was performed after exclusion of incomplete cases. The missForest multiple imputation method was used to impute remaining variables with <30% missing data, 13,28,29 variables in the dataset were assumed to be missing-at-random (MAR) based on epidemiological convention, 18,23 although multiple imputation is equipped to handle data either missing completely at random (MCAR) or missing not at random (MNAR). 33 A list of features with number of missing cases is provided in Table 1. Specifically, modeling for recurrence was performed using complete case analysis.
Baseline Characteristics of Study Population (N = 654) a

a IQR, interquartile range. -, no missing data.
b Powerlifting, Olympic weightlifting, CrossFit, bodybuilding.
c Skateboarding, snowboarding, skiing, motocross, mountain biking.
d Recurrent pain was defined as pain without recurrent instability prior to surgical intervention.
Outcome and Analysis
The primary outcomes of interest were recurrence, progression to surgical treatment after an initial trial of nonoperative management, and development of symptomatic osteoarthritis. Each outcome was dichotomized into a binary variable and entered as the output into a supervised classification problem. After imputation for missing data, variables that were highly collinear within the feature set (defined as Spearman correlation coefficient >0.5) were identified, and the variable that contributed least to the model predictive performance was excluded. In addition, performance of a soft tissue Bankart procedure was excluded from the model for surgery, as it was completely predictive of the outcome of interest. The models to predict recurrent instability were generated at time of initial consult, when it is not known definitively if the patient will have recurrent instability. Notably, we did not explicitly exclude outcome variables of 1 model as input features in other models; therefore, recurrence was considered as an input feature in the model for progression to surgery, and whether patients underwent surgical treatment was considered an input feature in the model for development of symptomatic osteoarthritis.
Feature selection using recursive feature elimination with random forest and naïve Bayes algorithms was used to select the collection of input features that most optimally discriminated between achievement of each outcome on cross-validation. After feature selection, modeling was performed using the selected features with each of the following candidate machine-learning algorithms: extreme gradient boosted machine (XGBoost), support vector machines (SVM) with radial kernel, random forest, elastic net penalized regression, and a gradient-boosted ensemble of the candidate algorithms. A generalized linear model (GLM), otherwise known as logistic regression, was performed as a benchmark for predictive performance.
Modeling
Models were trained and validated via 0.632 bootstrapping with 1000 resampled datasets. In brief, model evaluation consists of reiterative partitions of the complete dataset into training and test sets. For each combination of training and test set, the model was trained on the training set using 10-fold cross-validation repeated 3 times. The performance of this model was then evaluated on the respective test set, and no data points from the training set were included in the test set. This sequence of steps was then repeated for 999 more data partitions. The model was thus trained and tested on all datapoints available, and evaluation metrics were summarized with standard distributions of values. 24 Bootstrapping has been found to optimize both model bias and variance and to improve overall performance compared with internal validation via splitting the data into training and holdout sets. 30 The optimal model was chosen based on area under the receiver operating characteristic curve (AUC). Models were compared by discrimination, calibration, and Brier score values.
Discriminative power was assessed via the AUC. Based on the work of Hosmer and Lemeshow 11 , an AUC of 0.70 to 0.80 was considered acceptable, and an AUC of 0.80 to 0.90 was considered excellent. Calibration of the model’s predicted probabilities as a function of observed frequencies within the test population was summarized in a calibration plot, in which an ideal model is a straight line with intercept 0 and slope of 1 (ie, perfect concordance of model predictions to observed frequencies within the retrospective data). Finally, the mean squared difference between predicted probabilities of models and observed outcomes, known as the Brier score, was calculated for each candidate model. The Brier score of candidate algorithms was then assessed using comparison with the Brier score of the null model, which is a model that assigns a class probability equal to the sample prevalence of the outcome for every prediction.
Decision curve analysis was used to determine the benefit of implementing the predictive algorithm in practice. The curve plots net benefit against the predicted probabilities of each outcome and provides a cost-benefit ratio for every value of the predicted probability. These ratios provide useful guidance for individualized decision making and account for variability in clinician and patient thresholds for what is considered high risk. In addition, decision curves for the default strategies of changing management for no patients or all patients were plotted for comparison purposes. A decision-curve analysis comparing a learned multivariate logistic regression model using the same parameters and inputs was also performed. Logistic regressions are used frequently to produce statistical models in orthopaedic research for classification problems and are a good benchmark for assessing the usefulness of the models produced here.
Both global and local model interpretability and explanations are provided. The global model variable importance plot demonstrates variable importance normalized against the input considered most contributory to the model predictive power. Local explanations for model behavior are provided for transparency into each individual output using local-interpretable model-agnostic explanations (LIME). The explanation algorithm generates optimized fits based on an established distance measure for the predicted probabilities of each outcome label based on the values of both categorical and continuous input, which can be visualized. 9,25
Digital Application
The candidate algorithm with the best performance was integrated into an interactive, open-access, educational application to demonstrate model outputs. Clinician input can be used to generate outcome predictions with accompanying explanations. All data analysis was performed via R 4.0.2 using RStudio version 1.2.5001 (RStudio).
Results
Variable Breakdown
A total of 654 patients were included in the study after application of exclusion criteria. The median age of the cohort was 21.7 years (interquartile range [IQR], 17.0-29 years), and 154 (23.5%) patients were female. The full breakdown of variables available for feature selection is provided in Table 1. Mean follow-up was 11.1 years (range, 2.0-25.2 years), and the median age at final follow-up was 34 years (IQR, 26-41 years). The median age at final follow-up for patients with symptomatic osteoarthritis was 44.2 years (IQR, 35-51 years).
Among the cohort, 443 patients (67.7%) experienced recurrent instability after diagnosis, 228 (34.9%) underwent surgical management, and 39 (5.96%) developed symptomatic osteoarthritis. Of the 228 surgically treated patients, 43 underwent surgery after a single instability event, while the remaining surgically treated patients had recurrent instability events. When comparing patients who underwent acute surgery (n = 131) with those who underwent surgery after initial nonoperative management (n = 97), we found that recurrent pain events, defined as pain without recurrent instability, were more prevalent in the group in which nonoperative management failed (82.5% vs 41.3%; P < .001), and bony Bankart lesions were more prevalent in the acute surgical group (9.2% vs 1%, P = .02) (Appendix Table A1). A total of 17 (12.98%) patients who elected for acute stabilization had a recurrent instability event before surgery, while 8 (8.2%) in the initial nonoperative group experienced a recurrent instability event within the first 3 months; these differences were not significant (P = .26). For missing variables, multiple imputation was used to produce models for osteoarthritis and surgery, while complete case analysis was performed to model for recurrence.
After recursive feature elimination using the random forest algorithm, 2 variables were identified to contribute significantly to the performance of all models: increased time from initial instability to diagnosis and younger age at initial instability. In addition, models important in predicting recurrent instability included pain after diagnosis and participation in contact sports; those important in predicting progression to surgical treatment included younger age at time of diagnosis and recurrent instability. Models for predicting development of glenohumeral osteoarthritis included younger age at diagnosis and total number of instability events. Full plots of global importance of the input variables used for training are provided in Figure 1.

Relative variable importance for (A) recurrent instability, (B) progression to surgery, and (C) development of osteoarthritis. The plot demonstrates the statistical significance of each variable in the data with respect to its effect on the generated model, as measured on a unitless scale of 0 to 100. A variable with an importance of 0 contributes nothing to the predictions of the model and can be discarded from the set of predictors. PT, physical therapy; XR, radiograph.
Model Performance
After model optimization, the candidate model performances on internal validation were compared. Training discrimination as measured via the apparent AUC ranged from 0.748 to 0.997 (recurrence: 0.853-0.994; surgery 0.748-0.990; osteoarthritis: 0.852-0.997). Testing discrimination as measured using internal validation via bootstrapping ranged from 0.689 to 0.861 (recurrence: 0.823-0.861; surgery 0.689-0.760; osteoarthritis: 0.692-0.768). The calibration plot slope ranged from 0.884 to 1.047 (recurrence: 0.96-0.99; surgery 0.978-0.997; osteoarthritis: 0.884-0.997). The calibration plot intercept ranged from -0.003 to 0.024 (recurrence: 0.002 to 0.024; surgery 0.002 to 0.011; osteoarthritis: -0.003 to 0.007). The null model Brier scores for recurrence, surgery, and osteoarthritis were 0.352, 0.327, and 0.312, respectively. Trained models had Brier scores that ranged from 0.05 to 0.21 (recurrence: 0.14-0.201; surgery 0.185-0.21; osteoarthritis: 0.05-0.16).
Overall, the gradient-boosted ensemble machine demonstrated the best performance on generating predictions for recurrence (AUC, 0.86), progressing to surgery (AUC, 0.76), and development of osteoarthritis (AUC, 0.78) (Figure 2) as well as the lowest Brier scores (recurrence, 0.138; surgery, 0.185; osteoarthritis, 0.05) (Tables 2 -4). All models were appropriately calibrated (Tables 2 -4 and Figure 3). Patient-level examples of input variable values and output probabilities to illustrate how model predictions respond to changes in modifiable and nonmodifiable risk factors from the final selected models are provided in Table 5.
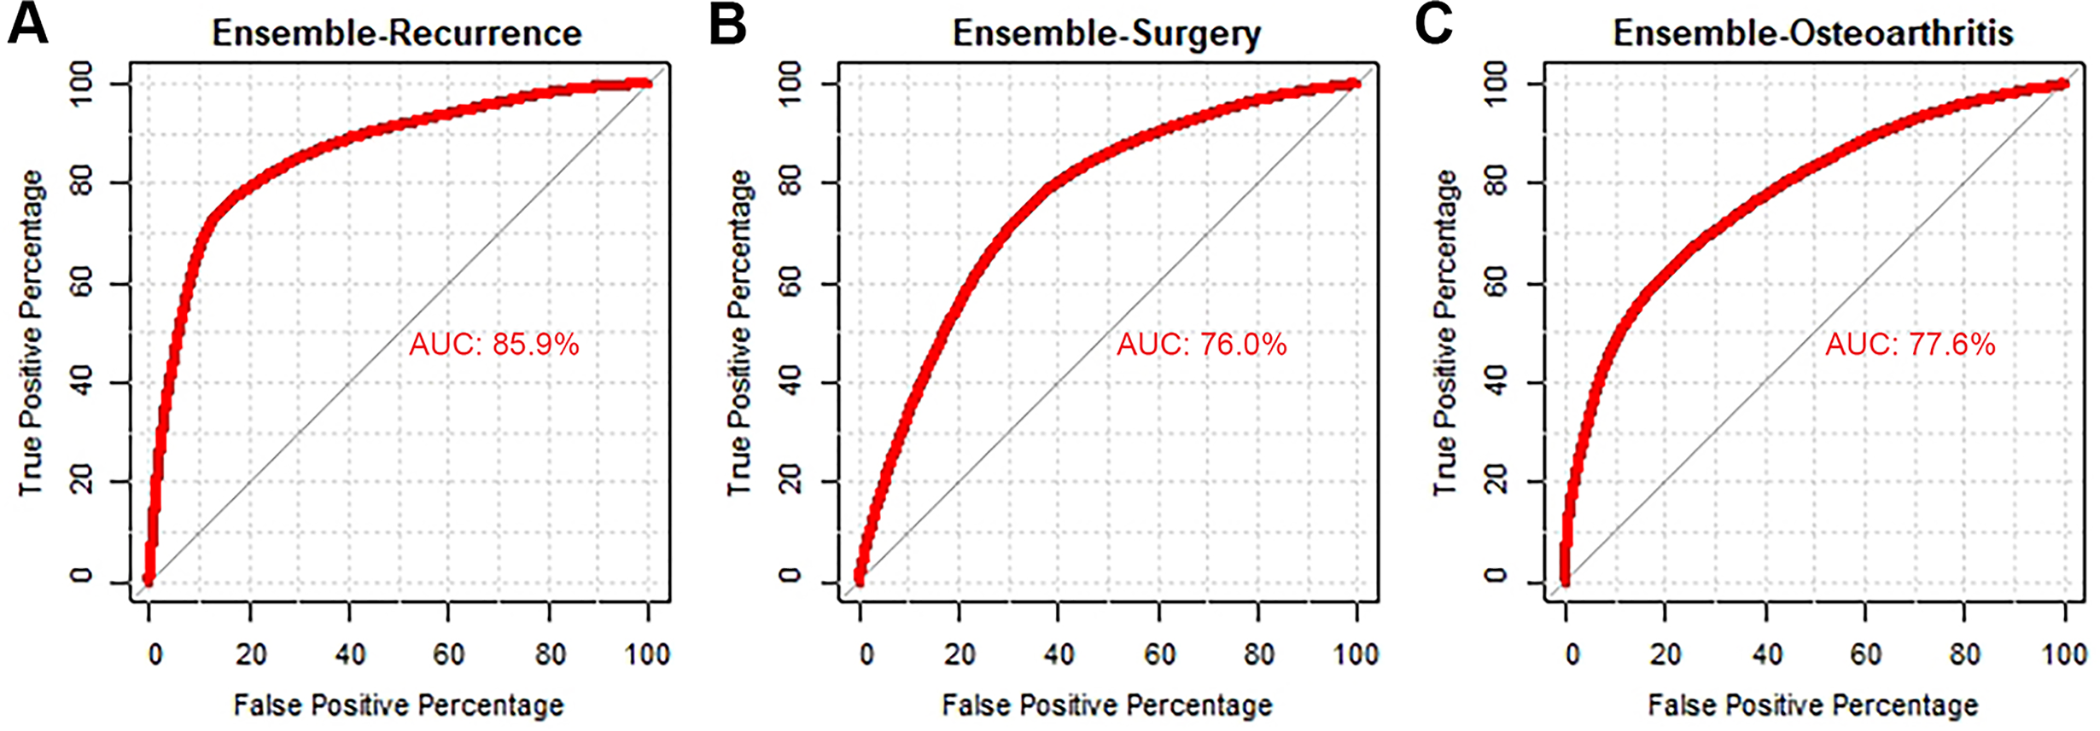
Discrimination of candidate algorithms for (A) recurrent instability, (B) progression to surgery, and (C) development of osteoarthritis. AUC, area under the curve.
Assessment of Model for Recurrence on Internal Validation Using 0.632 Bootstrapping With 1000 Resampled Datasets (n = 437) a

a Data in parentheses indicate 95% confidence interval. Null model Brier score = 0.352. AUC, area under the receiver operating characteristic curve; GLM, generalized linear model; SVM, support vector machines; XGBoost, extreme gradient boosted machine.
Assessment of Model for Surgery on Internal Validation Using 0.632 Bootstrapping With 1000 Resampled Datasets (n = 654) a

a Data in parentheses indicate 95% confidence interval. Null model Brier score = 0.327. AUC, area under the receiver operating characteristic curve; GLM, generalized linear model; SVM, support vector machines; XGBoost, extreme gradient boosted machine.
Assessment of Model for Osteoarthritis on Internal Validation Using 0.632 Bootstrapping With 1000 Resampled Datasets (n = 654) a

a Data in parentheses indicate 95% confidence interval. Null model Brier score = 0.312. AUC, area under the receiver operating characteristic curve; GLM: generalized linear model; SVM: support vector machines; XGBoost, extreme gradient boosted machine.

Calibration of the ensemble models for (A) recurrent instability, (B) progression to surgery, and (C) development of osteoarthritis.
Example Patient Input and Output Probabilities a

a Baseline inputs from patient’s initial clinic encounter can be used to predict recurrence; additional inputs required for prediction of progression to surgery and symptomatic osteoarthritis can be provided based on the evolution of management.
Decision Curve Analysis
Decision curve analysis was used to compare the net benefit derived from the trained ensemble algorithms against the default practices of changing management for all patients or no patients. For comparison purposes, a decision curve was also plotted for a learned multivariate logistic regression model trained using the same parameters and inputs. The ensemble trained on the complete feature set demonstrated greater net benefit compared with all 3 alternatives (Figure 4).
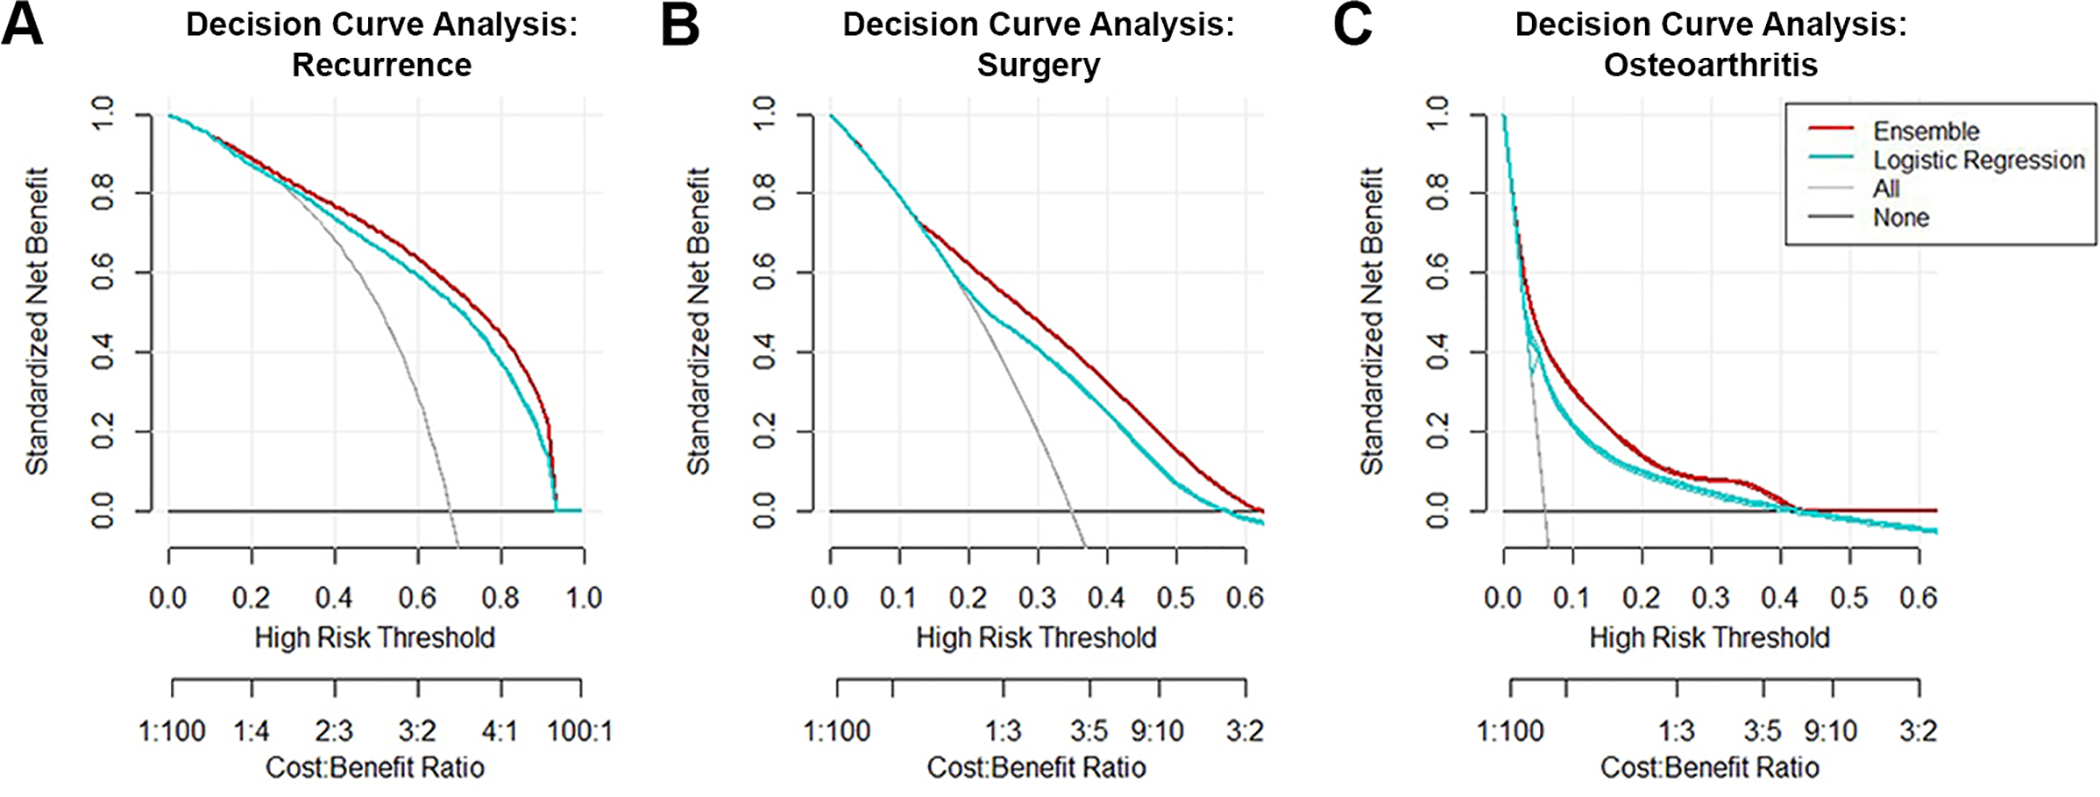
Decision curve analysis of the ensemble algorithm for (A) recurrent instability, (B) progression to surgery, and (C) development of osteoarthritis. The downsloping line for “All” represents the net benefit from the default strategy of changing management for all patients, while the horizontal line marked “None” represents the strategy of changing management for none of the patients (net benefit is zero at all thresholds). The “All” line slopes down because, at a threshold of zero, false positives are given no weight relative to true positives; as the threshold increases, false positives gain increased weight relative to true positives, and the net benefit for the default strategy of changing management for all patients decreases. A decision curve for a logistic regression model using the same predictors and patient sample is plotted for comparison.
Interpretation
An example of a patient-level explanation accompanying predicted probability of the outcome of interest generated by the digital application is provided in Figure 5. This patient was assigned a probability of 0.96 for having recurrence after a first instability event. Features that supported this prediction included increased amount of time since initial instability, younger age at first instability, and a Hill-Sachs lesion on baseline radiograph; features that did not support this prediction included lack of recurrent pain event after diagnosis, presenting instability due to acute trauma, and lack of involvement in contact sports. Additional samples of patient inputs and corresponding output probabilities for each respective outcome are provided in Table 5. For each example patient, baseline parameters collected during the initial clinical encounter were used to generate predictions regarding risk of recurrence. Once these predictions have been utilized to inform counseling, additional inputs required to predict progression to surgery and development of symptomatic osteoarthritis can be provided based on the management and clinical course of the patient after shared decision making. The final model is incorporated into a web-based digital application that generates predictions of all 3 outcomes from a single set of inputs. The application is accessible on desktops, tablets, and smartphones and can be found at http://rtools.mayo.edu/asi. Default values are provided as placeholders in the interface, and the model requires complete cases to generate predictions and explanations.

Example of individual patient-level explanation for random forest algorithm predictions. This patient had a predicted probability of recurrent instability of 96%. Feature values that support recurrence were length of time from initial instability to diagnosis, young age at initial instability, Hill-Sachs lesion on baseline XR, and male sex. Feature values that contradict recurrence are lack of recurrent pain involvement, absence of a bony Bankart lesion on baseline XR, and instability from acute trauma leading to presentation. XR, radiograph.
Discussion
The principal findings of the current study included the following: the gradient-boosted ensemble algorithm developed and internally validated in a cohort of patients with ASI predicted recurrence after initial event with good concordance and excellent reliability and predicted need for surgery and risk of developing glenohumeral arthritis with acceptable concordance and good reliability. The 2 most common important features determined to influence the 3 outcomes were time from initial instability and age at initial instability, while sports involvement and radiographic findings also played a role. The clinical applications of machine learning were highlighted via deployment of an open-source demonstration application to evaluate clinical outlooks of patients with ASI in real time, and prospectively collected inputs and predictions can be utilized for external validation of the model.
Several of the predictive factors in our models have support in the literature, including sex, age at initial stability, sports involvement, and various radiographic findings. 1,2,7,15,20,32 In a landmark 2007 study, Balg and Boileau 2 developed the Instability Severity Index Score, 10-point preoperative criteria that sought to determine risk of recurrence after surgery. Those authors identified the following risk factors to significantly predict failure of arthroscopic Bankart repair: age <20 years at the time of surgery, involvement in competitive or contact sports or forced overhead activity, shoulder hyperlaxity, a Hill-Sachs lesion, and/or loss of the inferior glenoid contour on radiograph. In a series of surgically treated patients, Lee et al 15 found time from first dislocation to surgery significantly predicted recurrence after labral stabilization, supporting our finding that time to diagnosis and, in turn, intervention may be among the multifactorial contributors to recurrence. In addition, the authors highlighted a significant increase in the number of preoperative dislocations among patients whose ASI recurred, while total number of instability events was identified as a significant input for both the surgery and osteoarthritis models in the present study. A review by Olds et al 20 evaluated recurrence in patients with traumatic anterior instability and highlighted an extensive amount of literature supporting a predisposition to recurrence in males; these authors also concluded age at initial dislocation and time from initial dislocation were important predictors.
In addition to the aforementioned Instability Severity Index Score, multiple tools have been developed to either diagnose or describe the clinical outlook of patients after ASI, from single predictors or scoring criteria such as the Hill-Sachs interval to glenoid track ratio and the Western Ontario Shoulder Instability Index (WOSI) 4,5 and to more complex models utilizing multivariate regressions or Markov decision trees, 21 and these have demonstrated varying degrees of effectiveness. The Instability Severity Index Score has been validated extensively in the literature 19,27 ; however, few investigations have assessed discrimination or calibration, and its predictive power at the individual patient level remains unclear. Similarly, Yian et al 35 produced a model to predict recurrent instability after primary arthroscopic repair, with a reported AUC of 0.82 when the scoring criterion was applied to the training cohort. However, no internal or external validation of the model was reported. While these respective studies provide salient insights, they also highlight several limitations of predictive modeling in the existing literature, namely the lack of standardized performance metrics or the reporting of an internal validation process.
The present study sought to mitigate these concerns via strict adherence to published guidelines. Concurrently, the models demonstrated moderate-to-good performance in all metrics. Finally, the open-source application has the unique advantage of providing comprehensive predictions and explanations regarding the 3 primary outcomes of interest after ASI to interested physicians and researchers. Pending external validation, this tool may be utilized to augment patient counseling with quantifiable risk at the surgeon’s discretion.
The strengths of this study should be interpreted in concert with its limitations. To preserve the utility of this model as a preoperative prediction tool at the first patient encounter, when he or she has not yet undergone surgery, we did not incorporate type of surgery as a variable into the model for development of osteoarthritis or recurrence. However, this information warrants consideration in a future model specifically targeting recurrence after surgery. Furthermore, while follow-up was a minimum of 2 years, patients who relocated out of the geographical region could have had recurrences or development of osteoarthritis that was not documented. We did not weigh surgical complications in the development of osteoarthritis and recurrence. Likewise, ability to return to sports, which can be an important contributor to these outcomes, was also not documented. Finally, analysis regarding the outcome of symptomatic osteoarthritis may have been limited in 2 regards: first, while patients with symptomatic osteoarthritis all had shoulder pain with confirmed radiographic osteoarthritis, follow-up radiographs for the entire cohort was 45% (n = 292), which could have led to an underestimation of the percentage of patients with true osteoarthritis who may go on to develop symptoms; second, although 80% of these radiographs were collected using standardized views and protocol at the same academic tertiary referral center, the rest were performed locally at other centers, and there may be interhospital variations in image quality. The current algorithm was developed from patients in a single geographical location. The sampling was limited, the data were retrospective, and the model would benefit from external validation in other cohorts as well as prospective validation using real-time data. 26 Likewise, the application developed is for educational purposes and represents only potential future utility until validated in a clinical setting. Although the current study demonstrated good predictive performance and reliability, the predictive ability may improve with additional data. Another potential limitation may be attributed to the differences in presenting characteristics seen between the acute surgical group of patients and patients undergoing surgery after initial nonoperative management. Although present, the variables with differences were entered into the algorithm, thereby accounting for any confounding. In addition, although our follow-up was long enough to capture a significant number of recurrent instability events, it may not have been long enough to capture progression to osteoarthritis. In the case of athletes with ASI, the decision to finish the season may have prolonged the time to surgical intervention and thus been considered as a trial of nonoperative management. Finally, complete case analysis was performed to develop the recurrence model because of missingness of >30% in a variable; however, we compared this model with the model developed using multiple imputation and found no differences in any performance metrics.
Conclusion
After identification of key features, including time from initial instability, age at initial instability, sports involvement, and radiographic findings, machine-learning models were developed that effectively and reliably predicted recurrent instability, progression to surgery, and the development of osteoarthritis in patients with ASI. After careful external validation, these models can be incorporated into open-access digital applications to inform patients, clinicians, and researchers regarding quantifiable risks of relevant outcomes in the clinic.
Footnotes
Final revision submitted July 15, 2021; accepted August 2, 2021.
One or more of the authors has declared the following potential conflict of interest or source of funding: Support was received from the Foderaro-Quattrone Musculoskeletal-Orthopaedic Surgery Research Innovation Fund. This study was partially funded by the National Institute of Arthritis and Musculoskeletal and Skin Diseases for the Musculoskeletal Research Training Program (T32AR56950). Its contents are solely the responsibility of the authors and do not necessarily represent the official views of the NIH. A.P. has received hospitality payments from Medical Device Business Services. A.J.K. has received research support from Aesculap/B.Braun, the Arthritis Foundation, Ceterix, Exactech, Gemini Medical, and Histogenics; consulting fees from Arthrex, DePuy, JRF, Musculoskeletal Transplant Foundation, Responsive Arthroscopy, and Vericel; speaking fees from Arthrex and Musculoskeletal Transplant Foundation; royalties from Arthrex; and honoraria from Vericel and JRF. C.L.C. has received education payments from Arthrex, nonconsulting fees from Arthrex, and hospitality payments from Stryker and Zimmer Biomet. AOSSM checks author disclosures against the Open Payments Database (OPD). AOSSM has not conducted an independent investigation on the OPD and disclaims any liability or responsibility relating thereto.
Ethical approval for this study was obtained from the Mayo Clinic (ref No. PR16-007084-01) and Olmsted Medical Center (ref. No. 042-OMC-16).
APPENDIX
Comparison of Characteristics Between Patients With Single-Instability and Multi-Instability Who Underwent Surgical Stabilization a

| Median (IQR)/n (%) | |||
|---|---|---|---|
| Variable | Acute Surgery, n=131 | Failed Nonop, n=97 | P |
| Characteristics and clinical history | |||
| Age at consult diagnosis | 22 (18-29) | 19 (17-27) | .679 |
| Female sex | 10 (23.3) | 34 (18.4) | .741 |
| Time from initial instability, mo | 2.5 (0.2-26) | 17 (3-55) |
|
| Age at initial instability | 19 (16-26) | 18 (16-22) | .06 |
| Total No. of events before diagnosis | 2 (1-5) | 4 (1-5) |
|
| Laterality | .449 | ||
| Bilateral | 3 (2.3) | 5 (5.2) | |
| Left | 61 (46.6) | 47 (48.5) | |
| Right | 67 (51.1) | 45 (46.4) | |
| Presenting instability secondary to acute trauma | 120 (91.6) | 89 (91.8) | >.99 |
| Sports involvement | .791 | ||
| Contact/Weights | 61 (46.6) | 48 (49.5) | |
| Extreme | 7 (5.3) | 4 (4.1) | |
| None | 34 (26.0) | 29 (29.9) | |
| Overhead | 16 (12.2) | 10 (10.3) | |
| Throwing | 13 (9.9) | 6 (6.2) | |
| Habitual/voluntary subluxations | 20 (15.3) | 6 (6.2) | .055 |
| Radiographic findings | |||
| Arthritis on baseline XR | 4 (3.1) | 0 (0.0) | .22 |
| Hill Sachs lesion on baseline XR | 36 (27.5) | 28 (28.9) | .935 |
| Bony Bankart on baseline XR | 12 (9.2) | 1 (1.0) |
|
| Outcomes and management | |||
| Formal physical therapy | 89 (67.9) | 78 (80.4) | .051 |
| Recurrent pain event after diagnosis | 54 (41.3) | 80 (82.5) |
|
| Soft tissue Bankart repair | 96 (73.3) | 80 (82.5) | .14 |
a Bolded P values indicate statistically significant between-group differences (P < .05). Nonop, nonoperative.