
Abstract
Background:
Nonanatomic placement of anterior cruciate ligament (ACL) grafts is a leading cause of ACL graft failure. Three-dimensional (3D) magnetic resonance imaging (MRI) femoral footprint localization could enhance planning for an ACL graft's position.
Purpose:
To determine the intra- and interobserver reliability of measurements of the ACL femoral footprint position and size obtained from 3D MRI scans.
Study Design:
Cohort study; Level of evidence, 3.
Methods:
A total of 41 patients with complete ACL tears were recruited between November 2014 and May 2016. Preoperatively, a coronal-oblique proton-density fast spin echo 3D acquisition of the contralateral uninjured knee was obtained along the plane of the ACL using a 1.5T MRI scanner. ACL footprint parameters were obtained independently by 2 musculoskeletal radiologists (observers A and B). The distal and anterior positions of the center of the footprint were measured relative to the apex of the deep cartilage at the posteromedial aspect of the lateral femoral condyle, and the surface area of the ACL femoral footprint was approximated from multiplanar reformatted images. After 1 month, the measurements were repeated. Intraclass correlation coefficients (ICCs) were calculated to assess for intra- and interobserver reliability. Bland-Altman plots were produced to screen for potential systematic bias in measurement and to calculate limits of agreement.
Results:
The ICCs for intraobserver reliability of the ACL femoral distal and anterior footprint coordinates were 0.75 and 0.78, respectively, for observer A. For observer B, they were 0.75 and 0.74, respectively. The ICCs for interobserver reliability were 0.75 and 0.85 for the distal and anterior coordinates, respectively. Bland-Altman plots demonstrated no significant systematic bias. For surface area measurements, the intraobserver ICCs were 0.37 and 0.62 for observers A and B, respectively. The interobserver reliability was 0.60. Observer B consistently measured the footprints as slightly larger versus observer A (1.19 ± 0.27 vs 1 ± 0.22 cm2, respectively; P < .001).
Conclusion:
Locating the center of the anatomic footprint of the ACL with 3D MRI showed substantial intra- and interobserver agreement. Interobserver agreement for the femoral footprint surface area was fair to moderate.
In 2006, almost 130,000 anterior cruciate ligament (ACL) reconstruction surgical procedures were performed in the United States, a 37% increase from a decade prior. 19 With the attendant rise in the number of procedures performed, growing numbers of patients are experiencing graft failure and subsequent reoperation. 11,17 This phenomenon has led to increasing interest in identifying correctable causal factors that contribute to graft failure. 16,21,22,36
In studies by the Multicenter ACL Revision Study group, the surgical technique was found to be the second most common cause (after trauma) of graft failure. 23,38 In 80% of those cases, failure was attributed to improper ACL femoral graft placement. Another analysis found that inadequate femoral tunnel placement was the most important predictor of revision surgery, accounting for almost 50% of cases. 26
There is consensus that precise anatomic placement of the ACL femoral graft is of paramount importance in restoring the function and stability of the injured knee. 2 –4,17,23,24 However, it is also well established that conventional arthroscopic methods of femoral graft localization are lacking with respect to accuracy. 6,13,25,30,37
Recent work has focused on the anatomic reconstruction of the femoral footprint using preoperative imaging as a guide, with various groups utilizing magnetic resonance imaging (MRI) and computed tomography (CT) for femoral footprint characterization. 1,4,5,7,12,20,33 In particular, it has previously been demonstrated, using 3-dimensional (3D) MRI, that ACL graft placement at least partially overlaps the true ACL footprint 67% of the time. 10 It has also been shown that 3D MRI identification of the ACL footprint compares favorably and can be used interchangeably with anatomic identification on cadaveric ACLs. 7
Clear delineation of what specifically construes the ACL femoral footprint remains a challenge, with variable measurements reported in the literature. 10,32 Clinically, for image-guided ACL reconstruction to be helpful, the measurement should be both anatomic, reproducible, and relatable to arthroscopic landmarks. An anatomic and histological study by Sasaki et al 32 identified bony ridges—namely, the lateral intercondylar ridge and the lateral intercondylar posterior ridge—surrounding the true, functional, ACL femoral footprint. Norman et al 29 confirmed that cortical bony thickening corresponding to the ACL footprint could be identified utilizing micro-CT, although this technique is not readily available in the clinical setting.
In correlating these established landmarks on 3D MRI, we propose an anatomic technique to: (1) identify the center of the ACL femoral footprint, (2) measure the ACL femoral footprint surface area, and (3) measure the coordinates of the ACL centroid relative to the apex of the deep cartilage (ADC) of the lateral femoral condyle. 9 We propose that utilizing anatomic bony landmarks on imaging will result in high intra- and interobserver reliability for the measurement of the ACL femoral footprint coordinates and surface area. The null hypothesis was that there is insufficient agreement (intraclass correlation coefficient [ICC] < 0.4) between the 2 observers (R.J., T.S.) in making these measurements.
Methods
In this prospective cohort study, a total of 45 patients with clinically suspected ACL tears were recruited between November 2014 and May 2016 at a tertiary care center. Institutional review board ethics approval was obtained. Participation in the study was optional. Verbal and written consent were obtained from all participants. Patients with multiligamentous injury, previous knee surgery, previous cortisone injections (on either side), and evidence of bony ACL avulsion were excluded. Four patients were excluded; 3 had inadequate imaging (incomplete examination or motion artifact), while 1 was found to have an intact ACL. The mean patient age was 31 ± 10 years (range, 16-60 years), and 28 of the 41 (68.3%) were men.
An a priori power analysis was conducted. As previously demonstrated, the ACL femoral footprint is, on average, 12 ± 2.6 mm distal to the ADC. 10 Assessing for a mean that falls outside this range (15 mm) as measured by either of the 2 observers, with a type 1 error (α) of 0.05% and power (β) of 95%, we estimated the required minimum sample size (N = sample size; σ = 2.6; μ1 = 12, μ2 = 15):


Therefore, a sample size of at least 10 was required to detect a difference in magnitude of 3 mm with power of 95%.
Imaging Parameters
In addition to a standard preoperative MRI of the injured knee, a 3D sequence of both the injured and uninjured knee was obtained. The present study was limited to the analysis of the uninjured, contralateral knee. The 3D coronal-oblique sequence was obtained on a 1.5T MRI (General Electric). The plane of the native acquisition was perpendicular to the Blumensaat line. The fast spin echo time was 32 milliseconds, with a repetition time of 2000 milliseconds and a slice thickness of 0.625 mm.
Image Analysis
InteleViewer 3D multiplanar software (Intelerad Medical Systems) was utilized to identify the ACL femoral footprint in the coronal-oblique, sagittal-oblique, and axial-oblique planes. The limits of the lateral intercondylar and the lateral intercondylar's posterior bony ridges were identified on the 3D images (Figure 1). Four points along the limits of the bony ridges were chosen to delineate the ACL femoral footprint. An ellipse of best fit was subsequently drawn to approximate the footprint area (Figure 2). Subsequently, the ADC (the posteromedial, most superior aspect of the lateral femoral condyle articular cartilage) was labeled. Distal and anterior distances (measured in cm) from the ADC to the ACL femoral footprint center were then measured. The dimensions of the ACL footprints were also measured (Figure 2). The measurements were performed by 2 musculoskeletal radiologists (R.J., T.S.) who repeated the measurements after 1 month.

A 3D coronal-oblique MRI scan along the axis of the Blumensaat line showing the posterior ridge (arrow) and the lateral ridge (arrowhead). The asterisk marks the femoral footprint of the ACL. 3D, 3 dimensional; ACL, anterior cruciate ligament; LFC, lateral femoral condyle; MFC, medial femoral condyle; MRI, magnetic resonance imaging; TIB, tibia.

Delineation of the ACL femoral footprint on a true sagittal image. Using the 3D coronal oblique sequences, the bounds of the ACL femoral footprint were approximated (shaded oval). The ADC was labeled, and the anterior and distal positions of the ACL footprint center relative to the ADC were measured. The oval region of interest was used to calculate the surface area. The length and width of the footprint were also recorded. 3D, 3 dimensional; ACL, anterior cruciate ligament; ADC, apex of the deep cartilage.
Statistical Analysis
Measured variables included the positions of the distal and anterior coordinates of the ACL footprint center, the ACL footprint surface area, and the footprint length and width. Intra- and interobserver reliability of the measured quantities was assessed by computing ICCs (2-way, single score, and same observers for all subjects). The Landis and Koch 18 criteria were used to assess the strength of interobserver agreement: ICC <0 indicates none, 0 to 0.20 is slight, 0.21 to 0.40 is fair, 0.41 to 0.60 is moderate, 0.61 to 0.80 is substantial, and 0.81 to 1 is almost perfect. Paired Student t tests were performed to compare measurements of observers A and B, with null hypotheses stating that there was no difference between the measurements of these 2 observers. Specifically, in this analysis, all measurements of observer A (mean value of trials 1 and 2) were compared with those of observer B (mean value of trials 1 and 2). To assess for sources of systematic bias, a qualitative assessment of measurements was performed by producing Bland-Altman plots. Bland-Altman plots were constructed by subtracting the mean of the 2 measurements of observer B from that of observer A (observer A – observer B) and were expressed as the percentage difference. The cutoff for statistical significance was set at P < .05. All statistical analysis was performed with a statistical software package (MedCalc Software).
Results
The mean ACL footprint measurements across both trials for each observer are given in Table 1. There was no statistical difference between the measurements of observer A compared with observer B in distal and anterior positions; however, with respect to the ACL femoral footprint surface area, observer A’s measurement was significantly smaller than that of observer B’s (1 ± 0.22 vs 1.19 ± 0.27 cm2, respectively; P < .001). This was attributable to a statistically significant difference in the footprint width measurement between the 2 observers (P < .001).
Measurement of ACL Femoral Footprint Parameters Between the 2 Observers a

a Values are presented as mean ± SD. Distal and anterior measurements are relative to the ADC of the lateral femoral condyle. Bolded P values denote statistically significant differences between the mean values of observer A and observer B (P < .05). ACL, anterior cruciate ligament; ADC, apex of the deep cartilage.
b Two-tailed t test.
Intra- and interobserver agreement for the ACL distal and anterior coordinate measurements was substantial to almost perfect (Table 2). For the ACL surface footprint area, intraobserver agreement was fair and moderate to substantial, respectively, for observers A and B. Interobserver agreement for the ACL surface footprint area was moderate (Table 2).
Intra- and Interobserver Reliability for ACL Footprint Measurements a
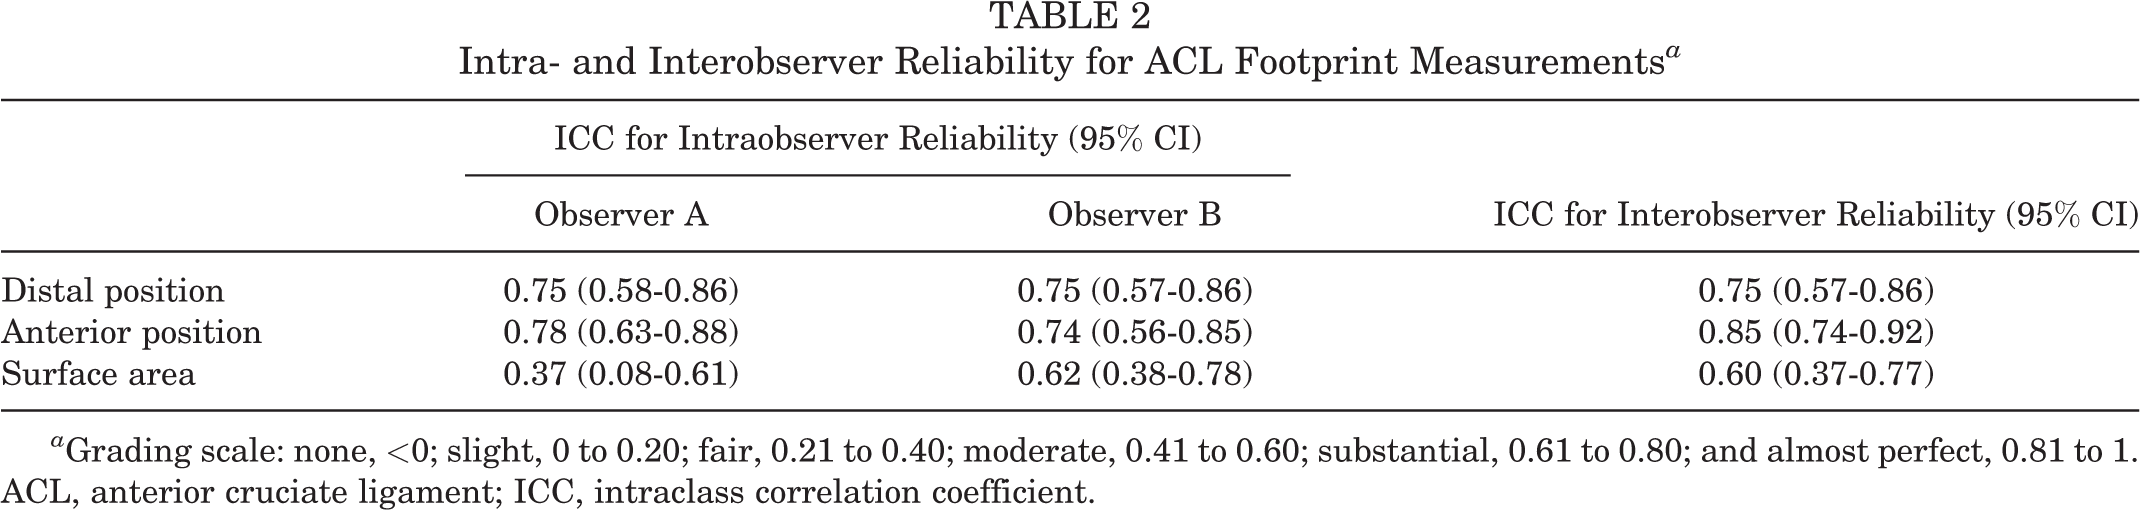
a Grading scale: none, <0; slight, 0 to 0.20; fair, 0.21 to 0.40; moderate, 0.41 to 0.60; substantial, 0.61 to 0.80; and almost perfect, 0.81 to 1. ACL, anterior cruciate ligament; ICC, intraclass correlation coefficient.
Bland-Altman plots demonstrated a negligible mean difference between observers A and B (observer A – observer B) for the distal and anterior measurements. Mean differences of 0.5% and 0.2% were recorded between each observer for the distal and anterior measurements, respectively. Therefore, there was no evidence of systematic bias in these measurements (Figure 3, A and B).
Bland-Altman plots demonstrated a consistent systematic bias of larger surface area measurement by observer B (Figure 3C). This was because observer B consistently measured a larger ACL footprint width (P < .001) (Table 2).

Bland-Altman plots depicting limits of agreement and difference between the 2 observers (observer B – observer A) for (A) the distal and (B) anterior position of the ACL femoral footprint's center relative to the ADC as well as for (C) surface area measurements. The difference was expressed as a percentage of the mean measurement, with negative percentages indicating larger values for observer A compared with observer B. The mean difference between observers was negligible for the distal and anterior displacement of the ACL center. Observer B measured the ACL footprint as 16.5% larger than observer A. ACL, anterior cruciate ligament; ADC, apex of the deep cartilage.
Discussion
In the current study, the interobserver agreement for the distal offset was substantial, while the agreement for the anterior offset was almost perfect. There was no statistical difference in the coordinate measurements between the 2 observers. With respect to surface area measurement's intraobserver reliability, observer A demonstrated fair agreement (ICC, 0.37), while observer B demonstrated moderate to substantial agreement (ICC, 0.62). Overall, interobserver agreement was moderate for the surface area measurement (ICC, 0.60). These findings were contrary to our stated experimental hypothesis that the surface area could be reliably delineated with 3D MRI.
Observer B consistently measured larger footprints (1.19 cm2) compared with observer A (1.01 cm2), with a mean difference of 16.5%. The surface area values reported by both observers, however, were within the range of what has been previously reported. A meta-analysis, for example, demonstrated values 31 ranging between 0.77 and 1.37 cm2. Groups, including Harner et al, 8 Iriuchishima et al, 14 and Siebold et al, 34 reported mean footprint surface areas of 0.96, 0.84, and 0.98 cm2, respectively. The current anatomic and histological understanding is that the ACL femoral footprint consists of both direct and indirect fibers. 15,32 The direct fibers are bounded by bony ridges and contribute maximally to stability. Therefore, the true functional footprint is thought to encompass only this area. 27,28
We hypothesized that the relatively small (although statistically significant) difference in the surface area measurement seen between the 2 observers would be attributable to slight, symmetric differences in the identification of the bony ridges, which are often not distinct. This resulted in variable inclusion of indirect fibers, possibly accounting for the discrepancy in the measurement between the 2 observers. In the future, we posit that machine learning techniques could iterate the measurements, leading to a smaller error margin.
Our technique does have some limitations. First, proton density–weighted sequences may be susceptible to magic angle phenomenon, although we did not observe this to be the case at the ACL femoral footprint in our study. Second, we were limited to the use of 1.5T scanners instead of 3.0T scanners. The latter produces better signal-to-noise ratio and subsequently higher spatial resolution; delineation of the ACL footprint would thus in theory be enhanced with higher field strength. Generally, spatial resolution of MRI is lower than that of CT, which may be better suited to delineating the fine bony detail of the ridges. Of note, a recent study by Norman et al 29 utilized micro-CT for the analysis of the cortical thickening underlying the ACL footprint. Such a technique may allow for greater precision in characterizing the footprint surface area. Another limitation is that we are unable to distinguish between the anteromedial and posterolateral bundles of the ACL insertion, although controversy exists regarding the presence of distinct bundles. 35 Furthermore, because we are approximating the surface area as an oval, we cannot give specific, highly detailed morphological information. One final limitation is that we lacked the reference gold standard of arthroscopy, as we were attempting to establish measurement reliability on healthy, uninjured knees. Conversely, an advantage of our technique is that these 3D sequences can be readily obtained with conventional, clinical MRI scanners and that the measurements may be performed by either the orthopaedic surgeon or the radiologist with no need for additional specialized software. To our knowledge, no existing study has examined the reproducibility of femoral footprint coordinate measurements on clinical MRI scanners, which could be of use in the context of surgical planning for reconstruction.
A previous study has shown that the femoral tunnel, at least partially, overlaps the native ACL footprint in 67% of cases. 10 It has also been demonstrated that providing femoral footprint coordinates does not improve the precision by which surgeons place the tunnels. 24 In conjunction with the result of the present study, we posit that future work should focus on the implementation of 3D navigation for femoral tunnel placement. This would, in theory, reduce errors introduced by reliance on coordinate measurements transferred from the imaging workstation to the operating room.
Conclusion
Our 3D MRI technique for locating the ACL femoral footprint center demonstrated substantial intra- and interobserver agreement. Although the technique was excellent for identifying the ACL center, it demonstrates only fair-to-moderate interobserver agreement for the measurement of the footprint surface area, indicating that further refinement of the technique is required.
Footnotes
Acknowledgment
The authors extend their gratitude and appreciation to Janet Faith, the orthopaedic surgery research coordinator, and Lyne Santello, the MRI technologist responsible for conducting the scans.
Final revision submitted April 21, 2021; accepted May 25, 2021.
The authors have declared that there are no conflicts of interest in the authorship and publication of this contribution. AOSSM checks author disclosures against the Open Payments Database (OPD). AOSSM has not conducted an independent investigation on the OPD and disclaims any liability or responsibility relating thereto.
Ethical approval for this study was obtained from McGill University Health Centre (study No. 12-202-SDR).