
Abstract
Background:
Magnetic resonance imaging (MRI) is an effective tool for objective evaluation after meniscal allograft transplant (MAT). Little is known about the association between MRI features of allograft and clinical outcomes.
Purpose/Hypothesis:
To assess the degree and location of signal intensity (SI) as well as the morphology of allografts on MRI after MAT and evaluate the association between clinical outcomes and MRI features in the midterm period. It was hypothesized that a high SI accompanied by a deformed allograft in specific locations on MRI would be associated with inferior clinical outcomes.
Study Design:
Cohort study; Level of evidence, 3.
Methods:
Included were patients who underwent MAT with fresh-frozen allografts and had >3 years of follow-up with 3.0-T MRI scans. Allograft status was assessed by SI on MRI as grade 0 (normal), grade 1 (globular increased SI not adjacent to the articular surface), grade 2 (linear SI within the meniscus), or grade 3 (increased SI extended to the articular surface). Allograft morphology was assessed by the presence of distorted contours. Clinical outcomes were evaluated using the Lysholm score. The association between clinical outcomes and MRI findings was assessed by multiple linear regression analysis.
Results:
A total of 138 patients (156 MAT procedures: 132 lateral, 24 medial) with a mean follow-up period of 55.4 ± 19.9 months (range, 36-110 months) were enrolled in this study. Grade 3 SI was observed in the posterior meniscus root and posterior third of the allograft in 39 (25%) and 62 (39.7%) MATs, respectively. Among the 62 MATs with grade 3 SI in the posterior third of the allograft, 34 (54.8%) were accompanied by distorted allograft contour. The presence of grade 3 SI with distorted contour in the posterior third of the allograft was significantly associated with inferior outcomes (β = –6.5 [95% CI, –12.5 to –0.5]; P < .035), as was the presence of grade 3 SI in the posterior meniscus root (β = –5.5 [95% CI, –10.5 to –0.4]; P < .034).
Conclusion:
On MRI evaluation in the midterm period after MAT, grade 3 SIs of the meniscal allograft were observed in about a third of the cases, and the association with clinical outcomes was dependent on the specific location and morphology of the allograft on MRI.
Meniscal allograft transplant (MAT) is an effective treatment to provide pain relief and improve knee joint function of the patient with a symptomatic meniscus-deficient knee. 26 Satisfactory long-term clinical results have been reported with proper indication and advances in surgical techniques. 6,9,19 To analyze long-term outcomes after MAT, an appropriate post-MAT evaluation, which incorporates clinical and objective aspects, should be conducted. 14,30 The clinical outcomes are mainly assessed by patient-reported outcome measurements, and the objective outcomes are evaluated by second-look arthroscopy or magnetic resonance imaging (MRI). 14 An MRI has 2 advantages over second-look arthroscopy: MRI is a noninvasive procedure that can be performed repeatedly, and it provides a comprehensive evaluation of the knee joint, including the meniscus, articular cartilage, ligaments, bone, and soft tissue.
The diagnostic accuracy of MRI in the pathology of the native meniscus is well-established. 34 According to the grading system described by Stoller, 28 grade 3 signal intensity (SI; linear high SI communication with the joint) in the native meniscus indicates a meniscal tear, and this grading system has demonstrated the ability to provide high sensitivity and specificity. 5,7 However, the accuracy of MRI in the postoperative meniscus is relatively low. After meniscal repair, high SI at the repair site due to fibrocartilaginous scar tissue is often observed, which may lead to confusing results during an evaluation to determine the possibility of retear. 2,18,25,31,35 Similar findings have been observed in the transplanted meniscal allograft. 10,13,16,33 After MAT, incorporation of the meniscal allograft into the capsule occurs with revascularization and repopulation, and it often results in high SI on early postoperative MRI. 24
A previous study has reported that this high SI in the early postoperative phase does not correlate with clinical outcomes. 16 However, the characteristics of the SI of an allograft on MRI after the incorporation process are unknown. In a study of long-term outcomes of MAT, Verdonk et al 32 reported that grade 3 SI of allograft on MRI was not an uncommon finding and was not correlated with clinical outcome. However, because this finding was based on only 17 MRI scans of early experimental MAT procedures, the evaluation of clinical associations might be limited. In contrast, recent studies that analyzed the results of MAT have defined grade 3 SI of allograft as one of the criteria indicating poor graft status. 11,20 Thus, there is conflicting evidence regarding whether grade 3 SI of the allograft is associated with inferior outcomes and whether it should be considered as an indicator of poor outcomes after MAT.
The current study aimed to assess the degree and location of the SI as well as the morphology of allografts on MRI after MAT and evaluate the association between clinical outcomes and features seen on MRI in the midterm period. It was hypothesized that a high SI accompanied by a deformed allograft in specific locations on MRI would be associated with inferior clinical outcomes.
Methods
The medical records of 291 MATs of 246 patients who underwent MAT between January 2010 and September 2016 were retrospectively reviewed. All the procedures were performed by a senior orthopaedic surgeon at a single center (S-I.B.). MAT was indicated for patients who had persistent pain and swelling on the affected knee after subtotal or total meniscectomy despite nonoperative treatment. Any correctable malalignment or ligament instability was addressed before MAT or during MAT. A preserved joint space width of at least 2 mm was confirmed on standing posteroanterior knee radiographs with the knee in 45° of flexion (Rosenberg view). 9,11,20 Conversely, advanced arthrosis, which includes generalized grade 4 cartilage defects determined by the International Cartilage Repair Society (ICRS) grading system, 3 was a contraindication for MAT. However, MAT was performed as a salvage procedure in cases of localized grade 3 or 4 articular cartilage lesions in which coverage by the meniscal allograft could be expected. 22 This study included patients who were followed for a minimum of 3 years postoperatively with both 3.0-T MRI and patient-report outcome measurements. This study was approved by the ethical board of our institute.
Surgical Technique and Rehabilitation
Lateral MAT was performed using the keyhole technique, whereas medial MAT was performed using the separate bone-plug technique. Fresh-frozen allograft was used in all cases. The methods described by Pollard et al 23 were used to determine the size of the allograft. After an arthroscopic examination to evaluate the status of meniscus, ligament, and articular cartilage, the remnant native meniscus was resected. After the tibial tunnel was prepared for a keyhole of the lateral MAT or separate bone-plug of the medial MAT, the allograft was transplanted through a mini-open arthrotomy. An arthroscopic examination was conducted to confirm that the allograft was in an optimal position, and it was then repaired using traditional inside-out sutures.
Isometric muscle exercises were initiated immediately after surgery. Partial-weightbearing walking was permitted during the first 2 weeks, followed by gradual full weightbearing at postoperative weeks 6 to 8. The range of motion goal was to achieve 90° of flexion within 4 weeks and full range of motion within 6 to 8 weeks.
Evaluation of Graft Status and Extrusion on MRI
MRI was performed on a 3.0-T MRI scanner (Achieva or Ingenia; Philips Healthcare) with a 16-channel knee coil. The standard knee imaging protocols consisted of non–fat-suppressed T1-weighted, non–fat-suppressed T2-weighted, and fat-suppressed intermediate-weighted 3D fast spin-echo (FSE) proton-density (PD) sequences. Sagittal and coronal images were acquired with 1.5- and 2.5-mm slice thickness, respectively. The SI and morphology of allografts were evaluated on the FSE PD sequences. The matrix of the FSE PD sequence was 512 × 512. The repetition time ranged from 2403 to 4805 ms, and the echo time was 20 ms.
Allograft status was assessed by evaluating the SI and morphology on MRI. The allograft SI was graded according to the method described by Stoller 28 : grade 0 (normal), grade 1 (globular increased SI not adjacent to the articular surface), grade 2 (linear SI within the meniscus), or grade 3 (increased SI extended or communicated to the articular surface). The allograft morphology was assessed by the presence of distorted contour of the meniscal allograft to determine its structural integrity (Figure 1). MRI evaluation was performed by dividing the graft into 5 sections: anterior meniscus root, anterior third of the allograft, midbody, posterior third of the allograft, and posterior meniscus root. For the anterior and posterior meniscus roots, it was not possible to define the contour of the allograft on the MRI scan; therefore, only the SI was evaluated. Meniscal extrusion was measured on the same FSE PD sequence and assessed with the width between 2 vertical lines: the meniscus outer edge and the outer edge of the articular surface of the tibial plateau in the midcoronal section. Meniscal extrusion was defined as subluxation >3 mm. 15,17,27,29
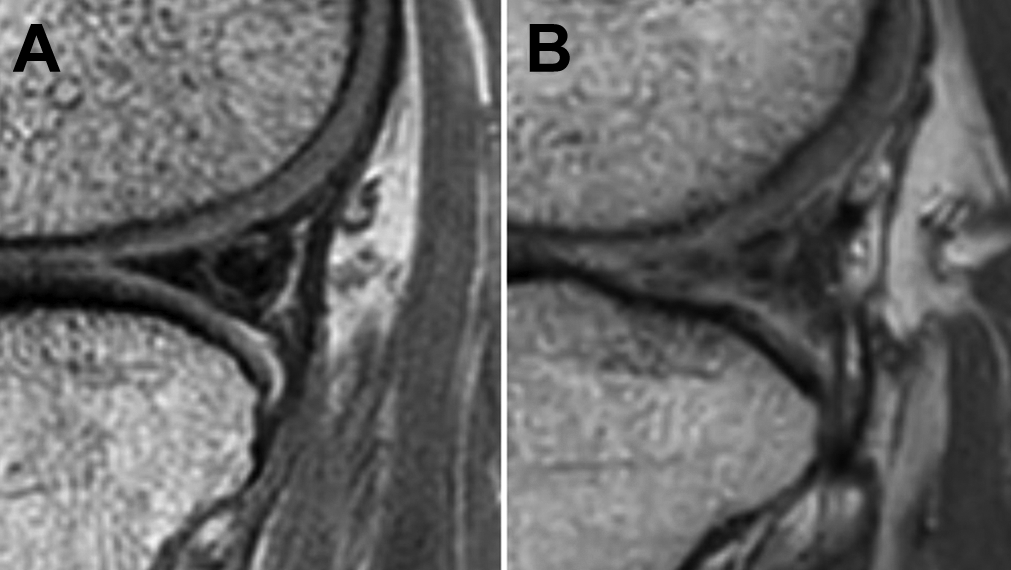
Magnetic resonance image showing grade 3 signal intensity in the posterior third of the allograft (A) without and (B) with distorted contour.
The MRI evaluation was independently performed by 2 experienced orthopaedic surgeons (S-M.L. and J-H.S.). The interobserver reliability between the 2 observers was assessed. In the case of different results between the 2 observers, the results were determined based on consensus between them.
Evaluation of Cartilage Status on MRI
Cartilage status of the femoral and tibial sides was assessed with ICRS grade on MRI: grade 0, normal; grade 1, softening or fissure on the cartilage; grade 2, cartilage defect <50% of the entire cartilage thickness; grade 3, cartilage defect ≥50% of the entire cartilage thickness; and grade 4, exposure of the subchondral bone. 3,8 The worst grade was assumed to represent the whole cartilage status of the affected compartment. The patients were categorized into 3 groups according to the grade of cartilage degeneration on the femoral and tibial sides: low-grade chondral lesions (ICRS grade ≤2) on both the femoral and tibial sides, high-grade lesions (ICRS grade 3 or 4) on either femoral or tibial side, and high-grade lesions on both femoral and tibial sides.
Clinical Evaluation
The clinical outcomes were evaluated by Lysholm score within 1 week of the MRI scan. The Lysholm score was compared according to the grade of SI and morphology of the allograft in each of the 5 sections of the allograft.
Statistical Analysis
The agreement in the evaluation of graft status on MRI between the 2 independent observers was assessed using the weighted Cohen kappa coefficient, in which kappa <0.20 indicated poor, 0.21 to 0.40 fair, 0.41 to 0.60 moderate, 0.61 to 0.80 substantial, and >0.80 almost-perfect agreement. 12 The Student t test or Mann-Whitney U test was used to compare the Lysholm scores between the groups according to the degree and location of allograft SI, the morphology of allograft, and cartilage status. The clinical outcomes of grade 3 SI with or without distorted contour were compared with those of grades 0, 1, and 2 SI. The distribution of SI was analyzed using the Pearson chi-square test. Multiple linear regression analysis using the enter method was performed to assess the specific location and allograft SI features associated with the Lysholm score while adjusting for cartilage status. All statistical analyses were performed using SPSS v 21.0 (IBM Corp). P values <.05 were considered statistically significant.
A post hoc power analysis for detecting significant factors in the multiple linear regression analysis was performed using G*Power 3.1 (Heinrich-Heine-Universitat Dusseldorf) with .05 alpha error.
Results
We identified a total of 156 MATs (132 lateral and 24 medial MATs) in 138 patients with a mean follow-up of 55.4 ± 19.9 months (range, 36-110 months). Of 156 cases of primary MAT, 95 were in men and 61 in women; the mean patient age was 32.6 ± 10.6 years (range, 15-54 years) (Table 1). The Lysholm score was 88.4 ± 11.7 at the mean follow-up of 55.4 ± 19.9 months (Table 2).
Patient Characteristics (N = 156 Knees) a

a Data are reported as mean ± SD (range) unless otherwise indicated.
b A positive value indicates varus alignment, whereas a negative value indicates valgus alignment.
Clinical Outcomes and Cartilage Status
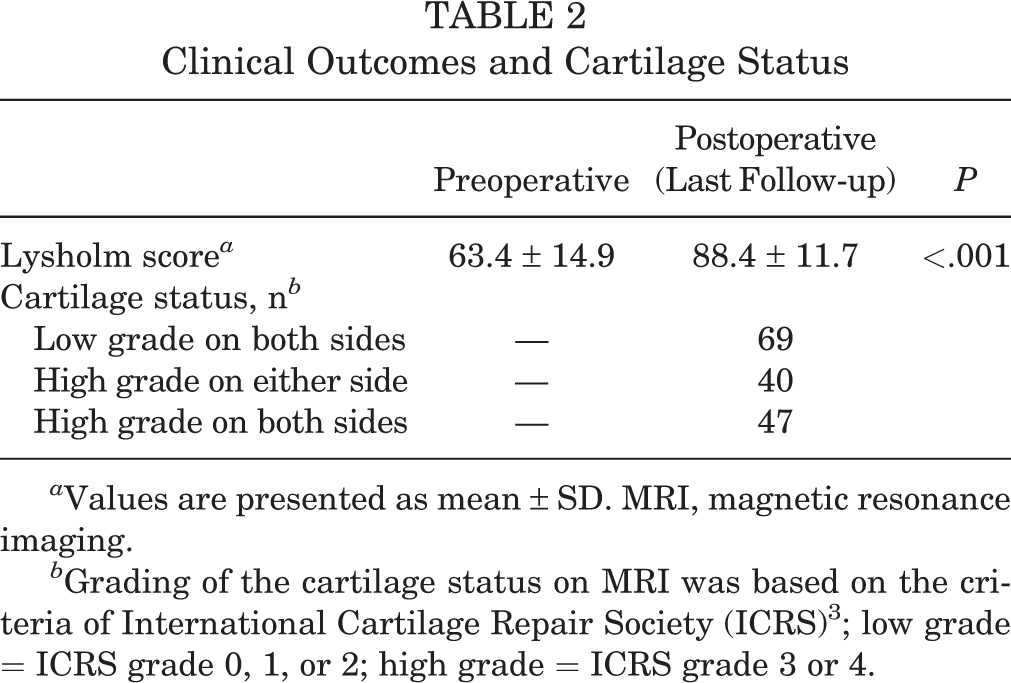
a Values are presented as mean ± SD. MRI, magnetic resonance imaging.
b Grading of the cartilage status on MRI was based on the criteria of International Cartilage Repair Society (ICRS) 3 ; low grade = ICRS grade 0, 1, or 2; high grade = ICRS grade 3 or 4.
SI and Morphology of Allograft on MRI
The weighted Cohen kappa coefficient for interobserver reliability on MRI evaluation was 0.73, indicating substantial agreement. The overall distribution of SI of allografts is presented in Table 3. Each part of the allograft showed a different distribution of grade 3 SI. More grade 3 SIs were observed in the posterior third of the allograft than in the other parts (P < .001). However, the distribution of grade 3 SI in the posterior third of allograft did not show a statistically significant difference between medial and lateral MATs (P = .485). Grade 3 SI in the posterior meniscus root and posterior third of the allograft on MRI was observed in 39 of 156 (25%) and 62 of 156 (39.7%) MATs, respectively, and 32 of them were observed in both parts. Among the grade 3 SIs in the posterior one-third of allografts, 34 of 62 (54.8%) MATs exhibited a distorted contour (Figure 2). The meniscal extrusions were more often accompanied by distorted contour in the cases of grade 3 SI in the posterior meniscus root and grade 3 SI in the posterior third of the allograft than in the other parts (Table 4).
Graft Status on MRI According to Stoller a

a Grading of the graft status on MRI was based on the criteria by Stoller. 28 MAT, meniscal allograft transplant; MRI, magnetic resonance imaging.

Distribution of grade 3 signal intensity (increased signal intensity extended to articular surface) on MRI. The percentage of each section indicates the proportion of grade 3 signal intensity in the entire allograft. The number in parentheses indicates the proportion of grade 3 signal intensity with distorted allograft contour in the entire allograft. MRI, magnetic resonance imaging.
Meniscal Extrusion According to Signal Intensity and Morphology of Allograft on MRI a

a Bolded P values indicate statistically significant difference between signal intensity grades. MRI, magnetic resonance imaging.
b Grading of the graft status on MRI was based on the criteria by Stoller. 28
c Presence of grade 3 signal intensity of meniscal allograft with distorted meniscal contour on MRI.
Graft Status on MRI and Clinical Correlation
The Lysholm score showed a significant difference according to the SI and morphology of the allograft in the posterior meniscus root and posterior third of the allograft. Patients with grade 3 SI in the posterior meniscus root reported an inferior Lysholm score compared to those without grade 3 SI (82.5 ± 12.1 vs 90.1 ± 10.9; P < .001). Likewise, the Lysholm score of patients with grade 3 SI with a distorted contour in the posterior third was inferior to that of patients with less than grade 3 and grade 3 without distorted contour (81.2 ± 11.5 vs 89.6 ± 12.0 vs 91.7 ± 6.62, respectively; P < .001) (Figure 3). Significant associations with inferior clinical outcomes were found for grade 3 SI with distorted contour in the posterior third of the allograft (β = –6.5 [95% CI, –12.5 to –0.5]; P < .035) and grade 3 SI in the posterior meniscus root (β = –5.5 [95% CI, –10.5 to –0.4]; P < .034) (Table 5, Figure 4). On the post hoc power analysis, the sample size of 156 showed a power (1 – β) of 0.92 to detect the status of allografts associated with inferior clinical outcomes.
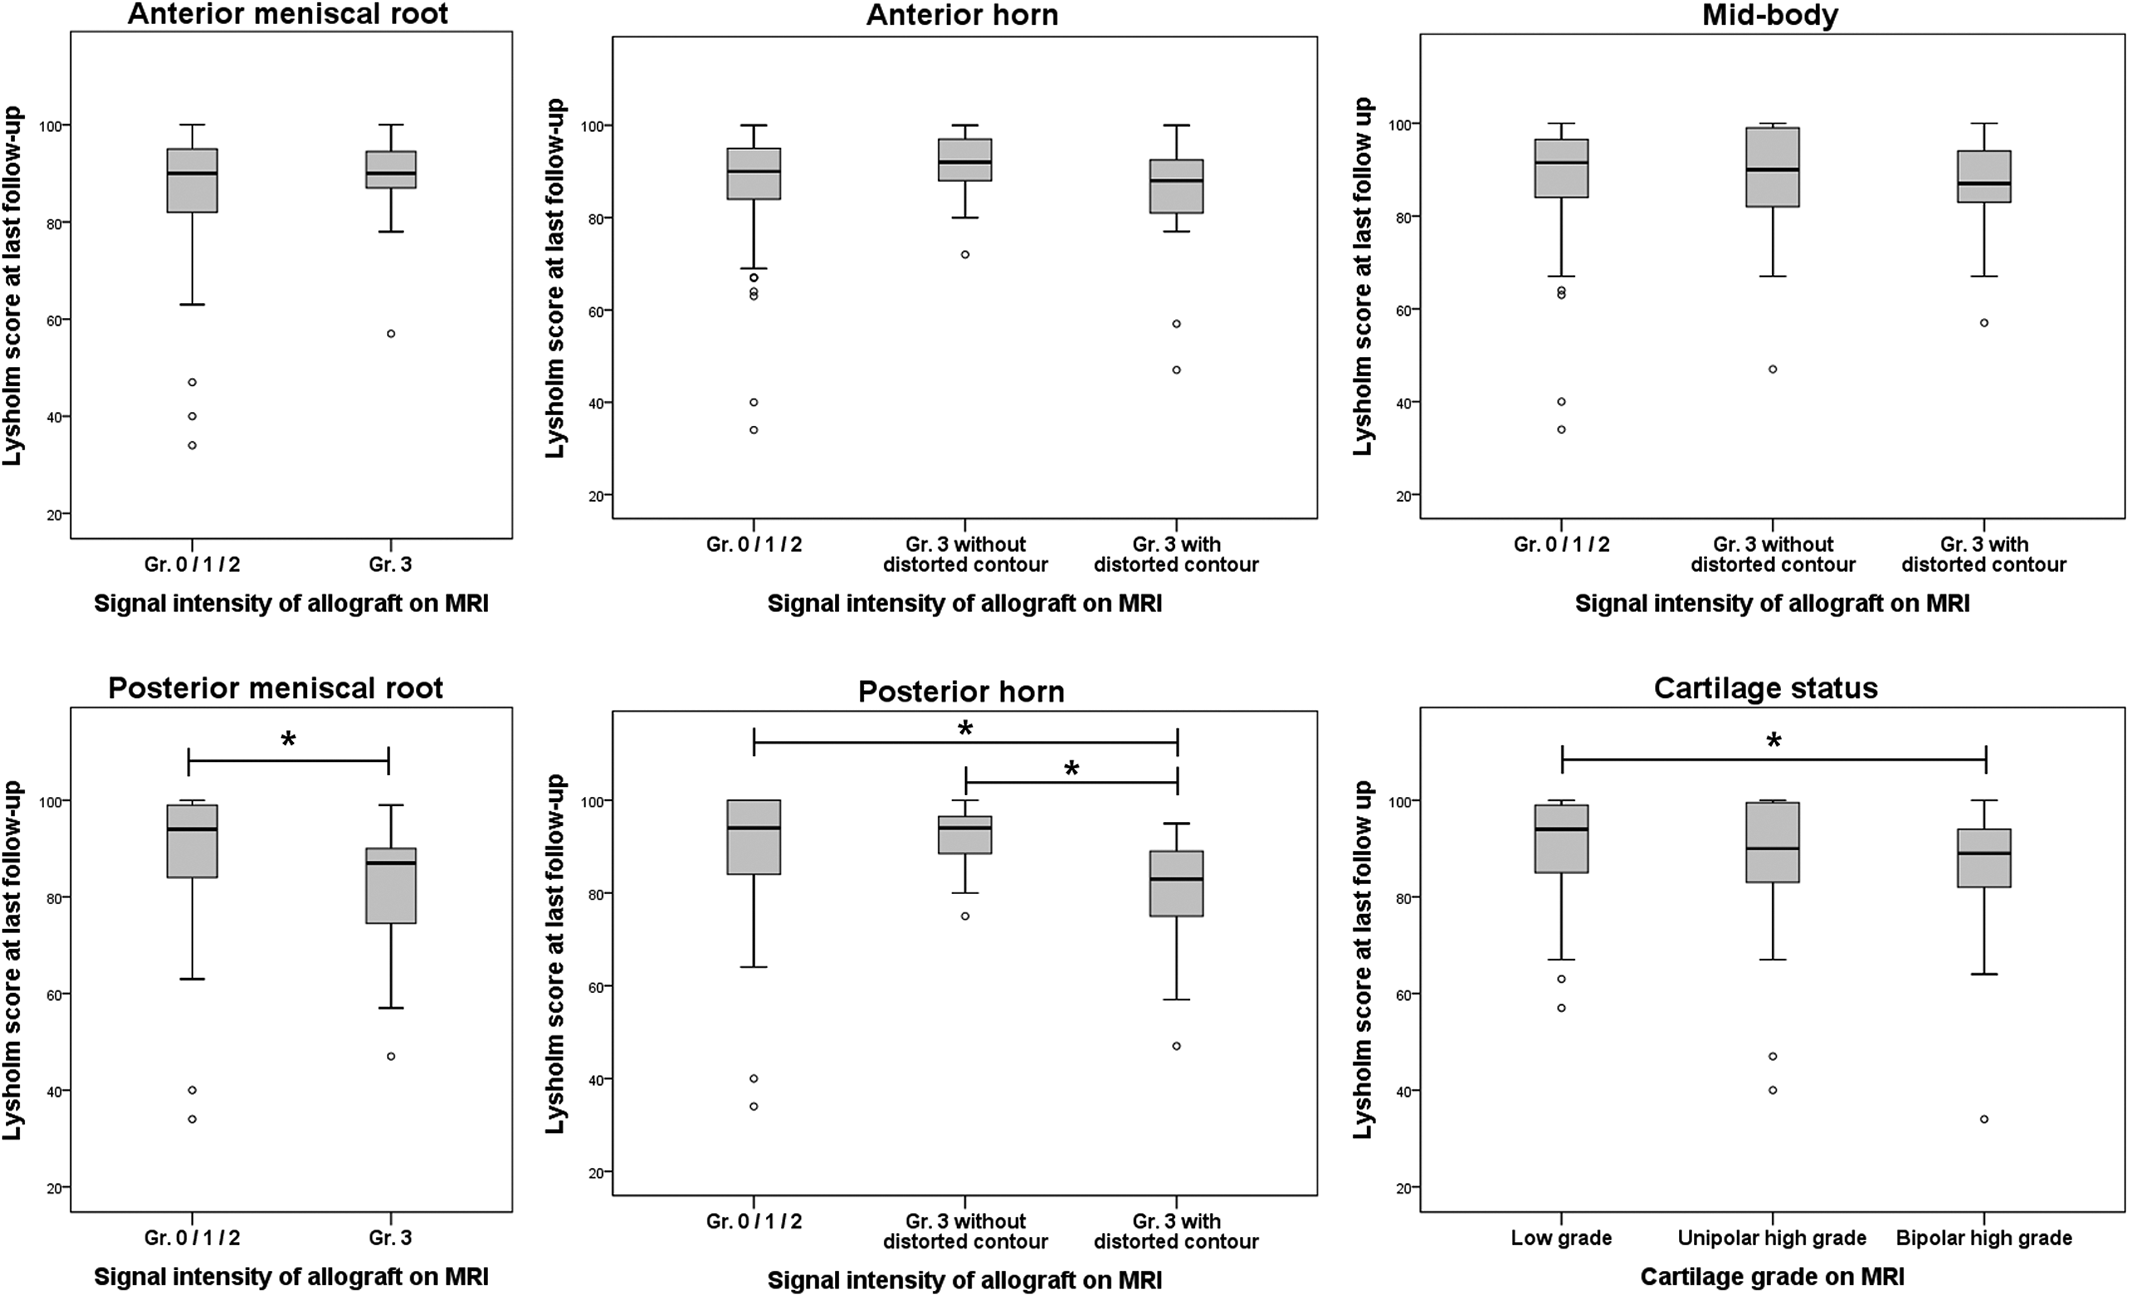
Association between high signal intensities of meniscal allograft and clinical outcomes according to the location and morphology. *Statistically significant difference between the values compared.
Multiple Linear Regression Analysis of Morphologic Characteristics of the Allograft and Cartilage Status Correlated With the Lysholm Score a

a The variables statistically associated with the Lysholm score were determined using multiple linear regression analysis with an enter method. Bolded P values indicate statistical significance.
b Grading of signal intensity of meniscal allograft on MRI was based on the criteria by Stoller. 28
c The reference group was signal intensity of grade <3.
d The presence of grade 3 signal intensity of meniscal allograft with distorted meniscal contour on MRI.
e The reference group was low-grade cartilage lesion.

(A) MRI of a 48-year-old male patient who underwent lateral meniscal allograft transplant. The posterior third of the allograft on MRI at postoperative 6.4 years showed a grade 3 signal intensity (increased signal intensity extended to the articular surface) without distorted contour. The patient’s Lysholm score was 95. (B) MRI of a 43-year-old male patient who underwent lateral meniscal allograft transplant. The posterior third of the allograft on MRI at postoperative 3 years showed a grade 3 signal intensity with distorted contour. The patient’s Lysholm score was 82. MRI, magnetic resonance imaging.
Discussion
The present study shows that the clinical relevance of increased SI of an allograft on an MRI scan depends on the location of the SI and the structural integrity of the allograft. Specifically, the grade 3 SIs of the posterior meniscus root and posterior third with distorted contour were associated with inferior clinical outcomes. Although there were differences in the distribution of grade 3 SI in accordance with location, overall grade 3 SI was observed in approximately 30% of the allografts, and it was most evident in the posterior third of these allografts.
Previous studies have reported increased allograft SI after MAT. 11,16,21,24 Potter et al 24 investigated 29 fresh-frozen allografts after MAT using 1.5-T MRI at a mean follow-up of 1 year; 15 of 29 allografts showed increased SI in the posterior horn, which confirmed chondromucoid degeneration and peripheral cellular repopulation on histologic examination. 24 In an evaluation of 108 MATs using MRI at a mean follow-up of 28.8 months (range, 6-151 months) by Kim et al, 11 only 8 allografts showed normal SI, and the remaining allografts showed various SIs on MRI. Mild degeneration was observed more frequently at the anterior horn of the allografts; however, grade 3 SI was observed more frequently at the posterior horn in 15% of the allografts. 11 Noyes et al 21 evaluated 29 MATs using MRI with a mean follow-up of 35 months and found grade 3 SI in 10.3% of these allografts. Lee et al 16 evaluated quantitative changes in the SI of allografts after MAT within 1 postoperative year using 1.5-T MRI in 43 patients. The mean SI of allografts in the region of interest was higher in the anterior horn than in the posterior horn, and the increased SI of allografts persisted within 1 postoperative year. However, the clinical outcomes were not correlated with the SI of allografts.
As published in previous studies, the high SI of allograft on MRI after MAT is not an uncommon finding, and the present study showed similar results but a slightly higher incidence than the previous results. There are 2 possible explanations for the differences between the current and previous results. First, the current study included only midterm follow-up results, and the degeneration of allografts might be more pronounced with longer follow-up periods. Second, all MRI evaluations in the present study were conducted with 3.0-T scanners. The high resolution may have allowed us to distinguish ambiguous and complicated cases more readily than previous investigations that used less than 3.0-T MRI.
The grading system described by Stoller 28 showed high sensitivity and specificity for meniscal pathology in the native meniscus; however, the diagnostic accuracy of this grading system is relatively low in the postoperative meniscus, especially for meniscal repair. Further, it is challenging to clearly distinguish scar tissue, tears, and healing states after MAT among allografts with abnormal SI. Therefore, there is concern about whether all high SIs should be considered as yielding unsatisfactory results after MAT. Although the definite failure criteria of MAT are still debatable, several previous studies defined grade 3 SI of an allograft as an unsuccessful result of MAT in terms of objective evaluation. However, good clinical outcomes even in cases of grade 3 SI of allografts have been reported in other studies. 11,20,30
In a long-term survival analysis of 58 MATs with a mean follow-up of 11.9 ± 3.2 years, Noyes and Barber-Westin 20 defined the survival endpoints as reoperations, MRI failure (grade 3 SI, extrusion >50% of meniscal width), meniscal tear on examination, and radiographic loss of the joint space. Among 29 MATs that were evaluated with MRI, 21 MATs were classified as failures in accordance with MRI or radiographic criteria. However, 16 of 21 MATs showed good to normal clinical outcomes, representing a 10% difference with surgical failure in terms of the survival rate at the fifth postoperative year. 20 In a long-term study of MAT by Verdonk et al, 32 grade 3 SI of allografts was observed in 10 of 17 (59%) patients who underwent MRI scan. The investigators reported that grade 3 SI did not correlate with clinical outcomes. However, the specific location of SI or morphology of the allografts was not considered in these 2 studies.
The present study showed that grade 3 SI with distorted contour in the posterior third of allografts and grade 3 SI in the posterior root were associated with inferior clinical outcomes. This finding implies that some grade 3 SI lesions may be benign lesions such as fibrous scar healing rather than a tear. Verdonk et al 32 suggested that unlike the general description of grade 3 SI in the native meniscus, the feature of grade 3 SI of allografts was a nonuniform patchy gray appearance and was not linear. The investigators interpreted these features as changes of the extracellular matrix rather than tears. 32 This phenomenon was also noted by Kim et al 10 in their study of the correlation between the arthroscopic examination and MRI findings after MAT. Those investigators compared the MRI findings of 20 knees with arthroscopy and evaluated the diagnostic efficacy of MRI for assessing grade 3 SI lesions. Grade 3 SI on the anterior third of allografts showed lower diagnostic accuracy than grade 3 SI on the midbody and posterior one-third of allografts. 10 Overall, these findings suggest that some proportion of the grade 3 SI lesions of allografts in the midterm period are due to changes in the extracellular matrix rather than tears, and, in this case, grade 3 SI may not correlate with clinical outcomes. In contrast, the present study demonstrated that among the grade 3 SIs on the posterior third of allografts, those with distorted contours were associated with significantly inferior outcomes. Thus, distorted contours should be considered a clinically significant finding. This may be due to the importance of the posterior horn and posterior root in maintaining load distribution, which is a primary function of the meniscus. 1 Moreover, considering that meniscal extrusion was observed more often in these 2 parts than in the others, it may be that disruption of the posterior part of the allograft affects meniscal extrusion and thus results in inferior clinical outcomes.
The present study suggests that when clinicians interpret high SI of an allograft on MRI after MAT, they should consider not only the presence of high SI but also its location and structural integrity on the MRI scan. This approach may help determine the need for further surgical intervention for an allograft with high SI if the clinical features are inconclusive.
The present study had several limitations. First, a potential selection bias could have existed due to the retrospective study design. However, because we evaluated the association between MRI findings and clinical outcomes at a single time point, using a cross-sectional study design, the influence of selection bias may be low. Second, we did not match MRI findings with arthroscopy and therefore could not conclude that a grade 3 SI with distorted contour is a definite tear. Third, the cartilage status was evaluated using the ICRS grading system, which is mainly used in macroscopic examination under arthroscopy. Therefore, cartilage status could have been under- or overestimated. Fourth, the clinical outcomes were evaluated only with the Lysholm score. Although the Lysholm score is a validated and widely accepted scoring system for the clinical evaluation of meniscal and ligament pathologies, clinical evaluation using a single form may be limited in terms of providing detailed information. Fifth, although extrusion was accompanied by grade 3 SI lesions more often on the posterior root and distorted posterior horn, the relationship between extrusion and degeneration in these 2 parts could not be determined. A previous study showed that extrusion does not affect SI of allografts after MAT. 27 However, considering that extrusion results from the degeneration of the posterior root in the native meniscus, 4 a longitudinal cohort study analyzing the changes in extrusion and allograft SI on MRI will be needed to reveal which one is a precursor lesion in MAT.
Conclusion
On MRI evaluation in the midterm period after MAT, grade 3 SI of the meniscal allograft was observed in about one-third of cases, and the clinical associations were dependent on the specific locations of grade 3 SI and morphology of the allograft on MRI. Grade 3 SI with a distorted contour in the posterior third of an allograft and grade 3 SI in the posterior root were associated with inferior clinical outcomes, but grade 3 SI of other sections was not.
Footnotes
Final revision submitted March 11, 2021; accepted April 20, 2021.
The authors have declared that there are no conflicts of interest in the authorship and publication of this contribution. AOSSM checks author disclosures against the Open Payments Database (OPD). AOSSM has not conducted an independent investigation on the OPD and disclaims any liability or responsibility relating thereto.
Ethical approval for this study was obtained from Asan Medical Center (AMC IRB No. 2020-0161).