
Abstract
Background:
Open fractures are debilitating injuries for athletes. No prior studies have investigated open fractures in National Football League (NFL) players.
Purpose:
To compare outcomes after open fracture in NFL players in terms of (1) time to return to sport (RTS), (2) postinjury career length and games played per season, (3) postinjury performance, and (4) postinjury performance compared with matched controls.
Study Design:
Retrospective comparative series; Level of evidence, 3.
Methods:
Publicly available records were used to identify NFL players who had sustained an open fracture between 1970 and 2018. Controls were matched to injured players by age, experience, position, and preinjury performance. RTS was defined as playing in at least 1 NFL game after open fracture. Comparisons between injured and control players were made using the paired-samples Student t test.
Results:
Injuries in 37 players were analyzed (age, 27.2 ± 3.6 years; experience, 4.4 ± 3.6 seasons). The 3 most common locations for open fracture were the tibia/fibula (n = 16), hand/finger (n = 12), and forearm/wrist (n = 3). A total of 30 (81%) players had a mean time of RTS of 9.3 ± 8.2 months after open fracture; of these players, 4 (13.3%) who sustained hand/finger open fracture did not undergo surgical treatment. There was no difference in postinjury career length or games played per season between control and injured players. Postinjury performance was similar to preinjury performance in injured players, and postinjury performance scores were similar between injured and control players. There were significant differences between players who sustained upper extremity and lower extremity open fractures in RTS time (4.0 ± 4.8 vs 14.6 ± 7.4 months, respectively; P = .00007) and postinjury performance (6.4 ± 4.3 vs 3.3 ± 2.1, respectively; P = .03).
Conclusion:
RTS after open fracture among NFL players was high. Players who sustained an open fracture had similar games played per season, career length, and performance compared with matched controls. Players who sustained an upper extremity open fracture had a faster RTS time, higher RTS rate, and improved postinjury performance compared with players who sustained a lower extremity open fracture.
Open fractures are characterized by varying degrees of both soft tissue and osseous injury. 7,17 The incidence of open fractures is 31 per 100,000 people each year. 4,5 These injuries typically result from a crush, motor vehicle accident, fall from height, penetrating foreign body, or high-impact direct blow to the appendicular skeleton. Injuries to the lower extremity tend to be more severe and are associated with more soft tissue damage than are those that occur in the upper limbs. 5
These injuries are challenging, as the wound communicates with the outside environment, exposing internal structures to foreign bacteria, and are associated with compromised vascular supply to the affected bone. 4 Treatment principles for open fractures rely on effective management of soft tissue damage in the zone of injury, adequate skeletal stabilization of the fractured bone, minimization of the risk of infection, and restoration of function to the injured extremity. 3 –5,12,13
In athletes, open fractures occur in isolation during contact sports such as football, rugby, or soccer as a result of high-energy collision or in noncontact sports such as cycling or gymnastics owing to a fall from height. The wrist, hand, and fingers are particularly prone to fractures in sports resulting from falls on an outstretched hand, crush injuries between 2 surfaces, or a direct blow from a ball. The tibial diaphysis and ankle joint are prone to fracture in sports resulting from a direct blow from an opponent during contact sports or a torsional injury on a variety of competition surfaces in both contact and noncontact sports alike. With regard to open fractures, these injuries make up 1.7% of all sports-related fractures, with a yearly incidence of 0.2 per 1000 people. 16
In collegiate football, all fractures make up 5.7% of total injuries, and 62.5% of fractures result in substantial time lost (>21 weeks). 1,9 In the National Football League (NFL), fractures of the hand and fingers make up 43% of all hand and finger injuries, whereas fractures of the wrist, forearm, and elbow comprise 16% of all wrist, forearm, and elbow injuries. 2,11 NFL players undergoing forearm fracture open reduction internal fixation (ORIF), ankle fracture ORIF, and tibial intramedullary nailing have a variety of time lost and return to sport (RTS) at a rate of 96.3%, 78.6%, and 90.9%, respectively. 10,14 However, these studies have not specifically studied open fractures.
There are no published studies to date reporting on the incidence and RTS performance statistics after open fracture in NFL athletes. Information such as this would be useful for players and team personnel alike in establishing realistic goals for performance and career longevity after RTS. Therefore, the purpose of this study was to determine (1) the RTS rate of NFL players after open fracture, (2) the postinjury career length and games played per season, (3) the pre- and postinjury performance, and (4) the postinjury performance compared with matched controls.
We hypothesized that NFL players who sustained an open fracture during their career would have (1) a high RTS rate, (2) a significantly shorter postinjury career length and fewer games played per season than would matched controls, (3) significantly worse postinjury performance scores compared with preinjury, and (4) significantly worse postinjury performance when compared with that of matched controls.
Methods
Players in the NFL who sustained an open fracture, both in practice and games, were evaluated. Seasons between 1970 (the year of NFL merger completion) and 2018 were included; the 2018 to 2020 seasons were excluded. These players were identified via NFL team websites, publicly available internet-based injury reports, player profiles, and press releases. The search was conducted manually by 1 orthopaedic surgery resident (M.O.C.) and 1 fourth-year medical student (J.M.S.). Searches were performed for all NFL teams and players, including teams that had changed names and/or relocated.
Inclusion criteria were any NFL player on an active roster before open fracture. Athletes who sustained open fracture before playing in their first NFL regular-season game were excluded. In addition, online reports that were conflicting or incomplete were excluded from the study. RTS was defined as a player participating in any single NFL game after an open fracture.
Descriptive variables, including age, position, prior professional experience, and date of injury were recorded. Players were categorized by position, including quarterback (QB), wide receiver (WR), running back (RB), tight end (TE), offensive lineman (OL), defensive lineman (DL), linebacker (LB), and defensive back (DB). Performance statistics were collected from www.pro-football-reference.com for each player identified before and after open fracture. Statistics were included for regular season and playoff games only, with preseason games excluded.
A control group was selected: 1 control player was selected per injured player. Controls were matched to injured players based on position, age (±1 year), years of experience (±1 year), and performance data before injury date. Each control was given an index date (relative to career length), which matched the injured player’s date of injury.
Statistics for injured players pre- and postinjury and control players pre- and postindex were collected and aggregated. Player performance score was then calculated by using a previously published and standardized scoring system based on metrics important to the player’s specific position (Table 1). 15 To account for the inconsistencies in number of games played per season, each category was divided by games played.
Performance Score Formula by Position

All positions were included in RTS, games played per season, and career length analysis. Positions without previously defined performance scores (ie, OL) were excluded from performance score analysis. Comparisons between injured and control groups and pre- and postoperative time points were made using paired-samples Student t tests, with significance set at P < .05. The preindex performance data in the control players were similar to preinjury performance data in injured players, both as a whole and by position (P > .05 for all).
Results
A total of 37 open fractures in 37 players were analyzed. The mean age at time of injury was 27.2 ± 3.6 years, and the mean experience in the NFL at time of injury was 4.4 ± 3.6 seasons. The WR position represented the largest proportion of players who sustained open fracture, with 10 (27%) players. A total of 30 players (81%) were able to RTS in the NFL after injury. The mean time to RTS was 9.3 ± 8.2 months (Table 2). Of those that returned to sport, four players (13.3%) did not undergo surgery to treat their open fracture; all players had sustained hand/finger open fractures.
Number of Open Fractures With Return to Sport Data by Position a

a DB, defensive back; DL, defensive lineman; LB, linebacker; OL, offensive lineman; QB, quarterback; RB, running back; RTS, return to sports; WR, wide receiver.
Postinjury performance in players who returned to sport was similar to postindex performance in controls in terms of career length (4.3 ± 2.9 vs 4.4 ± 3.3 seasons, respectively; P = .76) and games played per season (11.5 ± 4.0 vs 11.3 ± 3.8 games, respectively; P = .84). Postinjury performance scores for injured players were also similar to preinjury performance scores (5.0 ± 3.6 vs 5.5 ± 4.6; P = .24). Overall, postinjury performance scores among players who sustained an open fracture and returned to sport were similar to postindex scores of control players (5.0 ± 3.6 vs 4.7 ± 4.0; P = .60). This was also the case for performance scores when analyzed by position group, although the QB position was close to showing significant decline in play in postinjury performance versus preinjury performance among injured players (16.1 ± 4.7 vs 12.7 ± 3.5; P = .08) (Figure 1).

Mean performance scores by position before and after open fracture compared with controls pre- and postinjury. DB, defensive back; DL, defensive lineman; LB, linebacker; QB, quarterback; RB, running back; WR, wide receiver.
There were 17 (46%) players with upper extremity open fractures (12 of which involved the hand/finger) and 20 (54%) with lower extremity open fractures (16 were specifically designated as tibia/fibula) (Figure 2).

Anatomic locations of open fractures in the National Football League (NFL).
The postinjury performance scores for the injured players were similar to those of matched controls (6.4 ± 4.3 vs 8.6 ± 14.8, P = .50, for upper extremity; 3.3 ± 2.1 vs 3.5 ± 2.7, P = .77, for lower extremity), although control players’ scores were higher for both. However, players who sustained an upper extremity open fracture (with hand/finger injuries included) performed significantly better postinjury when compared with players who sustained an open fracture to a lower extremity (6.4 ± 4.3 vs 3.3 ± 2.1; P = .03). The RTS time was also significantly shorter for players who sustained an upper extremity open fracture (with hand/finger injuries included) compared with players who sustained lower extremity open fracture (4.0 ± 4.8 vs 14.6 ± 7.4 months; P = .00007). Likewise, the RTS rate for players sustaining an upper extremity open fracture was 88% and for players sustaining a lower extremity open fracture was 75%. However, when hand/finger open fractures were excluded from the results, players with upper extremity open fractures were similar in all performance categories to their control matched players. This group also had similar RTS time (9.1 ± 5.0 vs 14.6 ± 7.4 months, P = .18) and postinjury performance (3.0 ± 1.6 vs 3.3 ± 2.1, P = .82) compared to players with lower extremity open fractures. RTS rate was 80% for the upper extremity group when hand/finger open fractures were excluded.
There was no statistically significant (P > .05) difference in age or experience preinjury or career length or games played per season postinjury between injured players and matched controls (Tables 3 and 4).
Age and Experience for Each Position at Time of Injury (for Injured Players) and Index Time (for Controls) a
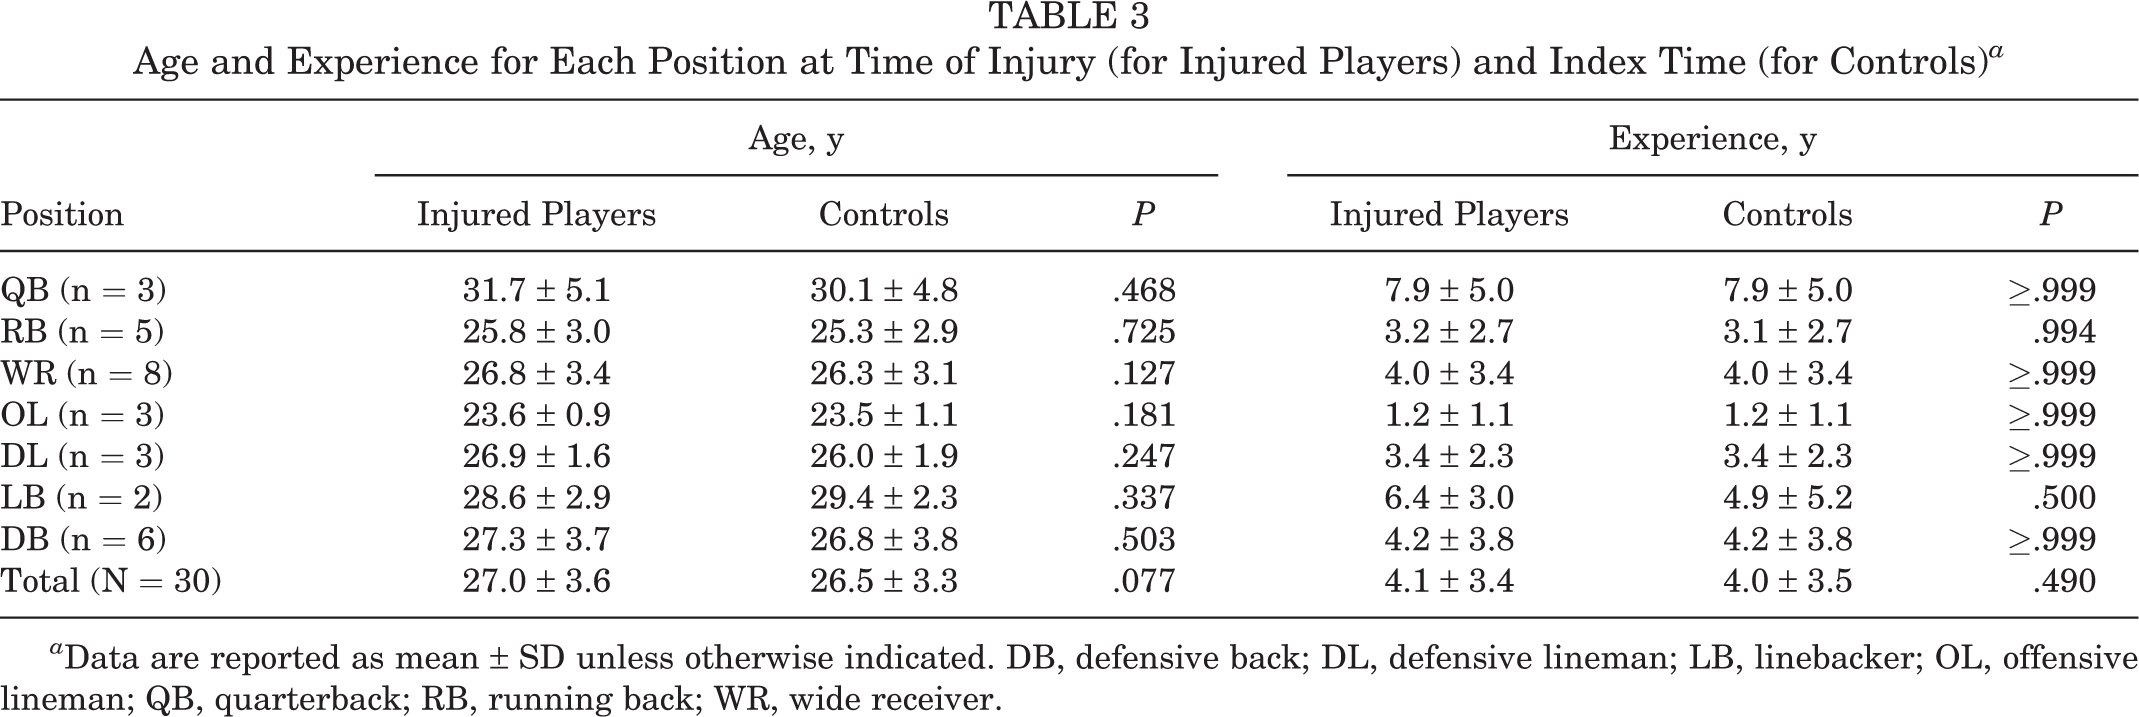
a Data are reported as mean ± SD unless otherwise indicated. DB, defensive back; DL, defensive lineman; LB, linebacker; OL, offensive lineman; QB, quarterback; RB, running back; WR, wide receiver.
Games Played per Season and Career Length Postinjury and Postindex for Injured Players and Controls a

a Data are reported as mean ± SD unless otherwise indicated. DB, defensive back; DL, defensive lineman; LB, linebacker; OL, offensive lineman; QB, quarterback; RB, running back; WR, wide receiver.
Discussion
Our retrospective study of open fractures in the NFL revealed no statistically significant difference between preinjury and postinjury performance among NFL players who sustained an open fracture or between matched control players and NFL players sustaining an open fracture, with regard to postinjury career length, games played per season, or performance scores.
One previous study 16 investigated the epidemiology of sports-related open fracture at a single center in the United Kingdom over 15 years and demonstrated an annual incidence of 0.01 per 1000 population. Soccer and rugby were the 2 most common sports in which players sustained an open fracture, most commonly of the finger phalanx and tibial diaphysis. The popularity of American football, and the NFL in particular, necessitates further study of sports-related open fracture in the United States. Previous studies of NFL athletes have evaluated RTS and performance after a variety of orthopaedic injuries. 6,8,15 However, there have been no studies to the best of our knowledge that have compared RTS and performance scores after open fracture. The current study was able to consolidate open fracture data in the NFL and evaluate RTS percentage and players’ performance scores compared with preinjury performance and against controls matched for age, NFL experience, and performance.
The overall RTS rate was 81%. There were no differences between injured and control players in career length and games played per season postinjury and postindex. Injured player performance was similar postinjury relative to preinjury and to postindex matched controls. These findings indicate that despite the high energy and trauma involved in open fractures, these injuries did not have an effect on career length or performance. This information is pertinent for NFL teams and players for future career projections after open fracture and could reassure patients that there is a high likelihood of return to play. This information could also play a role in salary and contract negotiations.
Differences did appear when players who sustained upper extremity open fractures (with hand/fingers included) were compared against those who sustained lower extremity open fractures. The RTS rate for the entire upper extremity group was 88%, whereas the RTS was 75% for the lower extremity open fracture group. The RTS time was also significantly shorter for players who sustained an upper extremity open fracture (with hand/finger injuries included) compared with players who sustained lower extremity open fracture (4.0 ± 4.8 vs 14.6 ± 7.4 months; P = .00007). This is particularly highlighted by the short RTS time for LB (0.7 ± 0.6 months) and the fact that the 4 players who received nonoperative management had sustained an open fracture to the hand/finger. These findings could signify that upper extremity open fractures of the hand/fingers can be managed nonoperatively and using buddy-taping/wrapping so that the player may RTS faster and without a decrease in performance. Furthermore, players who sustained an upper extremity open fracture (with hand/finger injuries included) performed significantly better postinjury when compared with players who sustained an open fracture to a lower extremity (6.4 ± 4.3 vs 3.3 ± 2.1; P = .03). However, there was no significant difference in postinjury performance of players with upper extremity open fractures when compared with that of control players (6.4 ± 4.3 vs 8.6 ± 14.8, respectively; P = .50).
Given that finger fractures/dislocations are common in professional football, a second upper extremity group that did not contain players with hand/finger open fractures was included. 11 In this group, there was no statistical difference between RTS time and postinjury performance relative to that of players with lower extremity open fractures. These findings may be a result of less traumatic force causing open fractures of the finger/hand, whereas a lower extremity or more proximal upper extremity open fracture requires higher energy and likely incurs greater soft tissue damage. This is reflected in the management of these fractures, and hand/finger open fractures have the potential for nonoperative management and buddy-taping/wrapping. Thus, the rehabilitation after open fracture of the hand/finger would be less significant, and those players would have a higher RTS rate, faster RTS, and better performance score compared with players who sustained a lower extremity open fracture.
When categorized by position, the largest number of open fractures occurred in WRs (n = 10), DBs (n = 7), QBs (n = 5), and RBs (n = 5). The remaining open fractures occurred in OLs (n = 4), DLs (n = 4), and LBs (n = 2), with 0 in TEs. Six of the 8 linemen sustained lower extremity fractures. The remaining 29 position players were divided as having 15 upper extremity open fractures and 14 lower extremity open fractures. This distribution indicates that being a ball carrier, WR, or DB, and thus more likely to play farther from the interior line of scrimmage, could be a risk factor for sustaining an open fracture. These players typically are moving at increased speeds before collision, and their positions require more repetitive jumping and landing movements, which may be the cause for this increased risk.
There are several limitations to the current study. The use of publicly available data to identify open fractures among NFL players is subject to selection, reporting, and observer bias. Previous studies, however, have used this as a viable method of data collection. 6,8,10,15 Unfortunately, many of the records of the injuries in the study did not specify the details of fracture location, and radiographs were not available from the injuries. Furthermore, the Gustilo-Anderson classification, extent of soft tissue injury, antibiotic administration, and exact treatment method (including time to surgery) for each injury were limited by this method. This limited our ability to further evaluate open fractures in a detailed orthopaedic manner (such as an open ankle fracture versus open pilon fracture or open “both-bone” forearm versus open distal radial fracture). The study population (N = 37) was also a limitation and may subject the study to possible beta error. Stratifying the importance of the site of open fracture by position (such as an open fracture to a QB’s throwing hand versus nonthrowing hand) was also limited by the number of injuries found and would be an interesting topic of study in the future. Last, other limitations include inability to compare performance scores for OL, career length of players still playing in the NFL, and the absence of patient-reported outcomes and complete follow-up.
Conclusion
The rate of RTS after open fracture among NFL players was high. Players who sustained an open fracture had similar games played per season, career length, and performance compared with matched controls. Players who sustained an upper extremity open fracture had a faster RTS time, higher RTS rate, and improved postinjury performance compared with players who sustained a lower extremity open fracture.
Footnotes
Final revision submitted January 26, 2021; accepted February 24, 2021.
One or more of the authors has declared the following potential conflict of interest or source of funding: P.C.M. has received research support from Arthrex and DePuy, educational payments from Arthrex, consulting fees from Smith & Nephew, and honoraria and nonconsulting fees from Vericel. J.D.H. has received research support from Arthrex, DePuy, and Smith & Nephew; consulting fees from NIA Magellan and Smith & Nephew; speaking fees from Ossur and Smith & Nephew; and royalties from SLACK. R.A.J. has received education payments from Liberty Surgical. AOSSM checks author disclosures against the Open Payments Database (OPD). AOSSM has not conducted an independent investigation on the OPD and disclaims any liability or responsibility relating thereto.
Ethical approval was not sought for the present study.