



Abstract
Background:
The evidence in support of operative versus nonoperative management of rotator cuff tears (RCTs) is limited, based primarily on observational studies of lower scientific merit.
Purpose:
To (1) compare the efficacy of operative versus nonoperative management of full-thickness RCTs across time and (2) detect variables that predict success within each group.
Study Design:
Cohort study; Level of evidence, 2.
Methods:
We included patients with symptomatic full-thickness RCTs who were enrolled in an institutional shoulder registry. Patient enrollment began in 2009 and continued until early 2018. The following outcome measures were collected at baseline, then 6 months, 1 year, and annually up to 5 years postoperatively: Western Ontario Rotator Cuff Index (WORC), American Shoulder and Elbow Surgeons (ASES) score, Veterans RAND 12-Item Health Survey (VR-12) mental and physical component subscales (MCS and PCS, respectively), 100-point Single Assessment Numeric Evaluation (SANE) rating, and 100-point visual analog scale (VAS) for pain and for patient satisfaction. We performed regression models for all outcome variables across all 5 years of follow-up and included the following predictor variables: treatment type (operative vs nonoperative), sex, age, symptom duration, smoking status, diabetes status, injury side, and obesity status.
Results:
A total of 595 patients were included. Longitudinal mixed-effects regression revealed that patients who received operative treatment did better across time on all outcomes. Women (n = 242; 40.7%) did not fare as well as did men on the ASES, WORC, or VR-12 PCS. Older patients tended to improve less on the VR-12 PCS and more on the VR12-MCS. Patients with longer symptom duration at baseline had better scores across time on the ASES, WORC, VAS for pain, and SANE. Current or recent smokers and patients with diabetes tended to have lower scores on all measures across time. For changes in scores from baseline, patients in the operative group improved to a larger degree out to 3 years compared with those in the nonoperative group.
Conclusion:
Patients with RCTs tended to improve regardless of whether they received operative or nonoperative treatment, but patients who underwent operative treatment improved faster. There appear to be several predictors of improved and worsened outcomes for patients with RCTs undergoing operative or nonoperative treatment.
Keywords
Rotator cuff disease is one of the most common musculoskeletal disorders in the adult population. 48 Nearly 20 million Americans reported shoulder pain in 2012 alone, establishing shoulder pain second only to knee pain in prevalence of joint pain. Imaging and cadaveric studies have revealed that >30% of individuals aged >60 years will have a full-thickness rotator cuff tear (RCT). ∥ With the aging of the baby boomer generation, we can expect the prevalence of rotator cuff disorders to increase significantly over the next 2 decades.
RCTs are a significant cause of disability in adults and are associated with chronic pain, weakness, and dysfunction of the upper extremity. 29,31,32 Patient-reported outcomes suggest that shoulder dysfunction is associated with a compromise in an individual’s health status similar to that seen in major medical diseases including congestive heart failure, acute myocardial infarction, diabetes mellitus, and clinical depression. 9 Shoulder dysfunction is associated with high societal cost and patient burden. In 2007, a reported 76,000 work-related shoulder injuries and illnesses involving days away from work occurred in the United States. 49 In 2000, the direct costs for the treatment of shoulder dysfunction in the United States totaled $7 billion. It is estimated that between 75,000 and 250,000 rotator cuff surgeries take place nationally every year. 30,50
Our understanding of the natural history of the full-thickness RCT is evolving. 51 It is clear that the rotator cuff has no inherent capacity to heal without surgical intervention. It is also clear that the untreated RCT will generally increase in size over time, resulting in tendon retraction and irreversible muscle atrophy. 10,53 Treatment options for the symptomatic RCT include operative and nonoperative interventions. 1,26 Although most surgeons favor surgical repair of the acute traumatic RCT in the younger adult population, there are no clear guidelines regarding RCTs in older individuals. Current dogma favors a trial of physical therapy in older individuals, followed by surgical repair in those who demonstrate no improvement. 1 But there is no clear evidence to support this practice. Generally, the evidence in support of operative versus nonoperative management of rotator cuff disease is limited, based primarily on observational studies of lower scientific merit and a small number of randomized controlled trials. 27,45 A clinical practice guideline and evidence report adopted by the American Academy of Orthopaedic Surgeons in 2010 revealed the paucity of existing evidence. 40 Similarly, multiple systematic reviews focusing on treatment options for RCTs have revealed insufficient evidence to support or refute the effectiveness of operative versus nonoperative management of this common disorder. 11,44
The lack of equipoise to guide the treatment of rotator cuff disease warrants continued research to help elucidate treatment effects and predictors for this common disorder. 41 The objectives of the current study were to (1) compare the efficacy of operative versus nonoperative management of full-thickness RCTs and (2) detect variables that predict success within each treatment group. These findings could help with the prediction of treatment success or failure for patients with RCTs.
Methods
Study Population and Recruitment
The study inclusion criteria included age ≥18 years, RCT of any size confirmed via magnetic resonance imaging and/or diagnostic musculoskeletal ultrasound, 38,39 unilateral tear, first tear of the affected shoulder, and nonoperative treatment for <4 weeks. Exclusion criteria were a cuff tear in which complete footprint coverage was not possible; any history of prior surgery, fracture, dislocation, or infection of the affected shoulder; inflammatory joint disease of the affected shoulder, including rheumatoid arthritis; and open repair, including the subscapularis. Institutional review board approval was received for the study protocol.
Patient recruitment occurred at a single center (MedSport, University of Michigan). Patients who were seen for management of symptomatic full-thickness RCTs were enrolled by research assistants in our shoulder registry, and clinical data were collected prospectively. The research assistants provided interested patients with an informed consent document and asked them to sign it if they agreed to participate; the research assistants then asked consenting participants to complete a variety of outcome measures using either paper and pencil or a touch screen computer (eg, iPad [Apple Inc]). Patient enrollment began in 2009 and continued until early 2018.
Data Collection
Paper-based and electronic data collection was used. At baseline, participants provided all characteristic information and completed all outcome measures described in the following section. Follow-ups with all outcome measures were at 6 months, 1 year, and annually thereafter up to 5 years postoperatively. Participants received reminders to complete their web-based or paper-based forms just before these follow-up times, and reminders were sent to individuals not completing forms within 2 weeks of these dates. Emails and mailings contained our contact information for participants who had questions. The data were entered into preformatted Excel (Microsoft Corp) spreadsheets and uploaded into STATA/MP 14.2 statistical software (STATA Corp).
Characteristic and Baseline Data
We collected the following information at baseline for all included participants: age, sex, weight, height, workers’ compensation status (yes or no), smoking status, shoulder range of motion, tear size, tear location, days since injury, cause of injury, medical history, physical examination information, and patient-reported outcome measures (described in the following section). Rotator cuff repair was performed arthroscopically and was followed by 4 to 6 weeks of immobilization and a standardized postoperative physical therapy protocol. The repair technique was not standardized, but tears of <1 cm were repaired using a single-row technique, and tears of >1 cm were repaired using a double-row technique. Nonoperative treatment included a standardized physical therapy protocol using anti-inflammatory medication and corticosteroid injections for symptom control.
Patient-Reported Outcome Measures
The following patient-reported outcome measures were used: Western Ontario Rotator Cuff Index (WORC), American Shoulder and Elbow Surgeons (ASES) score, Veterans RAND 12-Item Health Survey (VR-12), 100-point Single Assessment Numeric Evaluation (SANE) rating, and visual analog scale (VAS) for pain and for patient satisfaction. 7,43
The WORC is a valid and reliable disease-specific, quality-of-life assessment tool with scores ranging from 0 to 100; a higher score indicates worse function. The WORC has been shown to be valid, reliable, and responsive. 14,24,28 The ASES score was developed in 1994 42 and is divided into 3 domains: pain, which includes several yes or no questions and a VAS; instability, which includes 1 yes or no question and a VAS; and activities of daily living. Higher scores indicate better function. Construct validity, internal consistency, and reliability have been shown to be good. 2,4,6,14,25,33 The VR-12 12,20 –22 was developed from the RAND 36-Item Health Survey, used to measure health-related quality of life and to estimate disease burden. The 12 items are summarized into 2 scores, a physical component score (PCS) and a mental component score (MCS).
The SANE was designed as a simple 1-question functional assessment tool. The single included question was “How would you rate your shoulder today as a percentage of normal (0%-100%, with 100% being normal)?” 3,19,23,52 In addition, we measured pain and patient satisfaction on separate 100-point VASs. Finally, we collected all patient-reported adverse events.
Intervention Groups
Treatment allocation was determined by patient and physician agreement. Therefore, the interventions varied within and between the operative and nonoperative groups.
Sample Size Calculation
Our primary outcome measure was the WORC score change from baseline to 2-year follow-up. The minimal clinically important difference (MCID) of the WORC is 245.26 (11.7%). 24 To detect an 11.7% difference in the WORC from baseline (null hypothesis = 10% change; alternative hypothesis = 21.7% change) at 2 years postoperatively at 80% power with a cutoff P value of .05, we required a total of 64 patients (32 per group).
Statistical Analysis
First, we describe the patient, injury, and related characteristics across included patients by using raw counts, measures of central tendency (eg, mean, median, or mode), and measures of data dispersion (eg, 95% confidence intervals [CIs]), standard errors, interquartile ranges) where appropriate. Comparisons between the operative and nonoperative groups for each independent variable of interest were carried out using the Student t test for continuous variables and the χ2 test for categorical variables. We constructed scatterplots and bar charts of all outcome measures to visually inspect data. We calculated change scores for each outcome measure using baseline values and each patient’s outcome at all follow-up points, and we report CIs and P values for these changes.
Next we performed longitudinal mixed-effects linear regression models (patient identification number as the random variable) for all outcome variables across all 5 years of follow-up for the entire sample, including the following predictor variables: age (in years), treatment type (nonoperative, coded as 0; operative, coded as 1), sex (male = 0, female = 1), symptom duration (<1 y = 0, ≥1 y = 1), smoking status (never = 0, current or quit <6 mo ago = 1), diabetes status (no = 0, yes = 1), injury side (left = 0, right = 1), and obesity status (no = 0, yes = 1). We also performed mixed-effects linear regression modeling for changes from baseline to postoperative years 1, 2, 3, and 4 only (to maintain power) on all outcome variables for all predictor variables listed earlier. 8,46 The mixed-effects modeling allowed us to incorporate individual patient differences as the random effect and the group or time point as the fixed effect, with the dependent variable being the continuous outcome measures described earlier.
Finally, we performed a subgroup analysis for patients who had prior self-reported formal physical therapy (n = 102) of <4 weeks (ie, formal sessions with a physical therapist, with or without a home exercise program) and then proceeded to surgery. We specifically looked at this variable because it was deemed that this subgroup may have different risk than others may have. We looked at changes from baseline for our primary outcome measure, the WORC, and for a secondary outcome measure, the ASES score. We then performed linear regression analyses for the outcome variable of the change in WORC score at 1 and 2 years for all predictor variables in univariable unadjusted models.
Results
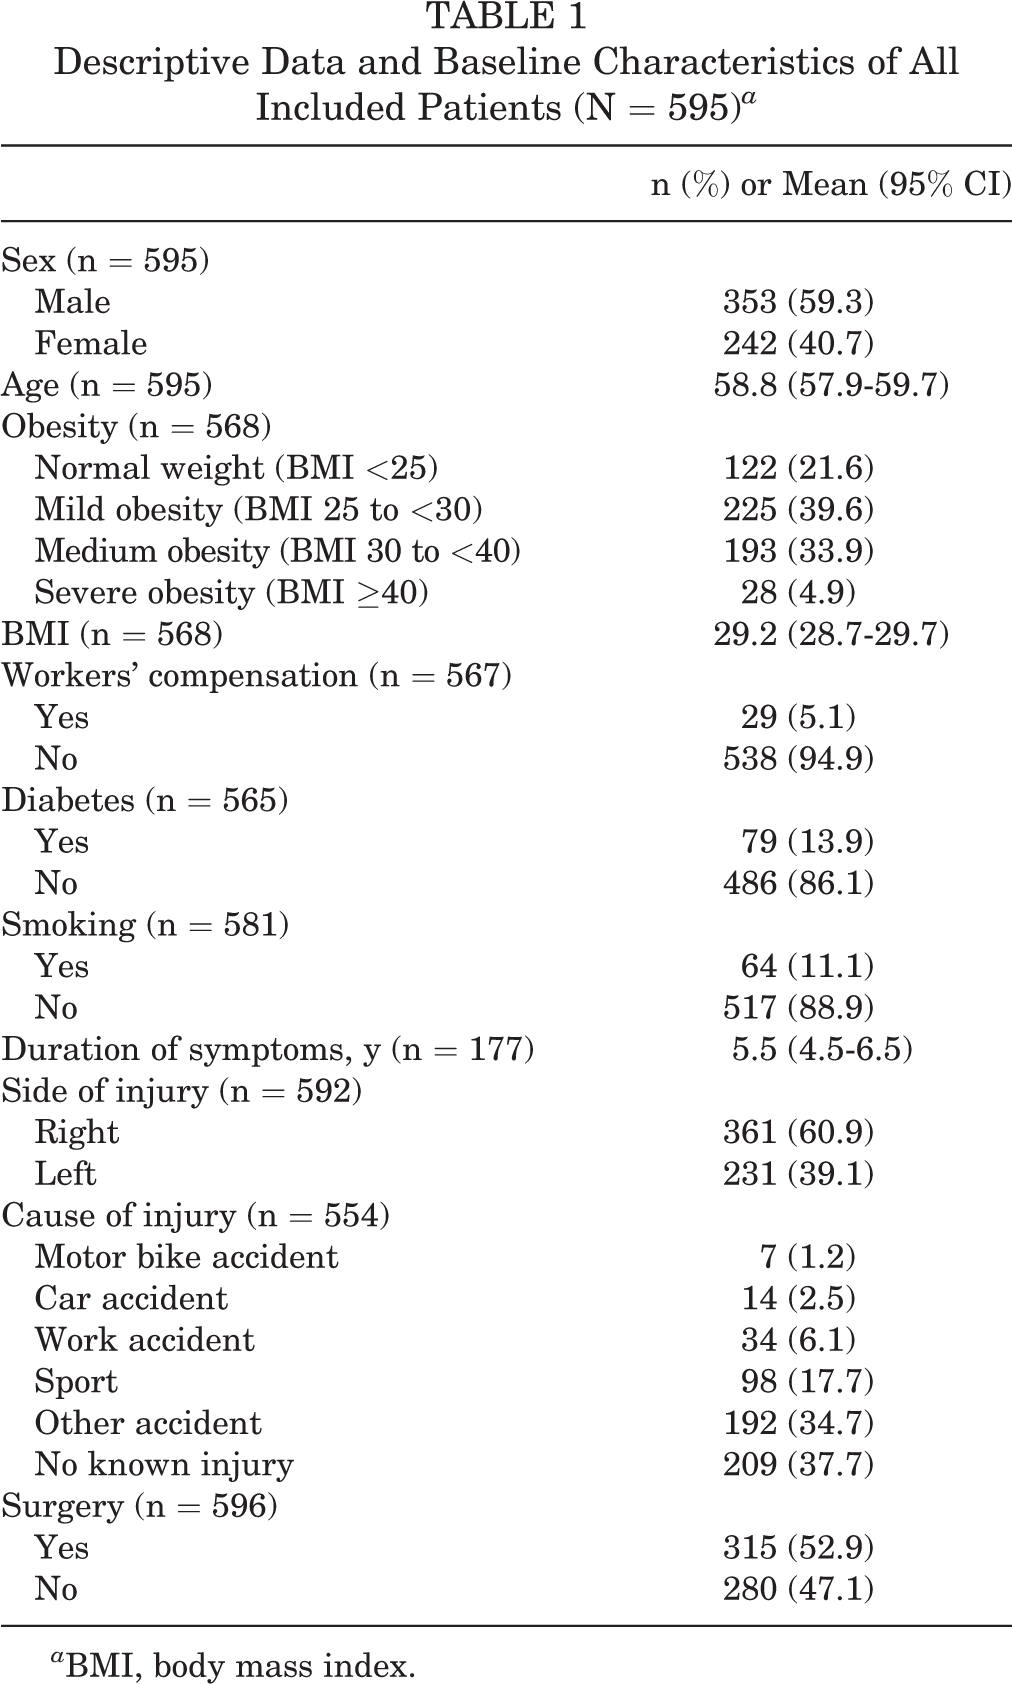
A total of 595 patients agreed to be included in the registry, which represented approximately 75% of presenting and eligible patients. Tables 1 and 2 describe the characteristics of the sample. Figure 1 illustrates sample sizes for each follow-up point.
Descriptive Data and Baseline Characteristics of All Included Patients (N = 595) a
a BMI, body mass index.
Patient Characteristics Between the Operative and Nonoperative Study Groups a

a Data are reported as n (%) unless otherwise indicated. OR, odds ratio.
b Student t test.

Sample sizes for each follow-up point for the primary outcome.
Immediately after inclusion into the registry, approximately 35% of the participants did not return to our clinical location and thus did not continue in the registry follow-up. After this initial loss to follow-up, >90% of the included patients had at least 2 years of follow-up. After 2 years, although the sample size decreased across time, these were not losses to follow-up. Rather, these were primarily due to the enrollment date in our registry. Overall, the sample included more men (59.3%), the average age was almost 59 years, 78% were obese, 13.9% had diabetes, 5% were receiving workers’ compensation, and 11% were current or recent past (<6 months) smokers. The mean duration of symptoms at baseline was 5.5 years, most patients had right-sided injuries (60.9%), most had an accident as a cause of injury, and more than half (52.9%) had undergone surgery. Table 2 describes several patient characteristics of the included participants separately for those patients undergoing operative and nonoperative treatment. Those allocated to operative treatment were more likely to be current or recent smokers (odds ratio, 1.69) and tended to be younger by 3.8 years. Table 3 contains injury characteristics by treatment allocation; there were no significant differences between the study groups.
Injury Characteristics Between Study Groups a

a Data are reported as n (%) unless otherwise indicated. OR, odds ratio.
b Student t test.
The box plots in Figure 2 illustrate scores on all outcome measures at baseline and at all follow-up points separately for operative and nonoperative treatment. In Table 4, we report the raw scores for operative and nonoperative groups for all patient-reported outcomes at each follow-up point up to 5 years. As can be seen, the sample sizes were <200 per group after 3 years of follow-up partly because of attrition but mostly because of the enrollment dates of patients. Generally, baseline scores were worse for the operative group, but by 6 months, the scores for the operative group had surpassed those of the nonoperative group. The scores appeared to change very little in the operative group after 1 year, but scores appeared to continue to change (ie, improve) in the nonoperative group out to 3 and 4 years. Table 5 reports the absolute changes from baseline to the 4-year follow-up for all outcome measures, stratified by intervention group.

Box plots for all outcome measures stratified by treatment. ASES, American Shoulder and Elbow Society; VAS, visual analog scale; VR-12, Veterans RAND 12-Item Health Survey; WORC, Western Ontario Rotator Cuff Index.
Patient-Reported Outcome Scores at Baseline and All Follow-up Points a

a Values are expressed as mean score (95% CI). ASES, American Shoulder and Elbow Surgeons; MCS, mental component subscale; PCS, physical component subscale; SANE, Single Assessment Numeric Evaluation; VASPain, visual analog scale for pain; VASPatSat, visual analog scale for patient satisfaction; VR-12, Veterans RAND 12-Item Health Survey; WORC, Western Ontario Rotator Cuff Index.
Absolute Changes in Outcome Scores From Baseline at Each Follow-up a

a Values are expressed as change from baseline (95% CI). ASES, American Shoulder and Elbow Surgeons; MCS, mental component subscale; PCS, physical component subscale; SANE, Single Assessment Numeric Evaluation; VASPain, visual analog scale for pain; VASPatSat, visual analog scale for patient satisfaction; VR-12, Veterans RAND 12-Item Health Survey; WORC, Western Ontario Rotator Cuff Index.
The longitudinal mixed-effects regression reported in Table 6 reveals several trends across total outcome scores for the included predictor variables. Patients in the operative group did better on all outcome measures across time. Female patients did not score as well across time as did male patients on the ASES, WORC, and the VR-12 PCS. Those who were older tended to improve less on the PCS and more on the MCS, and those with a longer symptom duration at baseline did better across time on the ASES, WORC, VAS pain, and SANE scores. Current or recent smokers tended to have lower scores on all measures across time, as did those patients with diabetes. Injury sidedness and the presence of obesity had no effect on outcomes across time.
Longitudinal, Fully Adjusted, Mixed-Effects Linear Regression Modeling for All Dependent Variables a

a Values are expressed as beta coefficient (95% CI); P value. Bolded P values indicate statistical significance at P < .05. ASES, American Shoulder and Elbow Surgeons; MCS, mental component subscale; Nonop, nonoperative; Op, operative; PCS, physical component subscale; SANE, Single Assessment Numeric Evaluation; VASPain, visual analog scale for pain; VASPatSat, visual analog scale for patient satisfaction; VR-12, Veterans RAND 12-Item Health Survey; WORC, Western Ontario Rotator Cuff Index.
Mixed-effects linear regression for change from baseline is reported in Table 7 for treatment type and for all covariates for each year of follow-up to 4 years to maintain power, according to our sample size calculation for our primary outcome. The operative group, when compared with the nonoperative group, routinely changed to a larger degree out to 3 years for the WORC, ASES, VAS pain, and VR-12 PCS and at years 1 and 2 for the SANE; however, VAS satisfaction scores were better in the operative group only at 1 year, and the VR-12 MCS score was not superior in either group at any point. On average, older patients tended to have less change at each year of follow-up than younger patients had, and those with longer symptom duration tended to change more at each year of follow-up on the WORC, VAS pain, and VR-12 MCS. Also, patients with diabetes tended to change less at year 1 follow-up for all outcome measures but changed more or less in a varied fashion across all other years of follow-up. Generally, sex, smoking, injury side, and obesity did not have any influence on changes from baseline in these patients.
Mixed-Effects Linear Regression for Changes From Baseline a

a Values are expressed as beta coefficient (95% CI); P value. Bolded P values indicate statistical significance at P < .05. Dashes indicate no data. ASES, American Shoulder and Elbow Surgeons; MCS, mental component subscale; Nonop, nonoperative; Op, operative; PCS, physical component subscale; SANE, Single Assessment Numeric Evaluation; VASPain, visual analog scale for pain; VASPatSat, visual analog scale for patient satisfaction; VR-12, Veterans RAND 12-Item Health Survey; WORC, Western Ontario Rotator Cuff Ind\ex.
Tables 8 and 9 show the results of the subgroup analysis for patients who had formal physical therapy before being enrolled in our registry. Descriptive data and baseline characteristics are listed in Table 8. Comparing Table 8 with Table 5 reveals very little differences between the samples. However, comparing Table 9 with Table 5 indicates that patients with formal physical therapy who then underwent surgery appeared to improve to an even greater degree (within this subgroup), but the nonoperative group did not improve as much. Also, in this subgroup, linear regression for our primary outcome of change in the WORC score from baseline to 1 and 2 years of follow-up revealed that none of the chosen covariates were significantly predictive for change in the WORC score.
Descriptive Data and Baseline Characteristics of Patients Who Had Formal Physical Therapy Before Study Inclusion (n = 102) a

a BMI, body mass index.
Subgroup Analysis for Absolute Change From Baseline for WORC and ASES for Patients Who Had Formal Physical Therapy Before Study Inclusion a

a Values are expressed as change from baseline (95% CI). ASES, American Shoulder and Elbow Surgeons; WORC, Western Ontario Rotator Cuff Index.
Discussion
In this cohort study of patients included in the Michigan Shoulder Registry, we found that patients with rotator cuff disease who presented for treatment were on average 58.8 years of age and had >5 years of self-reported shoulder symptoms; operatively treated patients did better than did nonoperatively treated patients across all follow-up points on all outcome measures, although the magnitude of this superior effect was modest in most cases. Just over 50% of the patients underwent surgery, and these patients were more likely to be younger and to be current or recent (quit <6 months ago) smokers. Upon visual inspection of trends in scores on all outcome measures, the operative group tended to improve faster, with little additional improvement after 1 year of follow-up, and the nonoperative group appeared to continue to improve out to years 3 and 4, at which point their improvement approximated that of the operative group on average. This challenges the common conception that shoulder surgical trials require a minimum of 2 years of follow-up; it appears that the minimum follow-up should be dictated by the type of intervention. Furthermore, our regression modeling confirmed these observations, even after controlling for a large selection of confounding variables (see Table 5). For example, for our primary outcome (the change in WORC scores), the magnitude of difference between groups was 10.7%, which is slightly smaller than is the previously established MCID for this measure (11.7%), but the 95% CI for the difference that we found for our sample (6.8%-14.6%) did encompass the MCID. However, we should be cautious when using the MCID to gauge between-patient differences because this is a within-patient metric. Another variable in our adjusted model influenced the longitudinal trends to a larger degree: the presence of diabetes. Specifically, for the WORC, patients with diabetes scored worse by 15.2% even after adjustment for the covariates. Women tended to have worse scores on measures of physical function (ie, ASES, WORC, and VR-12 PCS), but the magnitude of these differences was small. Similarly, those with a longer duration of symptoms tended to do better across time, but the effect size was small. Again, smokers tended to do worse across time, but this effect was small. Furthermore, in our mixed-effects regression for changes from baseline to each follow-up point separately, patients in the operative group tended to change to a larger degree on the WORC out to year 3, although the mean magnitude of effect change became small by year 3. The magnitude of effect for other variables was also small, except for patients with diabetes, who had worse scores on all outcome measures consistently for the first year of follow-up. Sample sizes for all outcome measures were insufficient at the 5-year follow-up. In a subgroup analysis of patients who had a history of formal physical therapy, we found that the operative group appeared to improve to an even greater degree (within this subgroup) but the nonoperative group did not, but no covariates (ie, sex, age, body mass index, workers’ compensation status, diabetes, smoking status, or cause of injury) predicted these changes. More research could determine the underlying factors that could have identified which patients would have had better success with surgery, even in the early stages of physical therapy.
Two recent studies appear to confirm most of our findings, although our study is much larger than are the others. For example, in a cohort study by Jain and colleagues 16 that included 70 patients undergoing nonoperative management of RCTs, the investigators assessed Shoulder Pain and Disability Index scores across time (baseline and at 3, 6, 12, and 18 months). They reported better Shoulder Pain and Disability Index scores across time in those patients with at least a college education, shorter duration of symptoms, light or manual daily work, alcohol use 1 or 2 times per week or more, partial-thickness tears, and absence of fatty infiltration. In a similar study by Jain et al, 17 this time looking at predictors of pain and functional outcomes after operative treatment of RCTs in 50 patients, the investigators reported that patients with higher fear avoidance behavior and alcohol use had worse shoulder pain and function at 18 months after surgery. These latter findings were not tested in our study, as we focused on a different set of predictors. In a study published in 2018, Boorman et al 5 followed patients receiving nonoperative treatment for RCTs; the study included a total of 104 patients initially, 93 of whom were contacted at 2 years of follow-up and 63 of whom completed follow-up at 5 years. The investigators reported that 75% of the patients remained in the nonoperative group at 5 years, 3 patients had subsequent surgery for the tear at 2 to 5 years, and there were no differences in the Rotator Cuff Quality of Life scores between operative and nonoperative groups at 5 years. No predictive modeling was done in the latter study. A systematic review and meta-analysis that included only level 1 or 2 studies found 3 relevant studies that included 269 patients in total with 1 year of follow-up. 40 Across those 3 studies, the operative group had better outcomes than the nonoperative group, but the differences were generally small; the authors concluded that larger, longer-term studies are needed. Our study partially fills these gaps by providing a larger sample size with long-term follow-up and extensive modeling, although more studies are needed. 36
This study has several strengths and limitations. We included a large sample size at baseline that exceeded our sample size requirements for our primary outcome; as well, the sample size exceeded requirements out to year 4 of follow-up for most of our outcome measures and covariates. Therefore, our findings are likely robust for the sample included. However, given that we used convenience sampling, not all included patients were followed up for the same amount of time because their presentation and inclusion dates were variable; for many of the patients, data collection was ongoing. Thus, the sample of patients we had at each follow-up point might have been slightly different from the sample at other points. Another strength is our multilevel regression modeling, controlling for a selection of covariates. This modeling allowed us to determine the influence of a variety of covariates across time for trends and changes in the outcome variables. Therefore, our main findings, that patients with operative treatment have better outcomes and that patients with diabetes fare worse across time, are likely robust. Of course, given the observational nature of this study, we cannot absolutely rule out the influence of unknown and unmeasured effect modifiers or confounding variables. Other findings are also likely robust, although the effect sizes are small; these should be followed up in future research. Specifically, follow-up studies should use stratification on the variables we found that had associations with our outcomes to tease out and confirm the effects of our findings.
One limitation of this study was that our sample was from a single clinical site, potentially limiting the generalizability of the findings. However, we did characterize these patients quite well, and readers can use our descriptions to guide their application of our findings. We only included patients with confirmed, symptomatic RCTs, which also limits the generalizability of our findings yet is a strength of this project because the patients provide a homogeneous sample of pathologies. We did not stratify or control for the size, shape, severity, or location of the tear or concomitant pathologies, which could have resulted in lack of specificity of our findings to particular subgroups of individuals. The concept of heterogeneity of treatment effect is relevant here in that patients with different types of tears could have experienced heterogeneous effects of the interventions, and furthermore, the covariates included could have had variable effect modification on these subgroups. These hypotheses remain to be tested. Furthermore, the exclusion of cuff tears in which a complete footprint coverage was not possible potentially biases the operative group to smaller tears. However, the degree of bias here, if any, is unknown. Finally, we ran 35 separate regression analyses, which increased our risk of a type 1 error. Nonetheless, our analysis for the primary outcome was properly powered, and the modeling was multivariable and adjusted; therefore, we expect these findings to be robust.
Conclusion
Patients with RCTs who underwent both operative and nonoperative treatments tended to improve, and patients who received operative treatment improved faster within the first 3 years. There appear to be several predictors of improved and worsened outcomes that may help us tailor our treatments to individuals with specific characteristics.
Footnotes
Notes
Final revision submitted December 23, 2020; accepted January 25, 2021.
One or more of the authors has declared the following potential conflict of interest or source of funding: Internal funding was received for a portion of this work from the Francis and Kenneth Eisenberg Fund, University of Michigan. A.B. has received consulting fees from Arthrex, Flexion Therapeutics, and Smith & Nephew; nonconsulting fees from Arthrex and Smith & Nephew; royalties from Arthrex and Smith & Nephew; education support from Arthrex and CDC Medical; and hospitality payments from GE Healthcare. B.M. has received consulting fees from FH Orthopedics and Arthrex and royalties, speaking fees, and education support from FH Orthopedics. AOSSM checks author disclosures against the Open Payments Database (OPD). AOSSM has not conducted an independent investigation on the OPD and disclaims any liability or responsibility relating thereto.
Ethical approval for this study was obtained from the University of Michigan.