
Abstract
Background:
Recurrent shoulder instability may be associated with glenoid erosion and bone loss. Accurate quantification of bone loss significantly influences the contemplation of surgical procedure. In addition, assessment of bone loss is crucial for surgical planning and accurate graft placement during surgery.
Purpose:
To quantify the concave surface area of glenoid bone loss by using 3-dimensional (3D) segmented models of the scapula and to compare this method with the best-fit circle and glenoid height/width methods, which use the glenoid rim for bone loss estimations.
Study Design:
Cohort study (diagnosis); Level of evidence, 2.
Methods:
A total of 36 consecutive preoperative bilateral computed tomography scans of patients eligible for a primary Latarjet procedure were selected from our institutional surgical database (mean patient age, 29 ± 9 years; 31 men and 5 women). The 3D models of both scapulae were generated using medical segmentation software and were used to map the anatomic concave surface area (ACSA) of the inferior glenoid using the diameter of the best-fit circle of the healthy glenoid. Bone loss was calculated as a ratio of the difference between surface areas of both glenoids (healthy and pathological) against the anatomic circular surface area of the healthy glenoid (the ACSA method). These results were compared with bone loss calculations using the best-fit circle and glenoid height/width methods. Inter- and intraobserver reliability were also calculated.
Results:
The mean (± SD) bone loss calculated using the ACSA, the best-fit circle, and glenoid height/width methods was 9.4% ± 6.7%, 14.3% ± 6.8%, and 17.6% ± 7.3%, respectively. The ACSA method showed excellent interobserver reliability, with an intraclass correlation coefficient (ICC) of 0.95 versus those for the best-fit circle (ICC, 0.71) and glenoid height/width (ICC, 0.79) methods.
Conclusion:
Quantification of instability-related glenoid bone loss is reliable using the 3D ACSA method.
Reports have indicated that shoulder dislocation in Australia amounts to 25% of all shoulder injuries. 19 Anterior shoulder dislocation can lead to glenoid bone loss, which results in recurrent anterior shoulder instability. 30 Glenoid bone loss is an important factor that guides the surgical management of anterior shoulder instability to either a soft tissue stabilization procedure, such as a Bankart repair, or a bony reconstruction, such as the Latarjet procedure. Consequently, the accurate assessment of glenoid bone loss in shoulder instability is believed by many surgeons to be crucial for surgical planning and management. 4,6,30,34
Recurrent shoulder instability is associated with morphological changes in the glenoid rim in up to 90% of cases. 31 Arthroscopic quantification of glenoid bone loss has been reported 5 ; however, extensive literature focuses on the preoperative assessment of the glenoid morphology as well as evaluation of glenoid bone loss in the setting of recurrent anterior shoulder instability. 6,10,12,16,23,24,27,31 The use of 3-dimensional (3D) reconstructed computed tomography (CT) is established as the most accurate imaging modality to evaluate glenoid bone loss preoperatively. 6,21,25,26,30 The use of oblique sagittal images aligned en face to the glenoid fossa when assessing instability-related glenoid bone loss from 3D-CT reconstructions is documented. 12,31 The Sugaya method of estimating glenoid bone loss, also called the best-fit circle method, is based on 3D reconstructed CT images. 30 However, only 2-dimensional (2D) measurements of the glenoid rim are used to calculate the glenoid bone loss as a ratio of the defect width against the diameter of the best-fit circle based on the inferior glenoid rim (Figure 1A). On the other hand, Giles et al 10 utilized a different method to predict native glenoid width for instability-related glenoid bone loss. Two-dimensional glenoid rim measurements are employed to measure glenoid height using CT scans. Mathematical formulas allow for the prediction of the native glenoid width from the glenoid height (the glenoid height/width method). This predicted width can then be compared with the actual glenoid width to assess the amount of glenoid bone loss caused by the bone defect (Figure 1B).

Instability-related glenoid bone loss quantification based on 2-dimensional glenoid rim measurements. (A) The best-fit circle method calculates the ratio of the defect width (dw) against the diameter (D) of the best-fit circle. (B) The glenoid height (h)/width (w) method compares the actual glenoid (w) with the predicted native glenoid w calculated from the h.
Both techniques rely on 2D measurements performed on CT scans or 3D-reconstructed CT images of the pathological glenoid and are not based on the anatomic surface area of the glenoid or defect. Similarly, techniques to quantify instability-related glenoid bone loss calculating 2D surface areas of the glenoid and/or of the bone fragment from the defect are all based on 2D images of 3D-CT reconstruction of the glenoid fossa. These studies do not account for the glenoid concavity. 1 –3,24,31
The morphology of the glenoid cavity is variable, and assessment using a static image of a 3D reconstruction lacks information regarding its concavity. 7,8 Surface area or bone loss calculations using methods that rely on the 2D constructs and measurements on a single plane of static images misrepresent the 3D concave morphology of the native glenoid fossa. In addition, 2D calculations of a 3D reconstructed image are prone to errors as a result of using oblique views of the 3D reconstruction. The literature lacks uniformity in standardizing an en face plane to view the glenoid. 22 Currently, no technique assessing the actual anatomic surface area of the glenoid from 3D segmented models to quantify the glenoid bone loss in cases of anterior glenohumeral instability has been reported.
We hypothesized that the use of 3D models of the scapula to assess the anatomic 3D concave surface area of the glenoid for quantification of instability-related bone loss would differ with current 2D measurement techniques performed on 3D-CT reconstruction images, and provide a more reliable measure of bone loss. Our study aimed to quantify the anatomic surface area glenoid bone loss, utilizing 3D segmented models of the scapula. The study also compared this evaluation of the glenoid bone loss method with the best-fit circle method and the glenoid height/width method.
Methods
Shoulder CT scans of 200 consecutive patients undergoing the arthroscopic Latarjet were sourced from 2 subspecialist orthopaedic shoulder surgeons’ databases between May 1, 2016, and April 30, 2020. Institutional review board approval was granted for this study, and voluntary informed consent was obtained from all the participants for the use of their clinical and radiological data for the study. CT scans were acquired using a standardized clinical protocol (140 Kvp and minimum of 300 mAs) and a slice thickness of maximum 1 mm. All patients who had unilateral anterior shoulder instability and met clinical indications for a Latarjet procedure 9 with preoperative bilateral shoulder CT scans were included. Bilateral shoulder CT scans were performed in a single acquisition if allowable by patient body habitus, and alternatively, singular shoulder scans were performed with the contralateral arm raised above the patient’s head. Patients with symptoms of bilateral shoulder instability as well as those with CT scans that showed previous soft tissue repair or scapular pathology were excluded. Patients with insufficient imaging of the complete whole scapulae were also excluded.
Three-dimensional surface models of the scapulae were created using image segmentation software Mimics 21.0 (Materialise). Cortical bone was segmented using a threshold of ≥250 Hounsfield units. Each scapula was isolated from the surrounding bones of the shoulder complex using the region grow feature. Minor manual editing of the models was performed when necessary, primarily for deletion of pixels due to noise and partial volume effect. 11 A Gaussian smoothing kernel was applied to the 3D models to ensure a representative surface. The 3D models were then imported into the medical computer-aided design software 3-Matic 13.0 (Materialise) to quantify glenoid bone loss.
The location of the glenoid center of the healthy scapula was calculated using the center of a best-fit circle method, employing 10 points on the inferior bony rim of the glenoid. The best-fit circle was estimated by solving a least mean squares problem. 13
The contralateral healthy scapula was mirrored to match the pathological side. N points registration, followed by a global registration, was subsequently performed to overlay both scapulae. The International Society of Biomechanics anatomic scapular landmarks (ie, angulus acromialis, trigonum spinae, and angulus inferior) were used to perform the N points registration. 32 Our method to locate the glenoid center is based on the healthy glenoid, and overlaying the healthy onto the pathological glenoid allowed for the reference of the glenoid center in glenoids with bone defects. The anatomic concave surface area (ACSA) of the healthy glenoid was mapped, with the scapula positioned in the sagittal view using the “Brush Mark” tool available in 3-Matic. This tool enabled the selection of all triangles forming the 3D model, which fell within the brush area. The diameter of the brush was preset by the user as the diameter of the best-fit circle computed using the inferior bony rim of the glenoid. The center of the brush was positioned on the glenoid center, which allowed for mapping the ACSA of the glenoid. This surface area was automatically calculated by the software and retrieved in square millimeters. The mapping process was performed on both glenoids (healthy and pathological). The glenoid bone defect was subtracted while mapping the pathological glenoid (Figure 2).

Sagittal view (left) and anterolateral view (right) of a pathological glenoid representing the anatomic concave surface area of the glenoid.
The percentage of glenoid bone loss was calculated using the following equation:

The percentage loss calculated was then compared with those obtained using the best-fit circle, and the glenoid height/width method was also implemented in 3-Matic (Figure 1).
The glenoid center was determined using the best-fit circle method. A line following the glenoid defect was drawn on the surface of the glenoid and projected onto the plane of the best-fit circle. A line tangent to the best-fit circle and parallel to the projected defect line was created on this same plane. The defect width was measured between these 2 lines (Figure 1A). The glenoid bone loss was then calculated as a ratio of the defect width against the best-fit circle diameter. 30
For the glenoid height/width method, the glenoid height and width were measured following the authors’ methodology. 10 Glenoid height was used to determine the native glenoid width using described formulas. 10 The actual glenoid width was then compared with the predicted native width to quantify the percentage of the glenoid bone loss.
These measurements were performed on 2 separate occasions, 5 weeks apart, by the principal investigator, who is also a biomedical engineer (M.L.), in collaboration with a subspecialist orthopaedic shoulder surgeon (A.G.) with comprehensive experience in orthopaedic biomedical engineering and 3D modeling. Another observer (N.G.) proficient in the use of the medical software, blinded to the principal investigator’s measurements, also performed these measurements using the same randomly selected subset sample of scapulae (n = 10). Intra- and interobserver reliability assessments were conducted.
Data were presented as mean ± SD. Statistical differences of glenoid bone loss found between the ACSA, the best-fit circle, and glenoid height/width methods were assessed using the nonparametric Wilcoxon test. Inter- and intraobserver reliability was assessed using the intraclass correlation coefficient (ICC). 18 P < .05 was considered statistically significant. SPSS Statistics 25.0.0.1 software (IBM) was used for statistical analysis.
Results
Shoulder CT scans of 200 consecutive patients were evaluated from the surgical database. After application of the exclusion criterion, 36 pairs of scapulae from 36 participants (31 men and 5 women) were included in the study. The mean age was 29 ± 9 years (range, 16-57 years).
The mean glenoid bone loss calculated using the ACSA method was 9.4% ± 6.7% (range, 0.8%-25.5%). Bone loss using the best-fit circle and glenoid height/width methods was 14.3% ± 6.8% (range, 2.5%-29.1%) and 17.6% ± 7.3% (range, 4.8%-34.7%), respectively (Table 1). The results from each method were significantly different from one another (Table 2). Less statistical difference was found between the best-fit circle and glenoid height/width techniques than between the ACSA and the best-fit circle and glenoid height/width methods.
Glenoid Width and Percentage of Glenoid Bone Loss for Each Measurement Method a

a Data are reported as mean ± SD. ACSA, anatomic concave surface area; N/A, not applicable.
Summary of P Values Obtained Between the Measurement Methods a
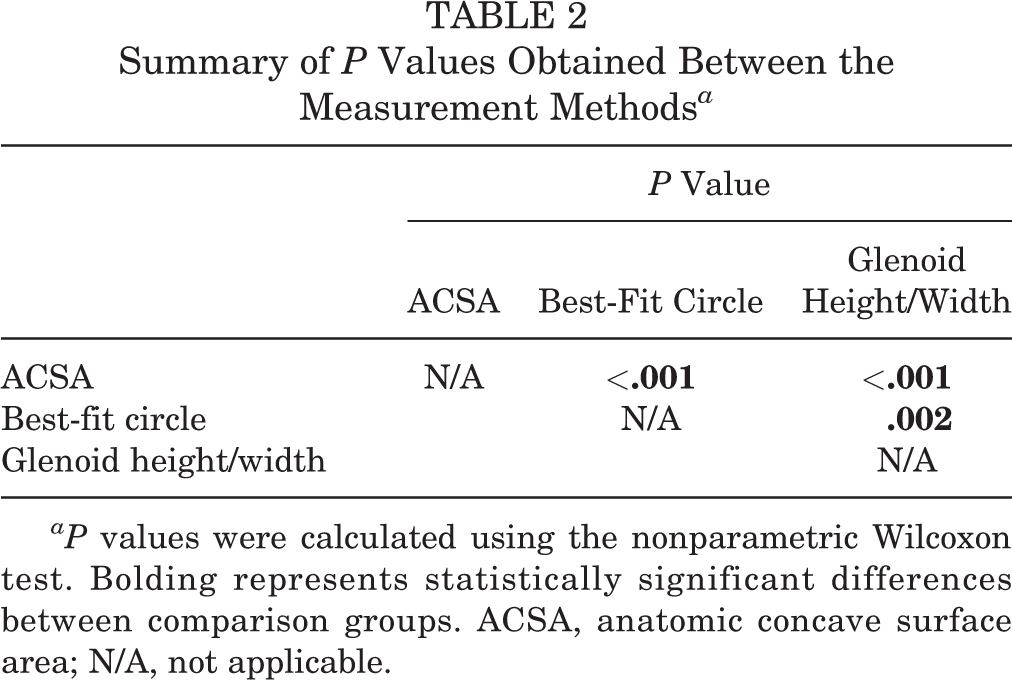
aP values were calculated using the nonparametric Wilcoxon test. Bolding represents statistically significant differences between comparison groups. ACSA, anatomic concave surface area; N/A, not applicable.
The interobserver reliability ICCs were based on a single-rating, consistency agreement and a 2-way mixed-effects model (Table 3). The ACSA method had a mean measured ICC of 0.95, which represented an excellent degree of interrater reliability. 18 Intraobserver reliability was also assessed based on a single-rating, absolute agreement, and 2-way mixed-effects model. Excellent degrees of intrarater reliability was found between the measurements across all methodologies (Table 3).
Inter- and Intraobserver Reliability for the Measurement Methods a

a ACSA, anatomic concave surface area; ICC, intraclass correlation coefficient.
b ICC values were classified as poor if < 0.5, moderate between 0.5 and 0.75, good between 0.75 and 0.9, and excellent above 0.9.
Discussion
Recurrent anterior shoulder instability can be treated surgically with a soft tissue repair, such as a Bankart repair, or with a bone graft procedure. The choice of appropriate surgical management is influenced by patient factors, presence of an engaging Hill-Sachs lesion, and evaluation of glenoid bone loss. The employed decision algorithm helps to guide successful surgical outcomes. Studies have attempted to establish indications surrounding the selection of appropriate surgical techniques to treat recurrent anterior shoulder instability. 9,17,28,33,34
In 2000, Itoi et al 17 conducted a cadaveric study to investigate the critical defect size requiring a bony reconstruction in anterior shoulder instability. They established that a defect width of more than 21% of the glenoid length would lead to recurrent instability after a primary Bankart repair. In 2010, Yamamoto et al 34 demonstrated in another cadaveric study that with the plane of the bone defect placed more anteriorly, rather than anteroinferiorly, a bone defect width of more than 19% of the glenoid length (or 25% of the glenoid width) after a Bankart repair remained unstable. This was further evidenced in 2016 when Shin et al 28 showed that a soft tissue Bankart repair on glenoid defects of more than 15% of the glenoid width restricted rotational range of motion and was unsuccessful in restoring glenohumeral translation leading to abnormal humeral head position. They concluded that these results indicated that the critical size of the glenoid bone defect requiring consideration for a bone graft procedure may be lowered to 15% of the glenoid width. However, these biomechanical studies have used diameter-based measurement methods to create bone defects; therefore, indications regarding critical defect sizes may vary using the ACSA method to quantify glenoid bone loss.
Our method aimed to quantify the actual anatomic 3D surface of the glenoid to evaluate glenoid bone loss. Using the ACSA method to assess the CT scans of a group of 72 shoulders in 36 patients who subsequently underwent a Latarjet procedure, we found a mean glenoid bone loss of 9.4%. The results showed that the ACSA method calculates the percentage of bone loss as being smaller than that calculated using either the best-fit circle or the glenoid height/width method. This result was statistically significant. Our study highlights that the quantification of glenoid bone loss by mapping of the glenoid articular concave surface area is less than the estimations calculated using 2D diameter-based techniques, which do not account for the concavity of the glenoid.
In 2015, Bhatia et al 3 compared diameter-based glenoid bone loss quantification with a geometric calculation of the 2D area of bone loss based on a circular segment of the glenoid. The authors concluded that diameter-based glenoid bone loss calculation overestimated bone loss as calculated using the area of a circular segment on the glenoid. However, the authors mentioned as a limitation of their study that their mathematical model did not account for the concavity of the glenoid. Furthermore, Moroder et al 22 demonstrated the impreciseness of scapular positioning for glenoid en face view. The authors showed that varying the glenoid en face views modified the best-fit circle placement, thus altering glenoid bone loss measurements. The ACSA method, by mapping the concave surface area of the glenoid in 3D, may offer similar results to those obtained using 2D area of bone loss methods, while avoiding alterations due to the lack of standardization regarding the selection of a planar representation of the “true” glenoid en face view.
Our study demonstrated excellent degrees of intra- and interobserver reliability for the ACSA method. The best-fit circle and the glenoid height/width method also showed excellent intraobserver reliability. However, with both the best-fit circle and glenoid height/width methods, we observed significantly less reliability across observers. We hypothesized that this variability could stem from the variance in the selection of the “defect line” extracted from the 3D models constructed.
Kuberakani et al 20 compared the best-fit circle method with contralateral comparison methods in quantification of the glenoid bone defect. They concluded that the contralateral comparison method enabled more reliability. Similarly, intra- and interrater reliability based on the ACSA method, which used the contralateral (healthy) glenoid, also showed consistency. This was not observed in our study using the best-fit circle and glenoid height/width methods, which are dependent on measurements performed on the pathological glenoid only.
The strengths of our study included quantitative measurements of ACSA of the glenoid from 3D segmented models of the scapula in quantification of bone loss. The ACSA method maps the concavity of the 3D anatomic surface area of the glenoid to assess bone loss compared with 2D measurements on static images of 3D reconstructed views of the glenoid. The ACSA method minimizes measurement alteration that may occur with other methods using a single plane of static 2D image of 3D reconstructed en face views of the glenoid. 22 Measurement errors using these methods may be induced if the en face view is presented obliquely or partially rotated to the plane of the observer for assessment.
Studies have shown that 3D osseous reconstructions using specific magnetic resonance (MR) sequences were equivalent to 3D-CT models. 14,15,29 Future work could focus on validation of this method to calculate the glenoid bone loss from 3D reconstructed MR imaging to avoid patient exposure to ionizing radiation. The ACSA method requires the use of the healthy contralateral side as a reference to quantify instability-related glenoid bone loss. Therefore, a prerequisite for this method is the requirement of preoperative bilateral CT scans of the shoulders, which may be difficult to obtain due to technical constraints. The use of MR sequences could address this limitation. Alternatively, CT scans of both shoulders can be obtained from a single image acquisition when possible, avoiding the need to expose the patient to the additional radiation that would occur if 2 separate scans, 1 for each shoulder, were obtained.
Second, the ACSA method requires proficient use of the medical software 3-Matic to calculate glenoid bone loss. This can be a limitation for routine use of the ACSA method in clinical practice. However, the aim of our study was to present an alternative technique to measure glenoid bone loss that accounts for the concavity of the glenoid fossa and to compare the results with those obtained from other methods used clinically.
For accurate estimation of glenoid bone loss using the ACSA method, we established strict inclusion and exclusion criteria. We chose to exclude revision procedures. Only patients eligible for a primary Latarjet procedure were included in this study, and those patients with a failed Bankart repair were excluded, as the presence of anchors could affect surface area measurements. In our institutional surgical database, the Latarjet procedure was performed as a revision management strategy for failed soft tissue repair in recurrent anterior shoulder instability in a significant number of patients, resulting in the exclusion of these participants from our study. The selection criteria for unilateral healthy glenoid affected our sample size. However, this study demonstrated the feasibility of the ACSA method in primary cases. Future work could focus on the use of the ACSA method for revision cases and investigate the influence of anchor holes on glenoid bone loss estimations.
Conclusion
The results from our study indicate that the use of the ACSA method of glenoid bone loss percentage calculation is more reliable than a 2D estimation of bone loss using a standard picture archiving and communication system. Future work focusing on biomechanical and clinical implications of the ACSA method to evaluate glenoid bone loss could assist in planning surgical treatment for recurrent anterior shoulder instability.
Footnotes
Acknowledgment
The authors acknowledge Dr Nikolas Knowles for his previous guidance.
Final revision submitted December 10, 2020; accepted January 12, 2021.
The authors declared that there are no conflicts of interest in the authorship and publication of this contribution. AOSSM checks author disclosures against the Open Payments Database (OPD). AOSSM has not conducted an independent investigation on the OPD and disclaims any liability or responsibility relating thereto.
Ethical approval for this study was obtained from the Ramsay Health Care QLD Human Research Ethics Committee (ref. protocol No. 19/41).