
Abstract
Background:
The influence of long-term loading conditions on the articular surfaces of the glenohumeral joint can be determined by measuring stress-distribution patterns. Long-term pitching activity changes the stress distribution across the glenohumeral joint surface; however, the influence of competitive level on stress-distribution patterns remains unclear.
Purpose:
To use computed tomography (CT) osteoabsorptiometry (CTOAM) to evaluate the distribution of subchondral bone density across the glenohumeral joint in collegiate and professional baseball players as well as to determine the effects of pitching activity on the articular surfaces.
Study Design:
Descriptive laboratory study.
Methods:
We evaluated 73 shoulders in 50 baseball players. CT imaging data were obtained from the dominant-side shoulder of 12 professional pitchers (PP group) and 15 professional fielders (PF group). CT imaging data were also obtained from both shoulders of 12 asymptomatic collegiate pitchers (CP group) and 11 collegiate fielders (CF group). The pattern of distribution of subchondral bone density across the articular surfaces of each glenohumeral joint was assessed by CTOAM. As a measure of bone density, the mean Hounsfield units (HU) were obtained for each joint surface, and the absolute values of the dominant shoulder were compared for each group.
Results:
Stress-distribution patterns over the articular surfaces differed between the dominant and nondominant sides in the CP group as well as between both collegiate groups versus the PP group. In the CP group, the mean HU of the humeral head surface were greater on the nondominant versus dominant side (P = .035). On the dominant side, the mean HU of the humeral head surface and glenoid were greater in the CP versus the PP group (P = .001 and .027, respectively).
Conclusion:
Stress distribution on the articular surface of the glenohumeral joint was affected by pitching ability and competitive level. Our analysis indicates that the traction force on the glenohumeral joint surface might be greater than compression force during pitching.
Clinical Relevance:
The present findings suggest that pitching activity results in low stress to the articular surfaces of the glenohumeral joint. This supports the notion that mechanical conditions play a crucial role in the etiology of disorders specific to pitching activity.
Baseball pitching commonly results in disorders to the shoulder including Little Leaguer shoulder, rotator cuff tears, internal impingement syndrome, and superior labrum anterior and posterior lesions. An increase in the occurrence of these pitching disorders among professional baseball players has become an issue in countries in which baseball is popular. 2,6,15 To overcome this issue, more effective strategies for disease prevention and treatment must be established.
Repetitive mechanical stresses acting on the shoulder as a result of pitching are considered to be associated with the aforementioned disorders. Numerous biomechanical and cadaveric studies have examined ligamentous tension around the shoulder during baseball pitching. 3,10,14,17 However, there are few biomechanical studies regarding stress distribution through the articular surfaces of the shoulder joint during pitching activity because of difficulties in direct measurement and the simulation of loading conditions. For these reasons, the characteristics of stress distribution over the shoulder articular surfaces of baseball players are not well-understood. To develop treatment and prevention strategies for pathological conditions of the shoulder joint, it is necessary to elucidate the biomechanical characteristics of the shoulder under the actual loading conditions of baseball pitching.
The distribution of subchondral bone density is known to accurately reflect the long-term resultant stress acting on an articular surface in living joints. 11 Based on this theory, Müller-Gerbl et al 11,12 developed a method for measuring subchondral bone density using computed tomography (CT) image data, termed CT osteoabsorptiometry (CTOAM), to assess long-term stress distribution in living joints. Using this method, Momma et al 7 reported significantly different stress distribution throughout the elbow joints of professional baseball pitchers compared with those of collegiate baseball pitchers. Therefore, we can determine the biomechanical characteristics over the surfaces of the [bad break: glenohumeral] joint under the long-term loading conditions of professional baseball players by measuring the stress distribution pattern.
We hypothesized that the distribution patterns of subchondral bone mineral density in the glenohumeral joints of professional baseball players would differ from those of collegiate baseball players. To test this hypothesis, we analyzed the stress-distribution pattern through the entire articular surface of the glenohumeral joint in baseball players of different competitive levels using an originally modified method of CTOAM. 5,8,9 The aims of the study were to assess the distribution of subchondral bone density across the humeral head and the glenoid surface of the dominant and nondominant shoulders in male collegiate pitchers and fielders and to compare the distribution in the dominant shoulders of professional pitchers and fielders.
Methods
Acquisition of CT Image Data
Institutional review board approval was obtained before the initiation of the study, and informed consent was obtained from all participants. Eleven male collegiate fielders (CF group; mean age, 20.3 years; range, 19-22 years) and 12 male collegiate pitchers (CP group; mean age, 21.2 years; age range, 20-22 years) underwent CT examination of both shoulders, and the CT image data were collected for further analysis. Fifteen male professional fielders (PF group; mean age, 27.5 years; range, 10-44 years) and 12 male professional pitchers (PP group; mean age, 24.4 years; age range, 18-32 years) underwent CT examination of their dominant shoulder, and the CT image data were collected for further analysis. All participants in the collegiate groups were volunteers and had no shoulder symptoms or history of shoulder disorder or trauma. The professional groups participated in the study as part of an annual medical check of the dominant shoulder and had no symptoms or history of shoulder disorder or trauma. Those in the fielder group had played on a baseball team as fielders since junior high school; the same was true of the pitcher group. The mean number of years playing baseball was 11.2 years for the CF group, 11.6 years for the CP group, 18.5 years for the PF group, and 15.3 years for the PP group. We measured the passive glenohumeral range of motion (ROM) in external and internal rotation at 90° of shoulder abduction in the supine position with restriction of the scapulothoracic movement in the dominant and nondominant shoulders. Bodyweight and height were also measured.
CT Osteoabsorptiometry
A high-resolution (matrix, 512 × 512) helical CT scanner (HiSpeed Advantage; GE Healthcare) was used to obtain axial images of the shoulder (slice thickness, 1 mm; interval, 1 mm; table speed, 1 mm/s). The CT image data were then transferred to an image-analyzing system (Revolution CT; GE Healthcare) for evaluation. A 3-dimensional bone model was created from the axial image data, and coronal views with 1-mm intervals were then reconstructed from the model. Further evaluation was performed using custom-designed software. 4 On the coronal reconstruction images, a region of interest was manually selected that included the entire subchondral bone layer of the articular surfaces of the glenohumeral joint in all slices. Radiographic attenuation (Hounsfield units [HU], defined as water = 0 and compact bone = 1000) was then measured automatically at coordinate points at an interval of 1 mm. Measurement and mapping were repeated in each slice, and the data were stacked to create a 2-dimensional mapping image showing the distribution of subchondral bone density. Bone density, represented by mean HU, was measured for each joint surface, and the absolute values were compared for each group. The bone density distribution patterns of the humeral head and glenoid surface were classified as described previously. 19
Statistical Analysis
An a priori power analysis (G*Power software) indicated that a sample of 12 participants would be appropriate to establish a statistical power of 0.95 at the predetermined α level of .05 and with a large effect size of 0.8. Previous studies were available on which to base our sample-size estimate. 7,9 Data were compared between the dominant and nondominant shoulder by a paired t test, and analysis of variance and Tukey protected least significant difference test were used for comparisons among more than 3 groups. Differences were considered significant at P <.05.
Results
Demographics of Participants
Table 1 lists the demographics of the participants. There was right-handed dominance in 11 of 11 in the CF group (100%), 8 of 12 in the CP group (67%), 14 of 15 in the PF group (93%), and 8 of 12 in the PP group (67%). Mean age was significantly greater in the PF group than in the CF and CP groups (P = .001 and .005, respectively). The mean number of years on the baseball team was significantly greater in the PF group than in the CF and CP groups (P = .0011 and .0014, respectively). The mean height was significantly greater in the PF group than in the CF group (P = .033), and it was significantly greater in the PP group than in the CF and CP groups (P < .001 and = .003, respectively). The mean weight was significantly greater in the PF group than in the CF and CP groups (P = .001 and .023, respectively). The mean weight was significantly greater in the PP group than in the CF and CP groups (P < .001 and .007, respectively). In all groups, the ROM in external rotation was significantly greater in the dominant shoulder than in the nondominant shoulder (P = .003 in the CF group; P = .025 in the CP group; P = .012 in the PF group; and P = .018 in the PP group). With the exception of the CF group, the ROM as regards internal rotation was significantly greater in the nondominant shoulder than in the dominant shoulder (P = .029 in the CP group; P = .012 in the PF group; and P < .001 in the PP group).
Participant Characteristics a
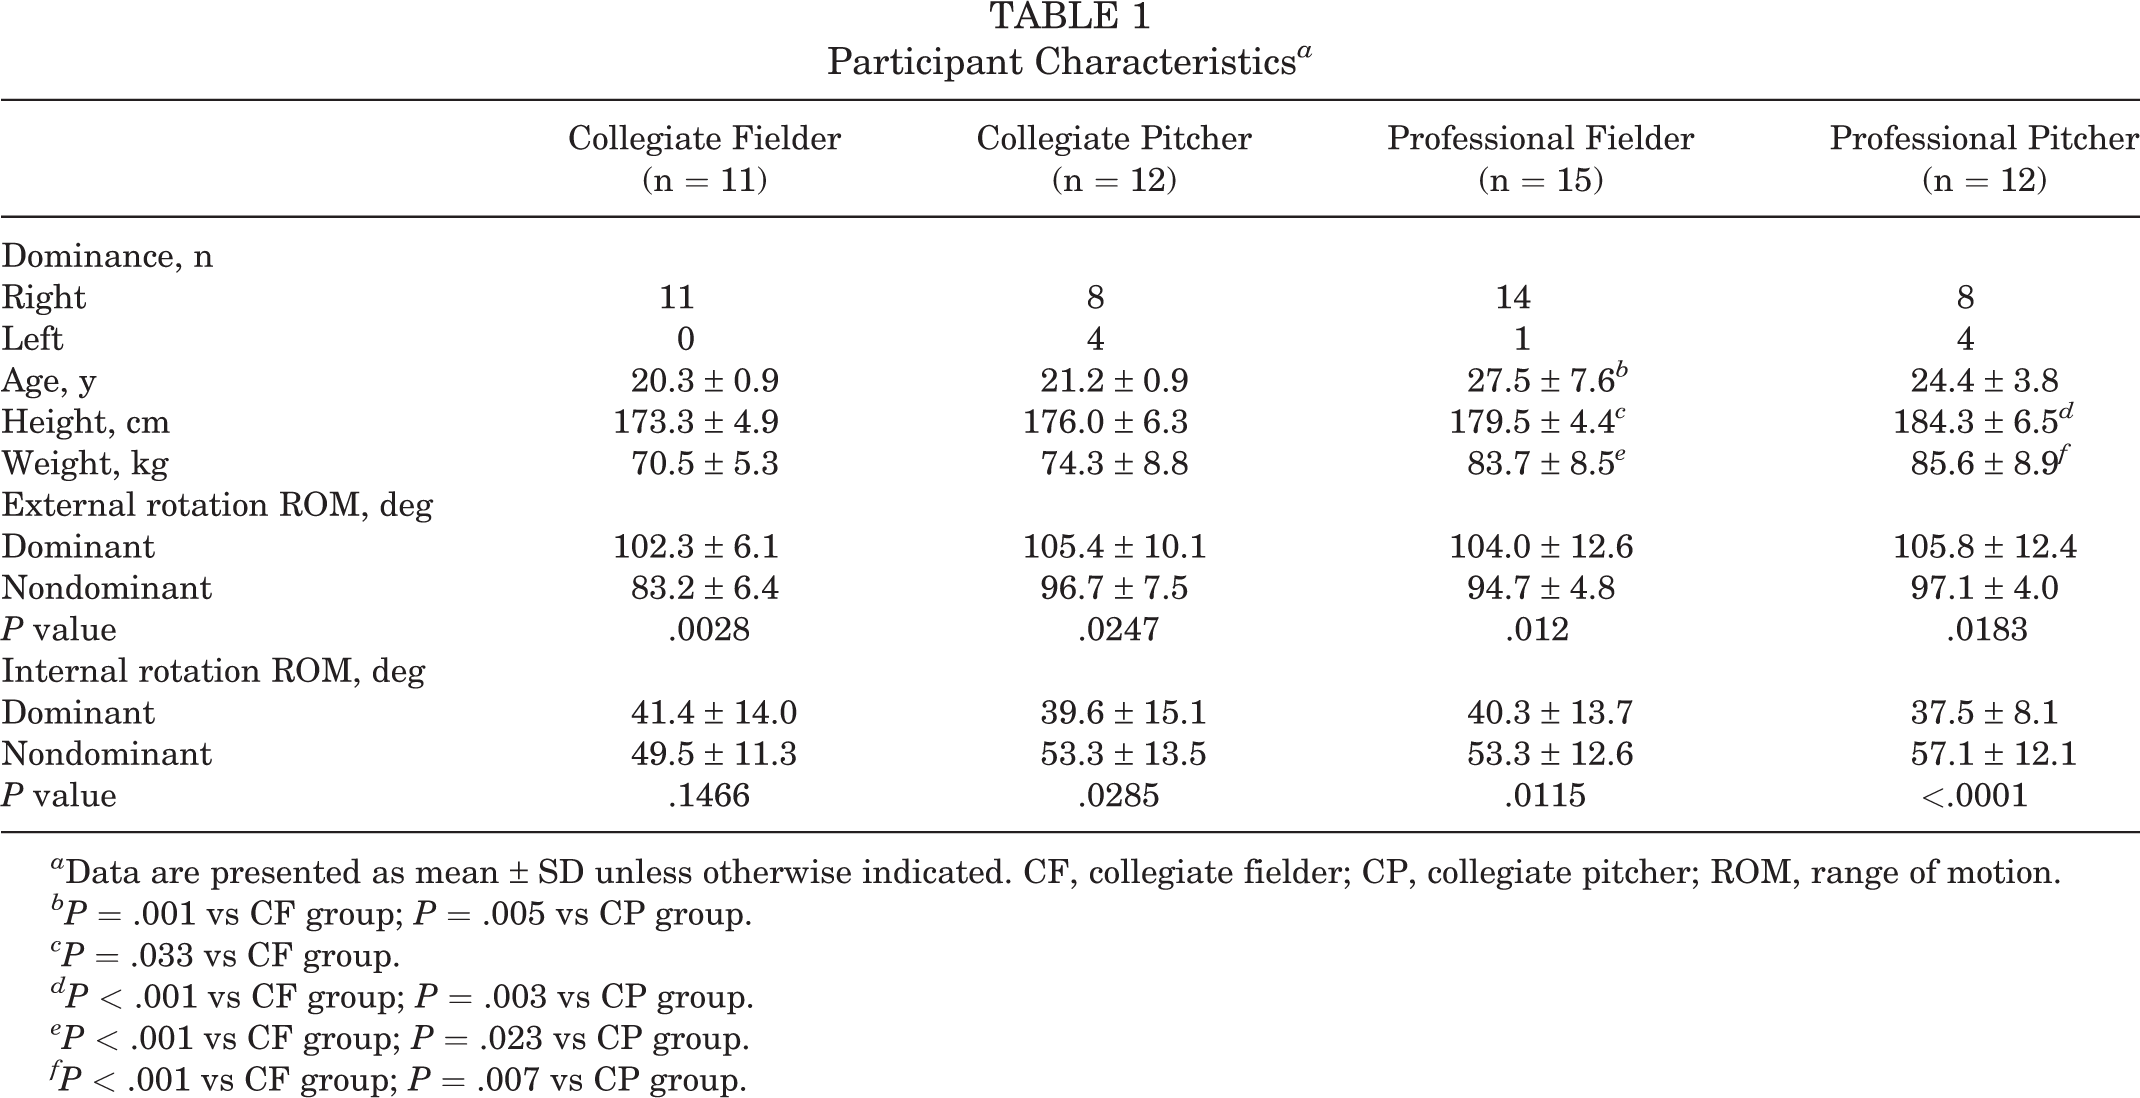
a Data are presented as mean ± SD unless otherwise indicated. CF, collegiate fielder; CP, collegiate pitcher; ROM, range of motion.
bP = .001 vs CF group; P = .005 vs CP group.
cP = .033 vs CF group.
dP < .001 vs CF group; P = .003 vs CP group.
eP < .001 vs CF group; P = .023 vs CP group.
fP < .001 vs CF group; P = .007 vs CP group.
Analysis of Distribution Patterns
Figure 1 shows the distribution of subchondral bone density across the articular surfaces of the glenohumeral joint in the 4 groups. A bicentric distribution pattern with anterior and posterior maxima was seen in 9 of 11 humeral heads and 9 of 11 glenoids in the CF group, 11 of 12 humeral heads and 11 of 12 glenoids in the CP group, 13 of 15 humeral heads and 13 of 15 glenoids in the PF group, and 11 of 12 humeral heads and 11 of 12 glenoids of the PP group. A monocentric distribution pattern was seen in the remaining humeral heads and glenoids.

Representative distribution of subchondral bone density across the articular surfaces of the glenohumeral joint for (A) collegiate fielders, (B) collegiate pitchers, (C) professional fielders, and (D) professional pitchers.
Analysis of CF Group
In the CF group, the mean bone density of the surface of the humeral head was 811.6 ± 65.2 HU on the dominant side and 824.7 ± 72.6 HU on the nondominant side (Figure 2A). The mean bone density of the glenoid surface was 1269.6 ± 58.7 HU on the dominant side and 1270.5 ± 55.5 HU on the nondominant side. There was no significant difference in the degree or distribution pattern of subchondral bone density between the dominant and nondominant sides (Figures 1A and 2A).

Comparison of the mean bone density (as measured by Hounsfield units) in the collegiate groups. Error bars represent significant difference. *P = .035.
Analysis of CP Group
In the CP group, the mean bone density of the surface of the humeral head was lower on the dominant side than on the nondominant side (dominant side, 827.3 ± 93.2 HU; nondominant side, 882.1 ± 84.7 HU; P = .0353) (Figure 2B). The mean bone density of the glenoid surface was 1267.6 ± 84.7 HU on the dominant side and 1220.8 ± 78.2 HU on the nondominant side. There was no significant difference in the distribution pattern of subchondral bone density between the dominant and nondominant sides (Figure 1B).
Comparison of Bone Density of the Dominant Shoulder Among the Groups
The mean bone density of the surface of the humeral head was significantly lower in the PP group than in the CF and CP groups (P = .0052 and .0011, respectively) (Figure 3). The mean bone density of the glenoid surface was significantly lower in the PP group than in the CF and CP groups (P = .0275 and .0268, respectively) (Figure 3). There was no significant difference in bone density between the PP and PF in either the glenoid or the humeral head.
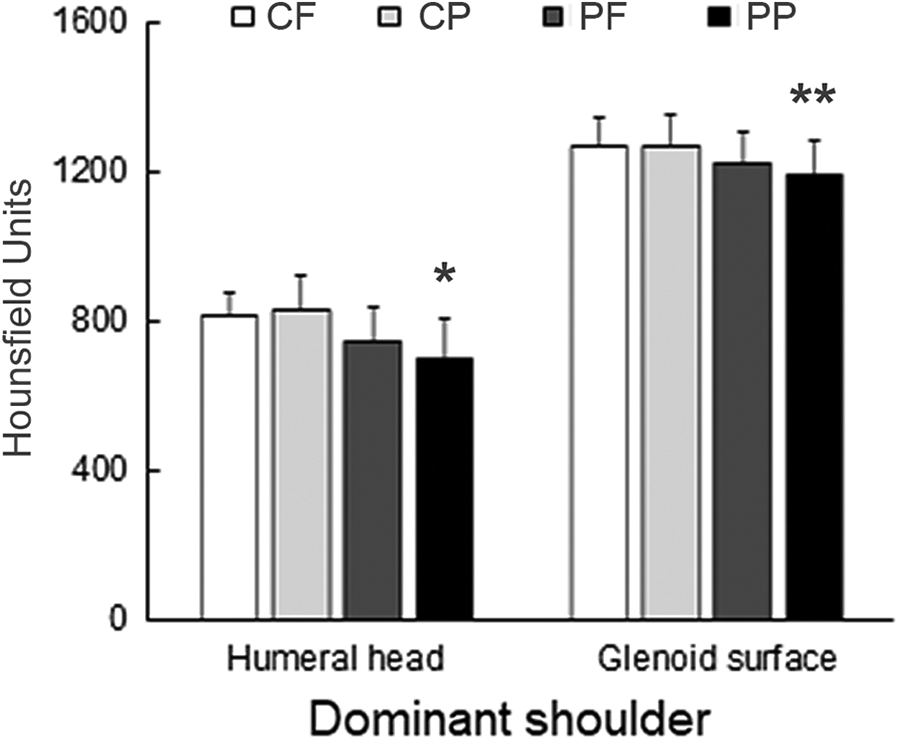
Comparison of mean bone density (as measured by Hounsfield units) of the dominant shoulder among the groups. Error bars represent SD. *P = .005 vs CF and .001 vs CP; **P = .028 vs CF and .027 vs CP. CF; collegiate fielders, CP; collegiate pitchers; PF, professional fielders; PP, professional pitchers.
Discussion
To the best of our knowledge, this is the first evaluation of stress distribution patterns in the glenohumeral joints of professional baseball players. The present results demonstrated that stress-distribution patterns differed between the dominant and nondominant shoulders of collegiate baseball pitchers as well as between collegiate and professional baseball players. In collegiate baseball pitchers, the mean bone density, as measured in HU of the surface of the humeral head, was lower in the dominant than nondominant shoulder. Moreover, the mean bone density of the surface of the humeral head and glenoid were lower in professional baseball pitchers than in collegiate baseball players. These results indicate that in the dominant side of baseball players, stress is not concentrated in the glenohumeral joint.
Several cadaveric studies have analyzed the distribution of force through the shoulder joint. 1,13,18 However, it is difficult to simulate the long-term loading conditions of pitching activity in cadaveric joints. Accordingly, we used CTOAM, in which higher HU indicates more stress to the subchondral bone, to evaluate changes in stress distribution through the glenohumeral joint in baseball players and successfully clarified the biomechanical characteristics of the articular surfaces of the glenohumeral joint under the long-term loading conditions of pitching activity. The present study revealed no significant difference in mean HU between the dominant and nondominant shoulders of collegiate fielders; nevertheless, in collegiate pitchers, the mean HU of the humeral head was lower in dominant than nondominant shoulders. The basis of CTOAM is that subchondral bone mineralization adapts functionally to repeated and long-term changes in the load on joints. 11 Therefore, the mineralization pattern is an indicator of the mechanical conditions in living joints. The present results suggest that repetitive pitching activity causes decreased stress through the glenohumeral joint surface.
The shoulder joint is subjected to high and various stress during the cocking and acceleration phases of pitching. Nissen et al 14 reported that the glenohumeral maximal moment of internal rotation just before fastball release was 59.8 ± 16.5 N·m. Fleisig et al 3 reported a shoulder proximal force of 1090 N during the cocking phase. Although pitching activity affects the loading condition through the articular surfaces of the glenohumeral joint, the actual long-term stress distribution of the glenohumeral joint in baseball players remains unclear. The present finding of a low bone mineralization of the dominant humeral head in the collegiate pitchers may have resulted from the functional adaptation of the subchondral bone to the repeated distractive force on the glenohumeral joint produced by long-term pitching activity.
Bicentric density patterns of the glenoid surface were characteristic in baseball players. Shimizu et al 16 reported that the percentages of high-density regions did not differ between pitchers and fielders. The mean age of the current study was relatively older than that of previous study; regarding subchondral bone density patterns and mean HU, the current results are comparable with previous reports. 16 We did not compare the percentages of high-density regions of the glenoid cavity and humeral head, including the anterior and posterior rims. To better understand the loading conditions in pitching activities, further studies should analyze more data obtained from players with pathological conditions.
Stress to the glenohumeral joint may increase over longer-term physiologic loading conditions. Although the mean age was greater in professional versus collegiate pitchers, the current analysis suggested less compressive stress over the glenohumeral joint in professional pitchers. The data obtained here are absolute values. Our results indicate that the degree of baseball pitching activity has a more significant effect on stress distribution through the glenohumeral joint than does the age of the athlete.
We must consider the following limitations of this study. First, the results of the current analysis were not based on direct measurement of mechanical stress through the shoulder joint. Second, the pattern of stress distribution through living joints is affected mainly by applied loading conditions and joint geometry. In the CP group, although there was no significant difference in the mean HU of the glenoid surface between the dominant and nondominant sides, the mean HU of the humeral head surface were significantly lower on the dominant than nondominant side. Joint geometry and throwing load may have influenced these findings. Third, as the present participants had no shoulder joint symptoms, the glenohumeral joint changes might be a normal adaptation. In addition, the sample size was small, and we assessed only male baseball players. Finally, there was variation in the competition histories and playing periods of the participants. A greater number of participants and a prospective study design are both needed to reveal the relationship between stress patterns and shoulder injuries.
Conclusion
Our analysis using CTOAM indicated that the distribution pattern of mechanical stress through the glenohumeral joint in baseball pitchers is affected by pitching ability and competitive level. In addition, the magnitude of long-term stress on the glenohumeral joint appears to be low in asymptomatic professional pitchers.
Footnotes
Final revision submitted March 16, 2020; accepted February 6, 2021.
The authors declared that there are no conflicts of interest in the authorship and publication of this contribution. AOSSM checks author disclosures against the Open Payments Database (OPD). AOSSM has not conducted an independent investigation on the OPD and disclaims any liability or responsibility relating thereto.
Ethical approval for this study was obtained from Hokkaido University Hospital (approval No.: 020-0086).