
Abstract
Background:
The diagnosis and monitoring of Achilles tendinopathy with imaging are challenging. There is a lack of studies comparing the diagnostic accuracy of magnetic resonance imaging (MRI), brightness mode ultrasound (B-mode), and power Doppler ultrasound with recent technologies such as ultrasound tissue characterization (UTC) and shear wave elastography (SWE).
Purpose:
To assess whether SWE and UTC, which offer quantitative values, show a superior diagnostic accuracy and capacity to detect structural improvement in Achilles tendinopathy compared with MRI, B-mode, or power Doppler.
Study Design:
Cohort study (diagnosis); Level of evidence, 2.
Methods:
Patients with insertional (n = 28) and midportion (n = 38) Achilles tendinopathy were evaluated at baseline and 6-month follow-up using MRI, B-mode, power Doppler, SWE, and UTC. Asymptomatic controls (n = 37) were evaluated at T 0. Diagnostic accuracy was analyzed based on a quantitative receiver operating characteristic (ROC) analysis with quantitative cutoff values (anteroposterior diameter, Öhberg score, UTC echo type, Young modulus) and by semiquantitative Likert scale–based assessment of experienced physicians.
Results:
For diagnosing insertional Achilles tendinopathy, semiquantitative MRI and power Doppler were most favorable (diagnostic accuracy, 95%), while the cross-sectional area of MRI revealed 89% accuracy in the ROC analyses (area under the curve [AUC], 0.911; P < .001). For diagnosing midportion Achilles tendinopathy, semiquantitative MRI and B-mode were most favorable (diagnostic accuracy, 87%), while UTC echo types 3 and 4 revealed 86% and 87% accuracy, respectively, in the ROC analyses (AUC, 0.911 and 0.941, respectively; P < .001). However, for quantitative and semiquantitative evaluation of diagnostic accuracy in both insertional and midportion Achilles tendinopathy, there was no significant difference in favor of one imaging modality over the others. Compared with baseline, only SWE showed a significant change at the 6-month follow-up (P = .003-.035), but there were only fair to poor monitoring accuracies of 71% (insertion) and 60% (midportion). However, compared with the other modalities, the monitoring accuracy of SWE was significantly higher (P = .002-.039).
Conclusion:
There was no statistically significant difference in favor of one imaging modality over the others, but MRI revealed the highest overall diagnostic accuracy for the diagnosis of both insertional and midportion Achilles tendinopathy.
Keywords
Magnetic resonance imaging (MRI) and brightness mode ultrasound (B-mode) are commonly used to diagnose Achilles tendinopathy (AT). 10 However, B-mode and MRI only evaluate the tendon structure without the ability to consider nonstructural parameters such as dysfunction as the source of pain, which might explain the poor correlation between clinical symptoms and tendon morphology using these modalities. 10 Moreover, the results of B-mode and MRI mainly reveal subjective information since they depend on individual interpretations of morphologic findings. Additionally, even though symptom improvement of tendinopathies does not necessarily need to be related to structural improvement, other imaging technologies might show a more adequate association of the imaging parameters with symptom improvement than B-mode and MRI. 9,13 Thus, there is a need to seek additional imaging modalities, which may provide more quantitative objective data and have improved diagnostic accuracy and symptom monitoring capacity.
In recent years, advanced ultrasound techniques have been developed, such as shear wave elastography (SWE) and ultrasound tissue characterization (UTC), to overcome some of the abovementioned limitations of current imaging modalities. 8,9,38,48 SWE deduces tissue elasticity and offers real-time quantitative values (Young modulus in kilopascal[kPa]) by measuring the speed of shear wave propagation, generated by an acoustic impulse of the ultrasound probe. 48 Recently, SWE has shown favorable capabilities in diagnosing and monitoring tendinopathies compared with B-mode or power Doppler ultrasound (PD-US). 8,9,36 Symptomatic tendons show a reduced tissue stiffness as measured by the kPA of elasticity, which might be caused by high concentrated water-binding proteoglycans in tendinopathy prohibiting adequate fascicle sliding in the edematous swollen tendon during locomotion. 1,15 Interestingly, SWE could also display increased tissue stiffness in accordance with clinical improvement, but the current literature does not reveal any extensive comparison with other imaging modalities. 9,13
UTC, on the other hand, quantifies the consistency of gray levels in an axial plane and characterizes the structure of the Achilles tendon into 4 echo types, giving standardized semihistological data about tendon properties. 48 In previous studies, UTC was able to distinguish between symptomatic and asymptomatic tendons 4 ; however, the diagnostic accuracy of UTC is still unknown, and there are contradictory results for its capacity to detect structural tendon improvement. 4,28
So far there exist a limited number of studies that directly compare the diagnostic values of B-mode versus MRI. 23,31 The study of Khan et al 23 reported a low sensitivity (B-mode, 65%; MRI, 56%) and specificity (B-mode, 68%; MRI, 94%). These previous studies did not differentiate between insertional and midportion AT, which might substantially influence outcomes and treatment owing to possible underlying pathologies such as bursitis or Haglund exostosis in insertional tendinopathy. 23,31 Moreover, imaging hardware and software of MRI and B-mode have made substantial progress, and high-frequency ultrasound probes are now commonly available, offering an improved tissue resolution. Additionally, based on previous imaging studies, symptom improvement might not be based on structural tendon improvement, but it is unclear if this also applies to SWE. 4,5,10,13
The purpose of this study was to update the diagnosis and monitoring potential of established modalities such as B-mode and MRI and to compare them with contemporary modalities such as SWE and UTC, differentiating between insertional and midportion AT. We hypothesized that SWE and UTC, which offer quantitative values, would show a superior diagnostic accuracy and monitoring capacity compared with a semiquantitative assessment with B-mode, PD, or MRI.
Methods
The investigation was approved by the local clinical ethics committee, and the study was registered with an official World Health Organization trial registry (DRKS00014676). All participants provided written informed consent. We performed a prospective longitudinal study in patients diagnosed with either insertional or midportion AT in comparison with a healthy control group.
Inclusion and Exclusion Criteria
Between April 2018 and October 2019, a total of 77 adult patients (>18 years of age) with assumable insertional or midportion AT, who had been referred by orthopaedic surgeons or general practitioners, were considered for this study.
For inclusion in this study, patients had to have symptoms for more than 3 months and a score of <90 on the Victorian Institute of Sports Assessment (VISA-A). 27 Patients were excluded from the study if they had relative or absolute contraindications for an MRI examination (eg, metallic implants such as pacemakers or claustrophobia) or if they were over- or underweight (body mass index [BMI], >35 or <17). Further exclusion criteria were previous tendon surgery, tendon injections, and former tendon rupture.
Of the 77 initial patients, 11 were excluded. In the remaining patients, AT was diagnosed by a positive palpation test (positive reference standard test; sensitivity of 84% and specificity of 73% according to Hutchison et al 19 ) in 28 patients with insertional and 38 patients with midportion AT. The control group (n = 37) consisted of participants without clinical symptoms of AT (VISA-A = 100) and without pain with palpation (negative reference standard test). Figure 1 gives an overview of the study design.
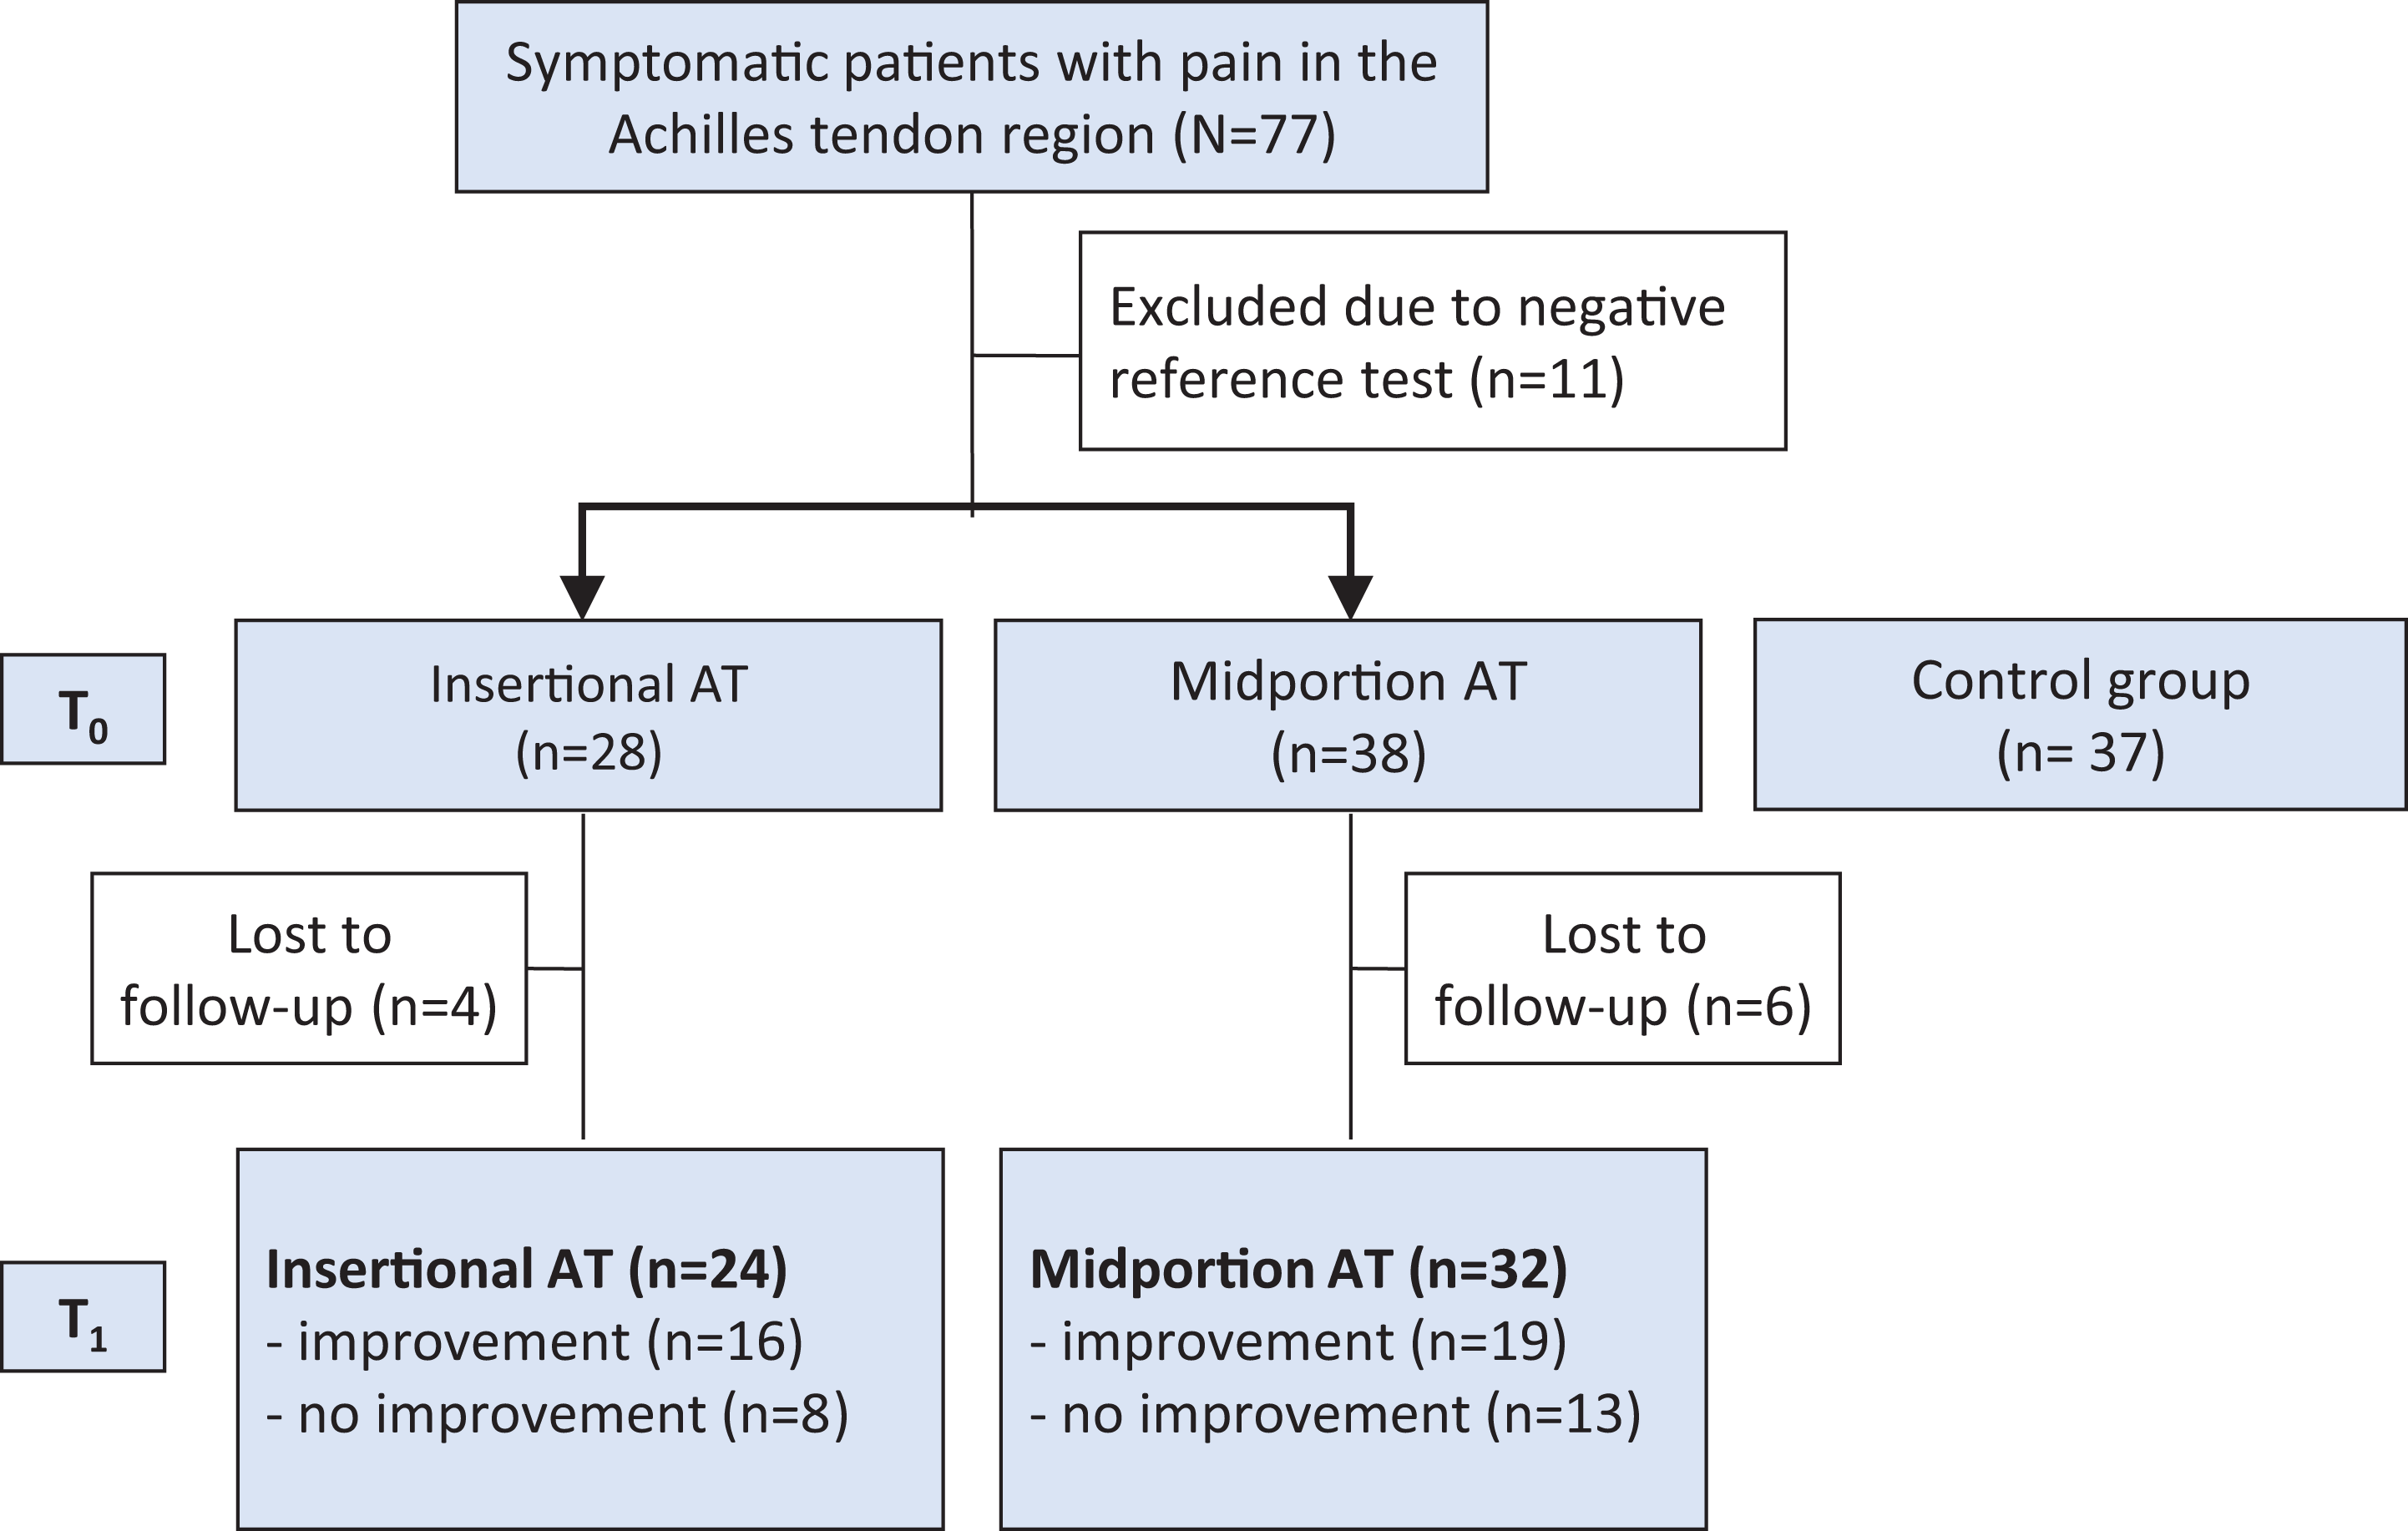
Flowchart of the study design. AT, Achilles tendinopathy.
Study Protocol
A positive palpation test with a VISA-A score of <90 was assessed as the reference test, which was always performed by the same observer. The conventional modalities B-mode, PD-US, and MRI were counted as the index test. Directly after the positive diagnosis of insertional or midportion AT in the reference test, the patients underwent a standardized multimodal imaging protocol consisting of B-mode, PD-US, SWE, UTC, and MRI of the symptomatic Achilles tendon. The imaging examiners were blinded to the results of the reference test. Based on the 3 different scanners used in this study, SWE, PD-US, and B-mode were always conducted by the same examiner (T.D.), UTC scans by another examiner (M.G.), and MRI always by the same medical technical assistant (D.B.). All scans were performed in approximately 90 minutes, one directly after the other, in a random order. The acquired images were not interpreted or analyzed by the examiner who acquired the data.
Patients were clinically and radiologically assessed at the beginning (T 0) and after 6 months of treatment (T 1). Monitoring capacity was defined as improved tendon structure/parameters in accordance with improved clinical symptoms at T 1. The asymptomatic tendons of a separate control group were examined only at T 0. The control group was randomized as to the examined asymptomatic tendon side.
Symptom Evaluation and Treatment Protocol
The primary measure for symptom assessment and monitoring was the VISA-A score, which is specifically designed for AT (0 = maximum pain; 100 = no pain). Besides the VISA-A score, symptom status was evaluated with the American Orthopaedic Foot & Ankle Society (AOFAS) score as a general score for foot pathologies. 24 The clinical status was assessed with the VISA-A and AOFAS scores at T 0 and T 1. Relevant clinical improvement or worsening was determined by a change of ±10 VISA-A score points. 20,30,32 For further assessment of symptom development, the 4-point Roles and Maudsley scale (1 = excellent; 2 = good; 3 = acceptable; 4 = poor) was used. 35,42
All symptomatic patients performed a previously described home-based physical therapy treatment program with eccentric and isometric exercises. 15 Patients who had already begun noninvasive therapies (such as shock wave therapy) were allowed to continue these therapies throughout the study duration.
Imaging Protocol: Ultrasound Data Acquisition With B-Mode, PD-US, SWE, and UTC
All ultrasound images at T 0 and T 1 were acquired by the same blinded examiner (M.G.) with 5 years of experience in musculoskeletal ultrasound.
Examinations for B-mode and PD-US were conducted in the longitudinal and transverse planes using a high-resolution linear 18-MHz transducer (Aixplorer, SuperLinear SL 18-5; Supersonic Imagine). All patients were positioned prone with their feet hanging relaxed over the examination couch. A gel cushion delay block (Sonogel; length, 100 × 100 mm; delay distance, 10 mm; Sonokit Proxon) was used to improve docking for the SWE measurements. The Achilles tendon anteroposterior (AP) diameter and the cross-sectional area (CSA) were measured in the transverse plane at the widest point, ensuring that the plane was strictly orthogonal through the oval tendon. 15 Furthermore, tendons were assessed for areas of hypoechogenicity, fiber irregularity, calcification, and bursitis.
PD-US was conducted in the transverse and longitudinal planes of the entire tendon. Neovascularization was rated according to the Öhberg score (0 = no vessels; 1 = 1 or 2 vessels anterior of the tendon; 2-4 = 2, 3, 4, or more vessels inside the tendon). 33 Since Öhberg 1 scores might also be found in asymptomatic individuals as false-positive results, tendons were rated positive only with Öhberg scores ≥2 18 (Figure 2).

Brightness mode ultrasound (B-mode): grayscale ultrasound showing fiber irregularities, hypoechogenicity, and a thickened tendon. Power Doppler ultrasound (PD-US): highly rich vascularized tendon in the midportion (Öhberg score, 4).
SWE provides quantitative parameters of mechanical properties by measuring shear wave speed propagation (m/s) within the tissue and by deducing the Young's modulus in kPa with a high reliability (interobserver, 0.940; intraobserver, 0.916). 26,48 The acquired SWE information was evaluated quantitatively in kPa, up to a maximum tissue rigidity of 800 kPa (16.3 m/s). Tendon stiffness was rated separately according to insertion (0-2 cm of the calcaneus) and midportion (2-6 cm), with 3 measurements for each location. Since there is no general consensus about the optimal region of interest (ROI) for SWE measurements, 2 ROIs were used: (1) circle of 3-mm diameter (SWE3mm) and (2) individual area covering the whole tendon in the SWE measurement window (SWEarea). 15 SWE3mm is positioned in the tendon area of maximum tissue stiffness, assessing a specific area within the tendon, while SWEarea assesses a more general value from a larger tendon area (Figure 3).

Shear wave elastography (SWE): Individual area covering the whole tendon in the SWE measurement window (SWEarea; dashed lines), representing an individual region of interest (ROI), in contrast to the SWE circle of 3-mm diameter (SWE3mm; circle) representing a circular ROI.
UTC (UTC Imaging; Stein) quantifies the consistency of the gray level of transverse tendon images and offers sagittal, coronal, and transverse planes 11,39,47 (Figure 4). Images were acquired by a 7- to 10-MHz linear ultrasound transducer (SmartProbe 12L5-V, Terason 2000+; Teratech) positioned in a tracking device moving automatically along the tendon long axis over a distance of 12 cm, recording regular axial images at intervals of 0.2 mm. The images are captured under a standardized transducer tilt angle, focus depth, and ultrasound gain, making it more user independent; it has an excellent interobserver reliability for Achilles tendons (0.92-0.95). 47 UTC data acquisition was based on previously published standardized protocols 11,39,47 : all patients were in the prone position with their foot hanging over the examination couch and their ankle in maximal dorsiflexion. 3 Tendon structure was quantified with an ROI covering the CSA of the tendon in the axial plane. Starting from the proximal border of the calcaneus, where there was no bony attachment of the tendon, the insertion part of the Achilles tendon was contoured with ROIs at intervals of 2 mm (every 10th image) covering 2 cm, and the midportion at intervals of 4 mm (every 20th image) covering 2 cm above the calcaneus to 6 cm proximal. Using the standardized UTC algorithm (17 continuous images), tendons were classified into 4 color-coded echo types providing semihistological information 47 :
Type 1: intact and aligned tendon bundles (green)
Type 2: discontinuous wavy tendon bundles (blue)
Type 3: mainly fibrillar (red)
Type 4: mainly amorphous matrix (black)

Grayscale and color-coded ultrasound tissue characterization (UTC) sagittal images of the midportion. The yellow lines represent the contoured areas of measurement. Images show a thickened tendon with UTC echo type 3 (red) corresponding to the areas of hypoechogenicity in the grayscale image.
Imaging Protocol: MRI Data Acquisition
MRI was performed using a 1.5-T scanner (Ingenia; Philips). With the patients in the supine position, the ankles and calves were positioned in a head array. We conducted the following sagittal and axial sequences (slice thickness, 3 mm; sections: sagittal, 21-23; axial, 35-39; field of view [FOV], 150-180 mm) (Figure 5).

Magnetic resonance imaging (MRI) scan demonstrating a thickened midportion with an intratendinous hyperintense area.
The standardized MRI protocol consisted of high-resolution T2-weighted turbo spin-echo (TSE) sequences in 2 planes (axial, sagittal), with FOV in the frequency encode direction (FOVf) of 160 mm, slice thickness 3 mm, reconstruction matrix 512 × 512, voxel size 0.31/0.31, and sense factor 1.5. Furthermore, a proton density–weighted TSE sequence with spectral attenuated inversion recovery (PDW-TSE-SPAIR) fat suppression was acquired in 2 planes (axial, sagittal), with FOVf 160 mm, slice thickness 3 mm, acquisition matrix 512 × 512, voxel size 0.25/0.25, and sense factor 1.5. Finally, a T1-weighted TSE sequence in the sagittal plane was acquired, with FOVf 160 mm, slice thickness 3 mm, reconstruction matrix 512 × 512, voxel size 0.31/0.31, and sense factor 1.5.
The AP diameter and the CSA at the thickest part of the tendon on axial images of the insertion and midportion were evaluated on MRI. The type of insertion of the plantaris tendon was classified based on the simplified scheme of Dos Santos et al 12 : insertion (1) anteromedially and (2) medially to the Achilles tendon, (3) fusing with the Achilles tendon. The CSAs of intratendinous lesions were measured at the thickest part on axial sections in the PDW-TSE-SPAIR sequence. Images were graded by Likert scale according to the internal architecture, signal intensity, and fiber texture (Table 1).
Multimodal Imaging Findings of Patients With Insertional and Midportion AT (T 0, T 1) Compared With the Control Group a
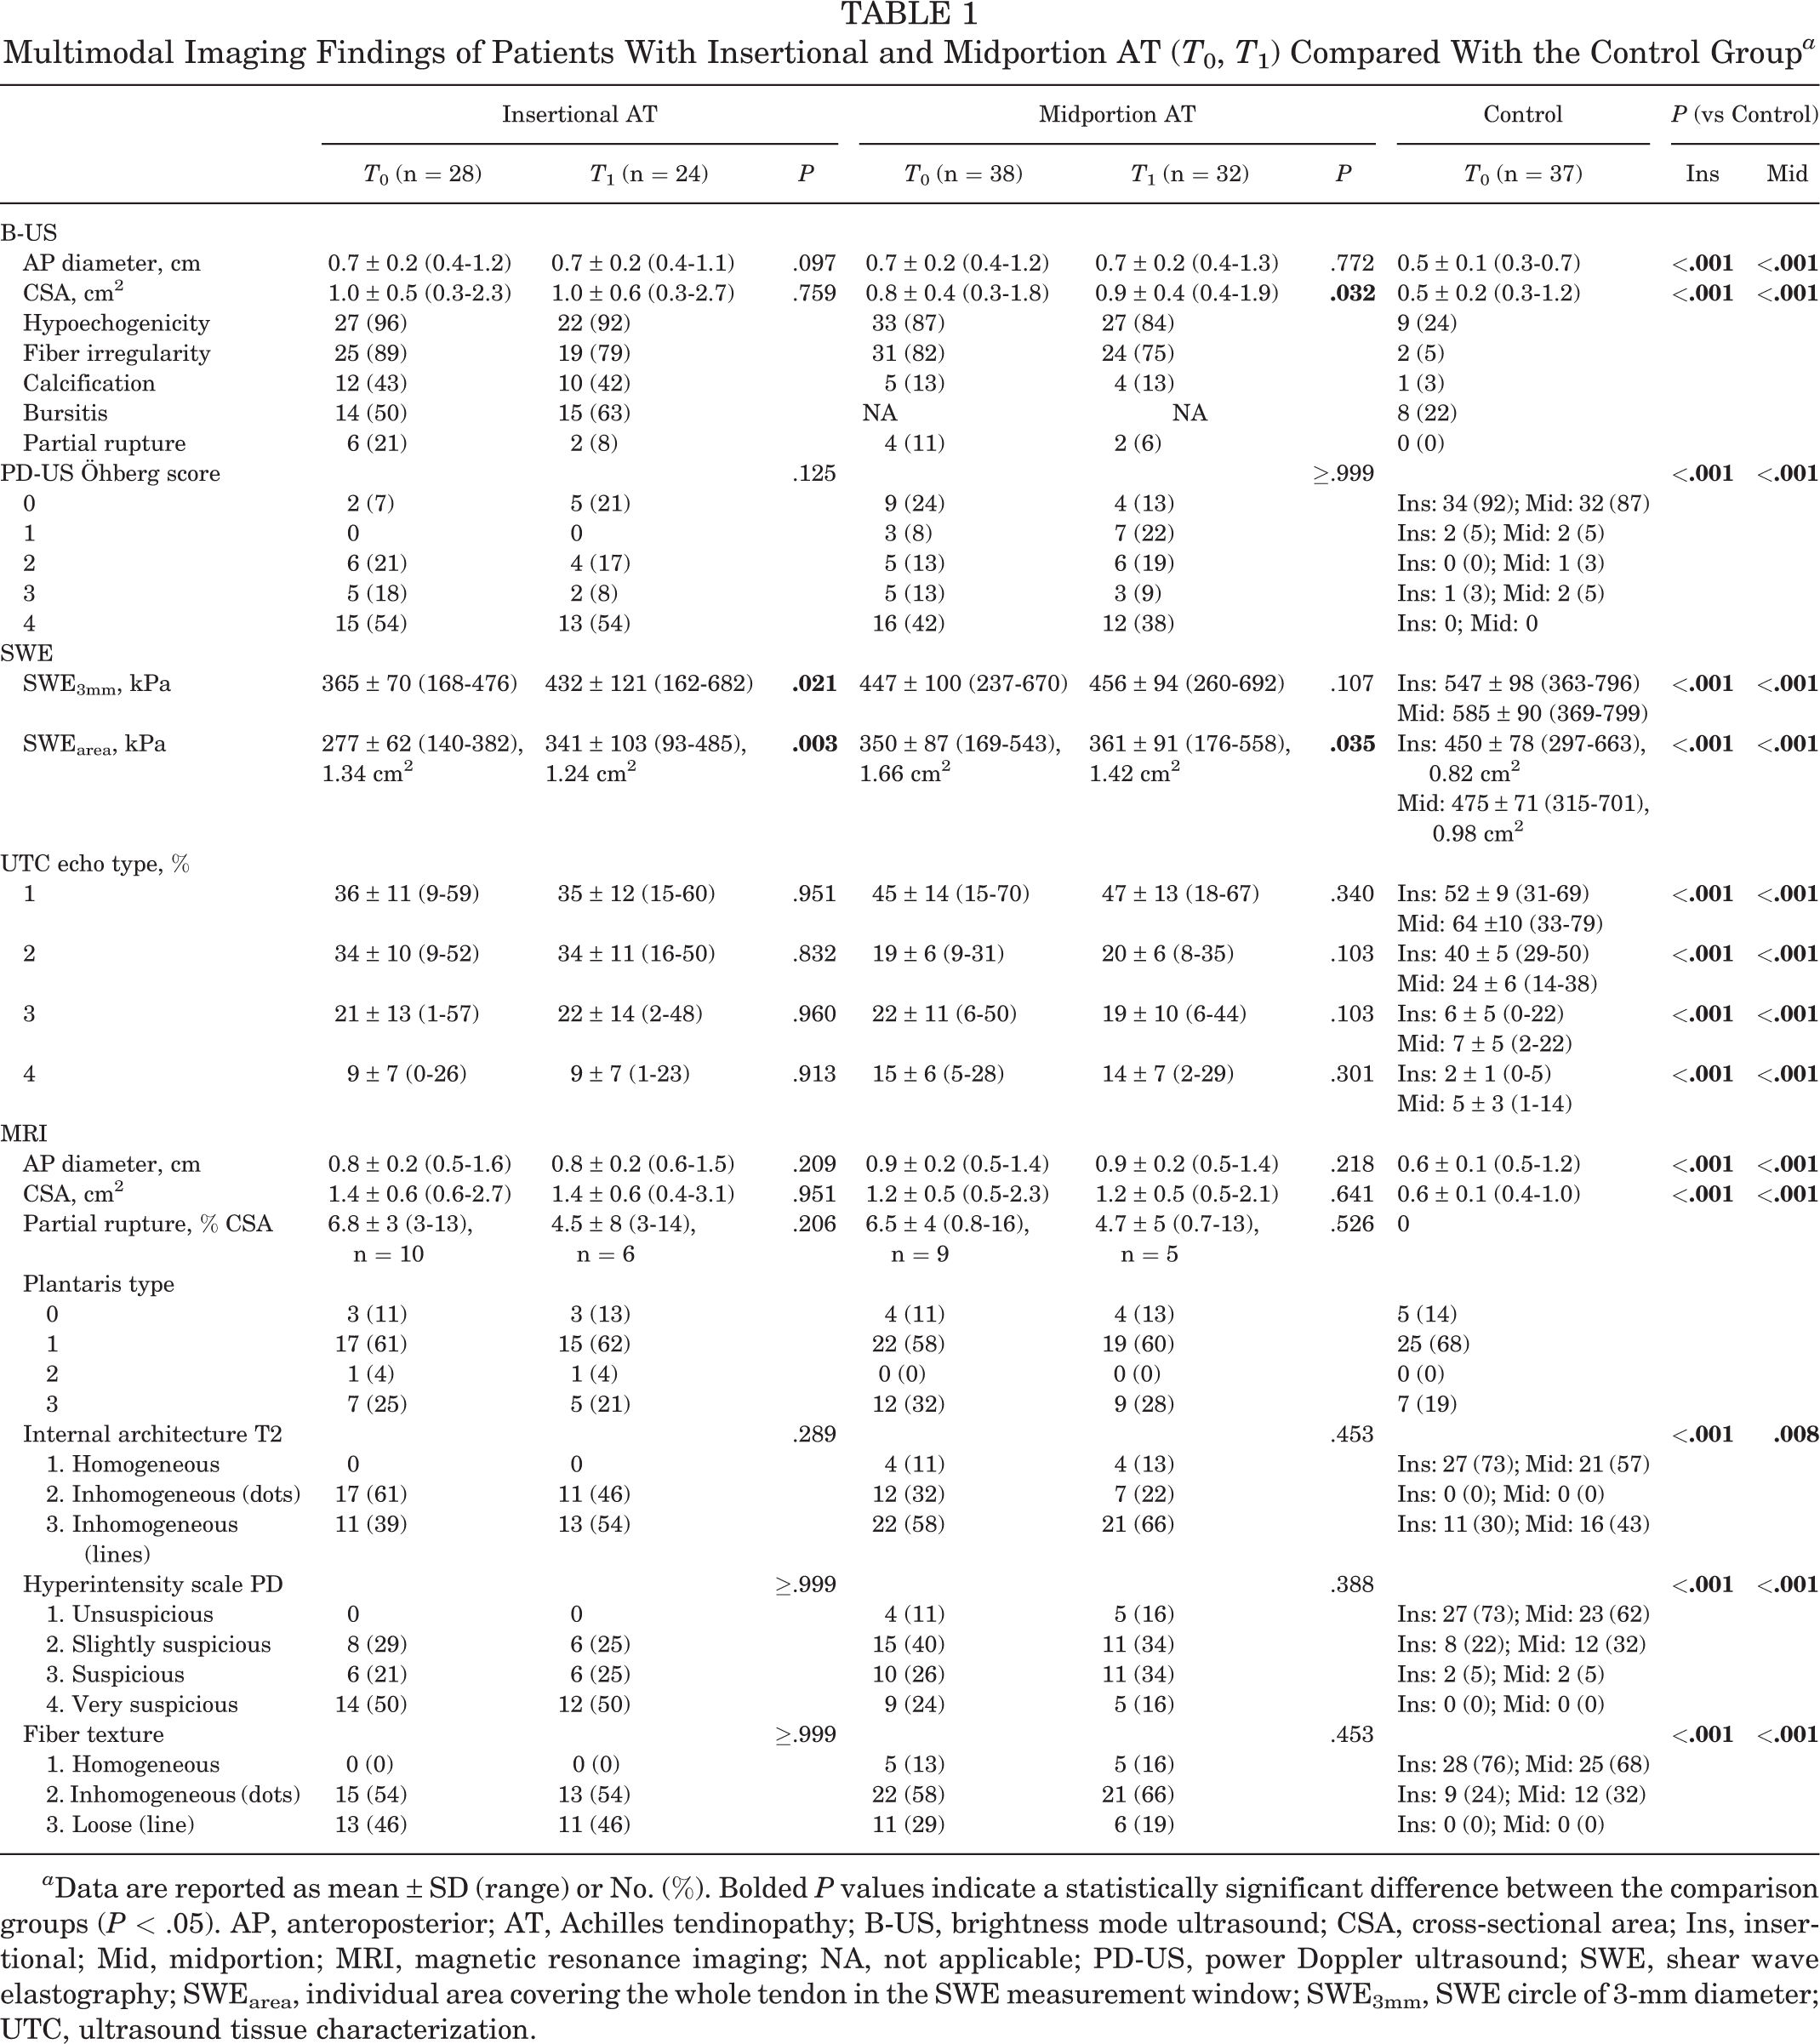
a Data are reported as mean ± SD (range) or No. (%). Bolded P values indicate a statistically significant difference between the comparison groups (P < .05). AP, anteroposterior; AT, Achilles tendinopathy; B-US, brightness mode ultrasound; CSA, cross-sectional area; Ins, insertional; Mid, midportion; MRI, magnetic resonance imaging; NA, not applicable; PD-US, power Doppler ultrasound; SWE, shear wave elastography; SWEarea, individual area covering the whole tendon in the SWE measurement window; SWE3mm, SWE circle of 3-mm diameter; UTC, ultrasound tissue characterization.
Data Analysis and Quantitative and Semiquantitative Assessment of Diagnostic Accuracy
Data were collected separately for the midportion and insertion of the tendon. Imaging parameters were either quantitative (eg, tendon diameter) or based on a 3-point or 4-point Likert scale (eg, for MRI parameters such as hyperintensity scale PD).
The collected data were then examined for their grade of diagnostic accuracy, which was defined as excellent (0.9-1.0), very good (0.8-0.89), good (0.7-0.79), sufficient (0.6-0.69), bad (0.5-0.59), or test not useful (<0.5). 44 The diagnostic values sensitivity, specificity, and diagnostic accuracy were evaluated based on objective quantitative data with strict cutoff values using ROC analysis and on a semiquantitative Likert scale–based assessment of experienced physicians. For the ROC analysis, there was at least 1 quantitative parameter for each studied imaging modality except for PD-US, which offered ordinally scaled score values. The semiquantitative assessment was based on the weighted interpretation of 2 blinded examiners (M.G., T.D.). Disagreements were mutually debated and solved with a third examiner (S.S.). The semiquantitative assessment was not possible for SWE, which only offers quantitative values.
Statistical Analysis
Descriptive data are presented as means with standard deviations. For ROC curve comparison, MedCalc 19.5.3 (MedCalc Software Ltd) was used. Normal distribution was evaluated with a Kolmogorov-Smirnov test. Nonpaired and paired t tests were used to examine the quantitative parameters of SWE, UTC, MRI, and B-mode for statistically relevant differences. The sample sign test and Mann-Whitney U test were used to study the grading parameters of MRI and PD-US.
As there were no established cutoff values for quantitative parameters in the current literature, an ROC analysis was used for assessment of diagnosis and monitoring and tested for statistical difference with the approach of DeLong et al. 7 Semiquantitative assessment was compared with a McNemar test. 14 The correlation between imaging parameters and the VISA-A score was assessed using the Pearson correlation test. For all analyses, SPSS Version 24.0 (IBM Corp) was used to assess statistical significance, which was defined as P < .05.
Results
Table 2 gives an overview of the patient and clinical data of the study cohort. Compared with the control group, symptomatic patients were older (insertion, P < .001; midportion, P = .004) and had a higher BMI (insertion, P = .001; midportion, P = .003).
Characteristics of the Different Cohorts a

a Data are reported as No. or mean ± SD (range). AOFAS, American Orthopaedic Foot & Ankle Society; AT, Achilles tendinopathy; BMI, body mass index; NA, not applicable; VISA-A, Victorian Institute of Sports Assessment.
b Significant difference versus control: insertional, P = .001; midportion, P = .003.
c Significant difference versus control: insertional, P < .001; midportion, P = .004.
Diagnosis
Table 1 compares imaging findings between patients with AT and the asymptomatic control group. Symptomatic insertional and midportion tendons had significantly altered parameters on all imaging modalities (P < .001). Symptomatic tendons had a higher CSA and AP diameter in B-mode and MRI, a higher Öhberg score in PD-US, a decreased Young's modulus in SWE, and a more pathological structure in MRI and UTC (P < .001) (Table 1). Hence, the ROC analyses detected a high degree of selectivity with significant area under the curve (AUC) values in all parameters for both insertional and midportion AT (AUC, 0.658-0.948; P < .001) (Table 3). Comparing the semiquantitative versus quantitative assessment of MRI and B-mode, there was no significant difference in diagnostic accuracy between insertional (P = .289-.549) and midportion (P = .454-.722) AT.
Diagnosis of Insertional AT
According to quantitative values for insertional AT, MRI CSA showed the highest diagnostic accuracy, with 89% in the ROC analyses (AUC, 0.911; P < .001) (Table 3). However, the quantitative parameters for SWE3mm, SWEarea, B-mode CSA, and UTC echo type 4 also had a good diagnostic accuracy, with over 85% based on the ROC analyses (Table 3). Thus, for insertional AT there was no detectable significant difference of one quantitative imaging parameter over the others (P = .065-.941), except that all imaging modalities had a significantly higher diagnostic accuracy compared with UTC echo type 2 (P < .001-.01). Semiquantitative assessment showed that MRI and PD-US were the most favorable for detecting insertional AT with an excellent diagnostic accuracy of 95%, whereas B-mode (88%) and UTC (83%) revealed a lower potential. However, for semiquantitative assessment of insertional AT, there was no detectable significant difference in favor of one imaging modality over the others (P = .065-.625), except that all imaging modalities revealed significantly better results than UTC (P = .001-.002).
Diagnostic Accuracy for Insertional AT a
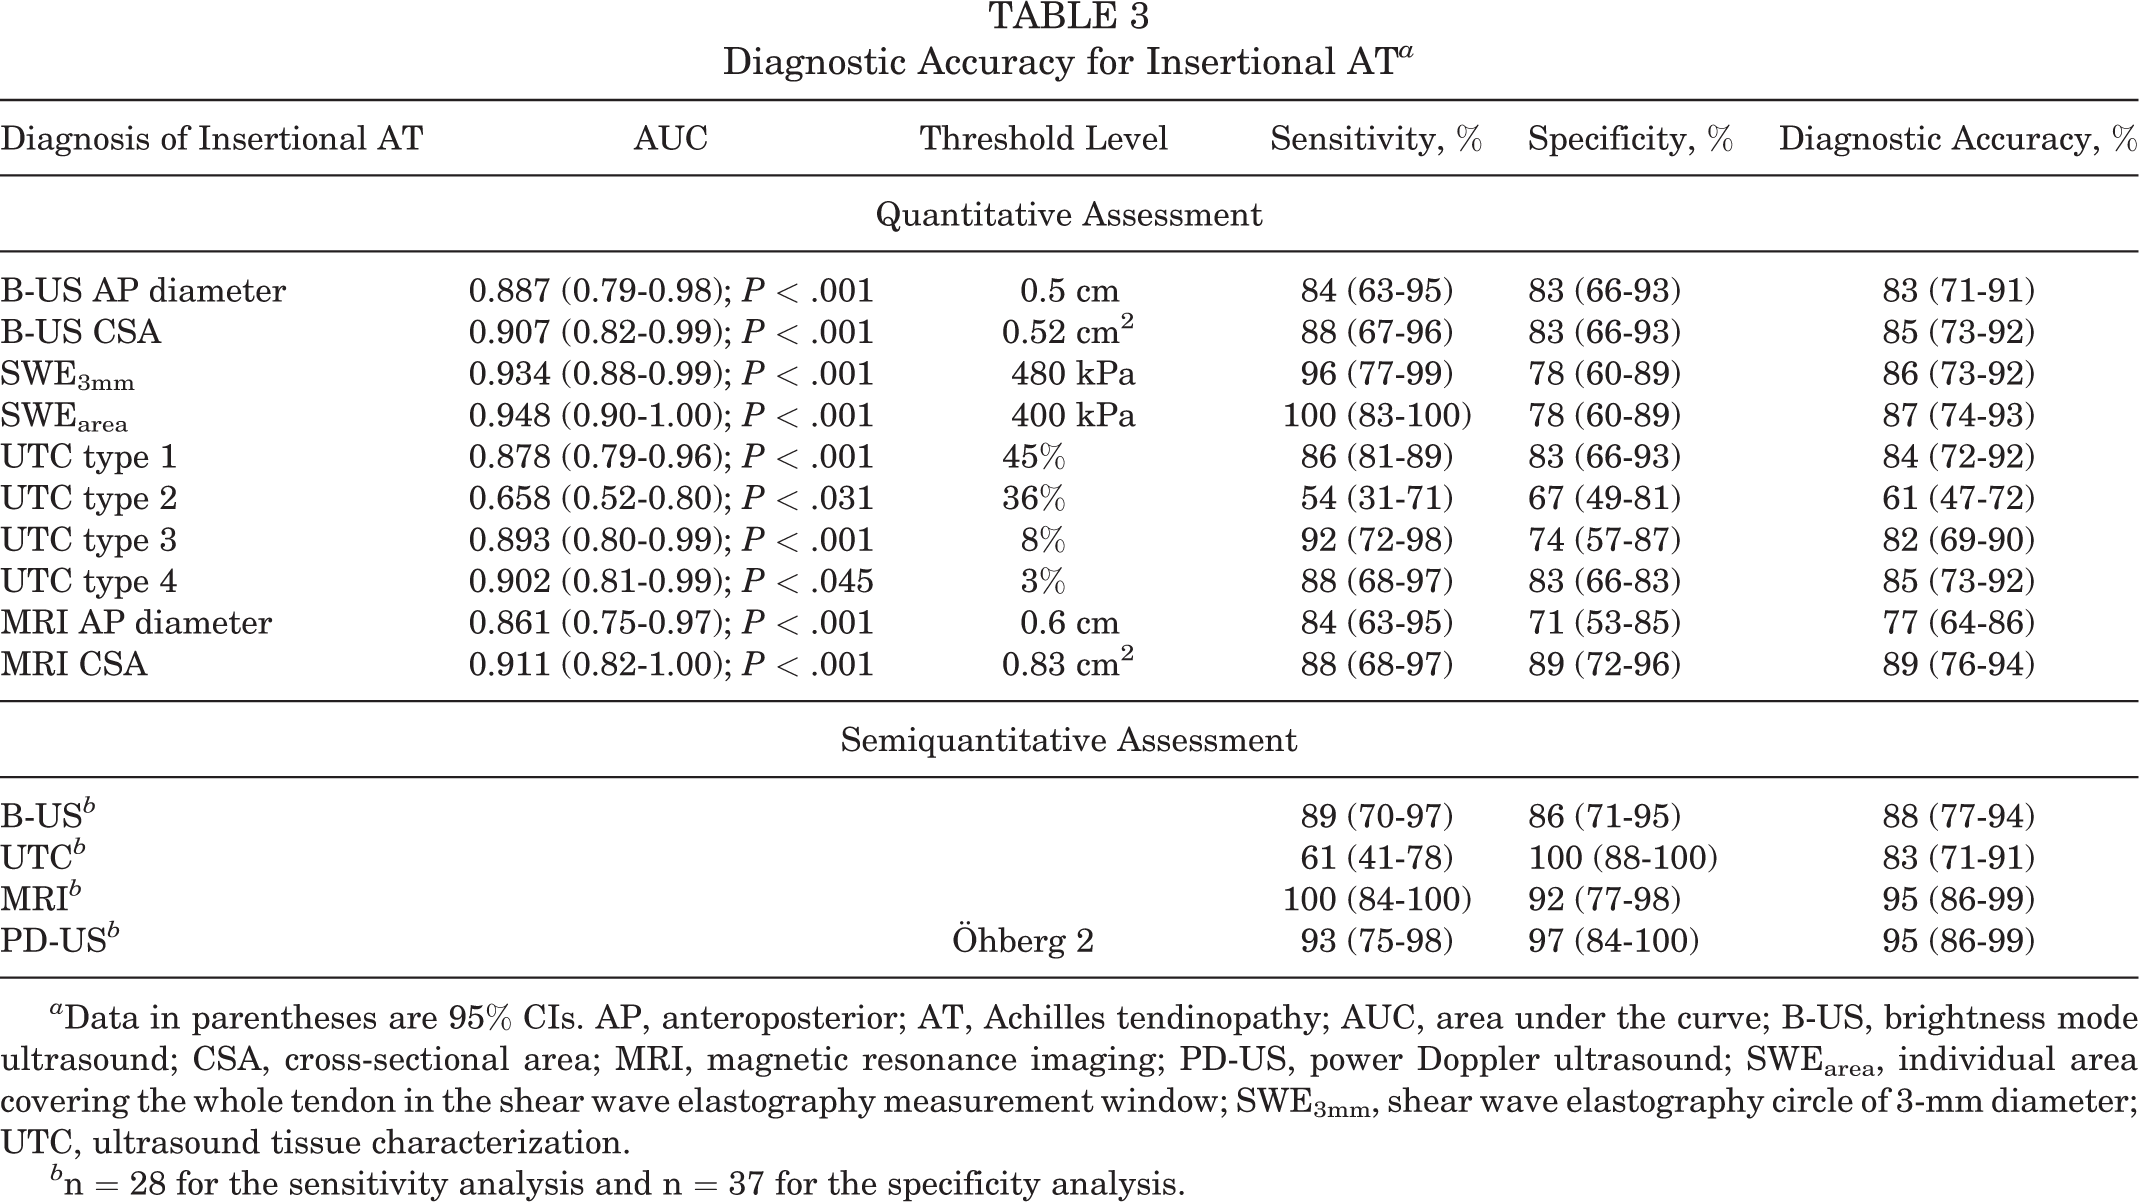
a Data in parentheses are 95% CIs. AP, anteroposterior; AT, Achilles tendinopathy; AUC, area under the curve; B-US, brightness mode ultrasound; CSA, cross-sectional area; MRI, magnetic resonance imaging; PD-US, power Doppler ultrasound; SWEarea, individual area covering the whole tendon in the shear wave elastography measurement window; SWE3mm, shear wave elastography circle of 3-mm diameter; UTC, ultrasound tissue characterization.
b n = 28 for the sensitivity analysis and n = 37 for the specificity analysis.
Diagnosis of Midportion AT
For midportion AT, the quantitative values of UTC echo type 3 (86%) and type 4 (87%) revealed the highest diagnostic accuracy based on a strong detectable discriminatory power (AUC, 0.911 and 0.941; P < .001) (Table 4). Interestingly, UTC echo type 2 had the lowest diagnostic accuracy (71%; AUC, 0.730; P = .001). The other quantitative imaging parameters yielded values between 76% and 81% (Table 4). However, for quantitative assessment in midportion AT there was no significant difference in favor of one imaging modality over the others (P = .062-.994). Only the AP diameter for UTC type 4 versus B-mode (P = .015), area for UTC type 2 versus SWE (P = .033), and AP diameter for UTC type 2 versus MRI (P = .014) revealed significant differences in the ROC curve comparison.
Based on the semiquantitative assessment, MRI and B-mode were the most favorable modalities with a diagnostic accuracy of 87%, but UTC revealed a good diagnostic accuracy with 84%. Despite good results for detecting insertional AT, PD-US only yielded a diagnostic accuracy of 75% for midportion AT (Table 4). Nevertheless, for semiquantitative assessment of midportion AT, there was no further significant difference in favor of one imaging modality over the others (P = .06-.607).
Diagnostic Accuracy for Midportion AT a

a Data in parentheses are 95% CIs. AP, anteroposterior; AT, Achilles tendinopathy; AUC, area under the curve; B-US, brightness mode ultrasound; CSA, cross-sectional area; MRI, magnetic resonance imaging; PD-US, power Doppler ultrasound; SWEarea, individual area covering the whole tendon in the shear wave elastography measurement window; SWE3mm, shear wave elastography circle of 3-mm diameter; UTC, ultrasound tissue characterization.
b n = 38 for the sensitivity analysis and n = 37 for the specificity analysis.
Correlation
Despite the overall strong potential for diagnosis of insertional and midportion AT, only a few imaging parameters showed a significant correlation between tendon properties and the VISA-A score. Accordingly, midportion AT, UTC echo type 1 (r = 0.405; P = .012), UTC echo type 3 (r = –0.389; P = .016), and MRI fiber texture (r = –0.325; P =.046) revealed moderate correlations, whereas, especially in insertional AT, no correlation between symptoms and imaging parameters was detectable (r = –0.298 to 0.202; P = .124-.946).
Monitoring
Compared with baseline (T 0), the VISA-A and AOFAS scores showed a significant increase for both the insertion (VISA-A, +16 points [t = –5.809; P < .001]; AOFAS, +9 points [t = –4.706; P < .001]) and the midportion (VISA-A +18 points [t = –4.960; P < .001]; AOFAS, +12 points [t = –6.263; P < .001]) areas. Symptom decrease was further confirmed by the Roles and Maudsley score, showing that after 6 months 66% and 63% had good and excellent outcomes for insertional and midportion AT, respectively (Table 2). Despite symptom improvement, significant alteration in imaging parameters was observed only for SWE, showing an increased Young's modulus (P = .003-.35) (Table 1), whereas B-mode, PD-US, UTC, and MRI were not able to display the effect of clinical improvement after 6 months (P = .097 to ≥.999) (Table 1). However, the only significant correlation between the absolute changes in the VISA-A score and absolute differences in imaging parameters was found for MRI AP diameter, with a reduction in tendon thickness correlating with the VISA-A score (r = –0.473; P = .006). There were no further correlations between the clinical outcome score and imaging parameters for both insertional and midportion AT (insertion, r = –0.258 to 0.218, P = .232-.907; midportion, r = –0.308 to 0.209, P = .086-.831).
In general, the capacity for detecting symptom improvement of insertional and midportion AT in imaging parameters was low (Table 5). For detecting quantitative changes in insertional AT, MRI CSA (AUC, 0.717; P = .093) and SWE3mm (AUC, 0.633; P = .302) revealed the highest diagnostic accuracies, with 79% and 71%, respectively. According to the quantitative assessment in midportion AT, SWE3mm (AUC, 0.539; P = .715) and MRI AP diameter (AUC, 0.719; P = .043) yielded the highest diagnostic accuracies, with 60% and 59%, respectively. In an overall comparison for monitoring insertional AT, SWE had the highest overall diagnostic accuracy (71%), with a significant difference compared with MRI (P = .002), PD-US (P = .021), and UTC (P = .039). In an overall assessment for monitoring midportion AT, a further significant difference of SWE compared with MRI (P = .011), B-mode (P = .001), and PD-US (P = .008) was detectable, but the general diagnostic accuracy of SWE was poor (60%).
Monitoring Capacity of Insertional and Midportion AT a
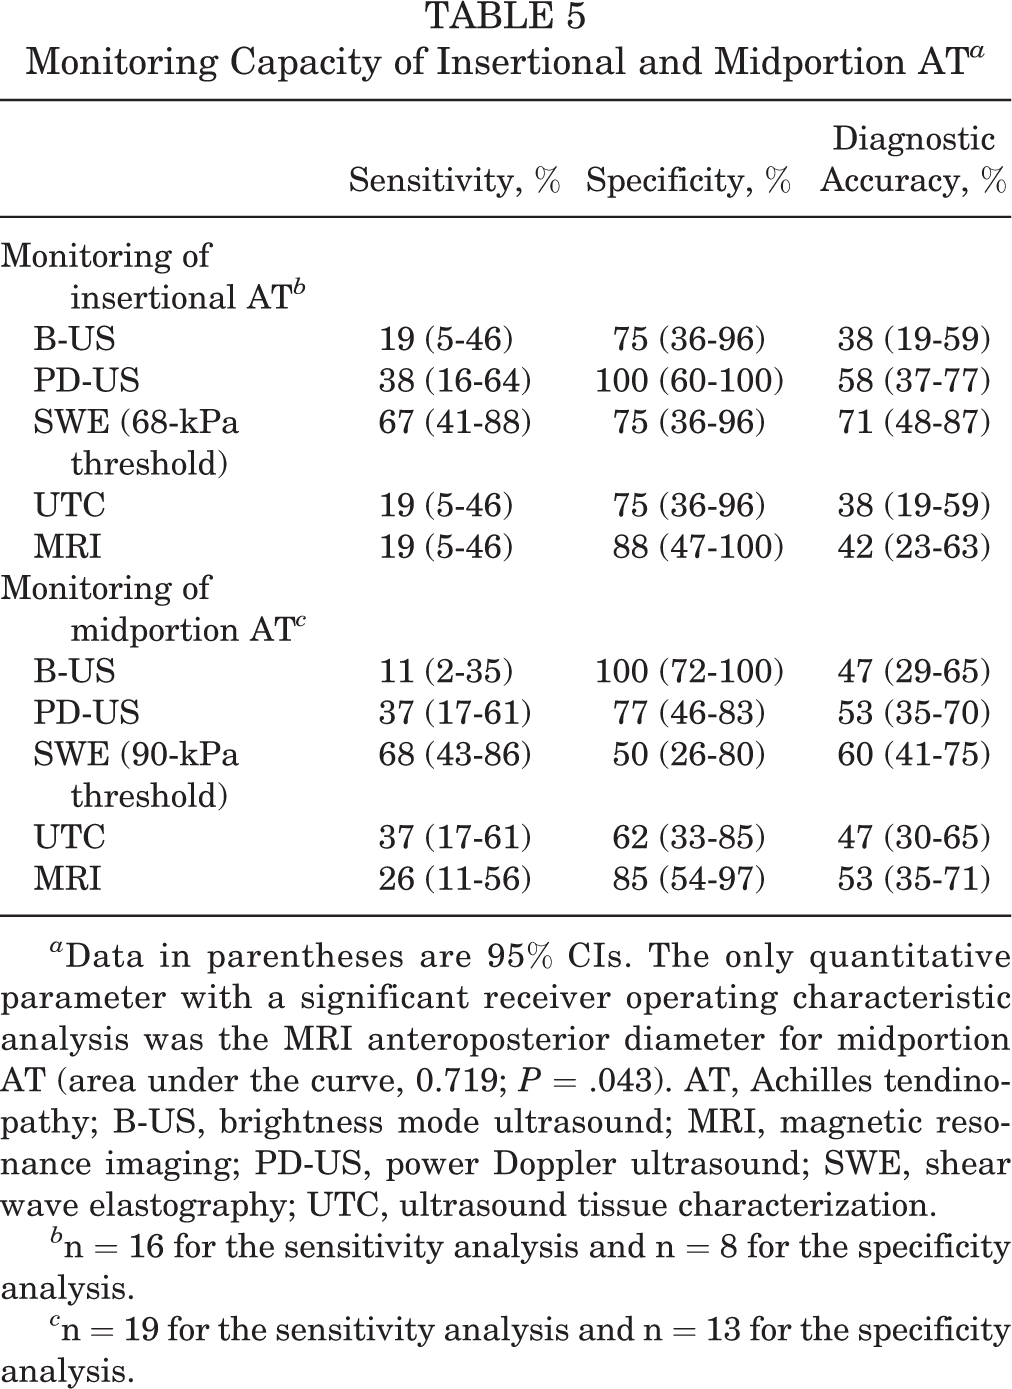
a Data in parentheses are 95% CIs. The only quantitative parameter with a significant receiver operating characteristic analysis was the MRI anteroposterior diameter for midportion AT (area under the curve, 0.719; P = .043). AT, Achilles tendinopathy; B-US, brightness mode ultrasound; MRI, magnetic resonance imaging; PD-US, power Doppler ultrasound; SWE, shear wave elastography; UTC, ultrasound tissue characterization.
b n = 16 for the sensitivity analysis and n = 8 for the specificity analysis.
c n = 19 for the sensitivity analysis and n = 13 for the specificity analysis.
Discussion
To the best of our knowledge, this is the first study to evaluate and compare multiple noninvasive imaging modalities for AT. Our results showed that MRI in particular had excellent accuracy for diagnosing AT (insertion, 95%; midportion, 87%). Compared with MRI, PD-US (95%) seemed to be a considerable alternative for detecting insertional AT, whereas B-mode (87%), and UTC echo type 3 (86%) and type 4 (87%) yielded similar results in detecting midportion AT. However, it has to be emphasized that there was no statistically significant difference between the imaging modalities, and all imaging modalities showed a good diagnostic accuracy range. Therefore, each modality might legitimately be used. Nevertheless, we have to reject our hypothesis that the novel techniques SWE and UTC reveal a superior diagnostic accuracy compared with the established methods. Thus, even though there was no statistically relevant benefit, we feel that for clinical usage based on our results, the conventional and commonly accessible methods B-mode, PD-US, and MRI remain the gold standard for diagnosis.
Concerning monitoring capacity, the examined modalities yielded poor results with limited value. It is already known that tendon imaging shows limited structural changes in response to conservative nonoperative treatment, which might be partly supported by our results. 4,5,10,13 Even though clinical symptoms improved significantly, only SWE3mm, MRI CSA, and MRI AP diameter were able to detect significant tendon changes (P = .003-.035) after 6 months. SWE3mm had a significantly better overall diagnostic accuracy for monitoring AT compared with the other modalities, but still revealed fair or rather poor results (insertion, 71%; midportion, 60%). However, symptom improvement is not necessarily related to structural tendon improvement. 4,5,10,13 Therefore, the correlation of imaging parameters with the initial VISA-A or VISA-A score changes was also low.
This study also compared the diagnostic accuracy for diagnosing and monitoring between a Likert scale–based semiquantitative tendon assessment by experienced physicians and an assessment by objective quantitative values (diameter, SWE values, etc). The results showed that semiquantitative assessment of B-mode and MRI revealed no statistical difference compared with quantitative values (Tables 3 and 4), even if the values were slightly higher. In the context of the growing field of artificial intelligence, the aforementioned might be interesting for future studies, as tendon diagnosis might also be sufficiently assessed by the combination of various factors and weighted interpretation by an experienced physician instead of only considering a single quantitative parameter.
B-mode yielded comparable diagnostic accuracy (87%) compared with MRI for midportion AT. This is in line with previous studies, reporting a sensitivity of 0.65 to 0.96 and a specificity of 0.68 to 1.00. 21,23,40 However, for insertional AT, MRI revealed a higher diagnostic accuracy than B-mode (95% vs 88%), which might be mainly based on the improved depiction of accompanying pathologies such as bursitis or bone bruises in MRI. Nevertheless, high-frequency B-mode is recommended as the first-line diagnostic tool because of its cost-effectiveness and accessibility, offering a sufficient evaluation of tendon fiber integrity. 10,40 However, it has to be kept in mind that the monitoring capacities of B-mode and correlation with clinical scores are limited. 9,10
PD-US revealed a diagnostic accuracy (95%) similar to that of MRI for insertional AT. Interestingly, previous studies stated a wider range of sensitivity (47%-100%) and reduced specificity (0%-50%) for PD-US, which might be partly based on selection bias and high neovascularization rates in active populations with high-loaded tendons. 18,41,46,49 Moreover, previous studies that reported reduced specificity included the asymptomatic side of unilateral AT as a healthy nonpathological control, which might have influenced findings since (subclinical) pathological findings in UTC, B-mode, and PD-US are also present in the asymptomatic side. 8,39,41 On the other hand, there are some methodological aspects of the present study that might have contributed to higher diagnostic values for PD-US, since the threshold for positive PD-US findings was adjusted to Öhberg grade 2 to avoid a high rate of false-positive results. Moreover, in contrast to previous studies, the present work differentiated between insertional and midportion AT, showing that for midportion AT the diagnostic accuracy was lower (75% vs 95%, respectively). Hence, these separate analyses might also explain the high diagnostic accuracy of PD-US for insertional AT.
UTC had the highest diagnostic accuracy for diagnosing midportion AT (UTC echo type 3 and 4, 86% and 87%, respectively) based on quantitative thresholds. However, the UTC algorithm is based on ultrasound echo patterns, which explains why an examination with a high-resolution B-mode (87%) revealed equal findings compared with UTC for detecting midportion AT. This might scale down the need for a time-consuming UTC scan and data analysis. Because of a different collagen fascicle pattern at the insertion and possible interference caused by calcification, the diagnostic accuracy for insertional AT was lower, and UTC did not show a relevant benefit compared with the other modalities. To the best of our knowledge, comparative data according the diagnostic accuracy of UTC are currently not available. However, there are a few studies about UTC tendon monitoring showing, on one hand, no changes in tendon structure after 24 weeks of eccentric exercises, but demonstrating, on the other hand, significant tendon changes 24 weeks after injection therapy or plantaris tendon scraping. 5,6,29
SWE did not show a superior diagnostic benefit in detecting insertional or midportion AT in comparison with the other diagnostic modalities. In a previous study, it was demonstrated that SWE increases the diagnostic accuracy up to 96% when used in combination with B-mode and PD-US. 8 However, this benefit is not comparable with the present study, because of the coherent usage of imaging modalities and a different measurement setup in combination with a pooled analysis of several tendon locations (patella, wrist extensor, and Achilles tendons). 8 Nevertheless, in the present study SWE had the best overall capacity for monitoring clinical symptoms (insertion, 71%; midportion, 60%). This is in line with a 2018 study showing a superior sensitivity of SWE to detect treatment effects after 24 weeks compared with B-mode and PD-US. 9 In general, results of the present study suggest that symptom decrease is not related to structural improvement such as collagen fiber rearrangement, but rather biochemical or neural mechanisms. 13 In the context of SWE, the increase of tendon elasticity might instead be based on a biochemical tendon adaption with lower levels of water-binding proteins such as aggrecan or versican, which prohibit adequate fascicle sliding in the edematous swollen tendon during locomotion. 1,15 However, the present study cannot provide the histological confirmation for this hypothesis.
The semiquantitative visual assessment of MRI scans revealed the highest overall diagnostic accuracy (insertion, 95%; midportion, 87%). Nevertheless, it has to be emphasized that the selected MRI sequences (T2 <10 ms) do not allow direct evaluation of the hypointense tendon structure, since H+ protons bound to collagen have T2 relaxation times <1 ms to 10 µs. 2,17 Hence, the focus is on detecting areas of increased signal within the tendon, but physician experience is required to ensure that a punctiform or linear increased signal is not misinterpreted as a pathological change instead of physiological connective tissue. 17 Moreover, MRI is able to evaluate structures that lay beyond the possibilities of ultrasound, such as characterization of bone bruises or partial ruptures, which might have substantial influence on adequate treatment (Table 1). 16,22,29
Even though ultrasound techniques have improved over the years, MRI still detected the most partial ruptures. B-mode might not adequately differentiate between partial tendon tears from local degenerative lesions, as has been shown previously. 16,34 However, we did not confirm the presence of partial ruptures by biopsies or intraoperative findings, and further research is required to assess the capacity of high-frequency ultrasound probes in detecting partial ruptures. 16 Interestingly, the quantitative MRI parameters CSA (79%) and AP diameter (59%) showed good to moderate diagnostic accuracy for insertional and midportion AT monitoring, respectively. This is in line with previous studies that showed a significant decrease of tendon volume and CSA after 24 weeks of eccentric exercises. 43,45 However, compared with SWE, which also stated an equal monitoring potential, it is questionable if a further costly and time-consuming MRI scan is justified.
Limitations
The results of the present study require interpretation in light of the following limitations. The present study is rather a longitudinal than a classic diagnostic study, which would have required a much larger sample size, and therefore a possible selection bias might have led to overestimation of the accuracy and specificity. 10,25 Nevertheless, our study had the largest sample size compared with previous studies. 8,9,23,31,34 Moreover, it would have been interesting to study long-term outcomes regarding the inadequate monitoring capacities of MRI and B-mode after 12 or 24 months, which might have also been related to an inadequate home-based training program. 23 Additionally, there was no matched control group, and having a younger control group might have artificially increased the difference between symptomatic and control tendons and the ROCs. A further limitation was the overall lack of established thresholds, especially for recent technologies such as UTC and SWE, and the acquired parameters of the present study might not be suitable for further studies, although they are based on ROC analyses. Comparison with contrast-enhanced ultrasound imaging or ultrashort echo time MRI sequences would have revealed further relevant findings. 17,37 However, we aimed to only use noninvasive imaging modalities and commonly used MRI sequences, thus representing a general nonacademic setting. 2
Conclusion
The present study showed that there is no clear benefit to using the quantitative and less commonly accessible modalities of UTC and SWE for the diagnosis of AT compared with the general assessment with PD-US and B-mode. Although there was no detectable statistically significant difference between the imaging modalities, because of its high availability, PD-US might be the recommended technique for insertional AT and B-mode for midportion AT, as they had comparable diagnostic accuracies with MRI. However, if in doubt, MRI is recommended as having the highest overall diagnostic accuracy. Symptom monitoring is challenging with a generally low diagnostic accuracy, but SWE seemed to be the most suitable imaging modality.
Footnotes
Final revision submitted January 20, 2021; accepted February 8, 2021.
One or more of the authors has declared the following potential conflicts of interest or source of funding: This study was supported by the START and Clinician Scientist program of the Medical Faculty of RWTH University Aachen (to M.G.). AOSSM checks author disclosures against the Open Payments Database (OPD). AOSSM has not conducted an independent investigation on the OPD and disclaims any liability or responsibility relating thereto.
Ethical approval for this study was obtained from the RWTH University.