
Abstract
Background:
Knee joint-line orientation is altered after open-wedge high tibial osteotomy (OWHTO), and excessive joint-line obliquity (JLO) can adversely affect outcomes. Little is known regarding preoperative prediction of postoperative knee JLO.
Purpose/Hypothesis:
The purpose of this study was to assess the correlation between the amount of lower limb adduction and changes in knee JLO after OWHTO. The hypothesis was that postoperative knee JLO could be predicted using the amount of lower limb adduction after OWHTO.
Study Design:
Case series; Level of evidence, 4.
Methods:
The records of 67 patients (77 knees) who underwent OWHTO for medial compartment osteoarthritis were retrospectively reviewed. The mechanical hip-knee-ankle (HKA) axis, lateral distal femoral angle, medial proximal tibial angle (MPTA), knee JLO, ankle JLO, and joint-line convergence angle were measured on standing whole-leg plain radiographs preoperatively and at 1 year postoperatively. The limb adduction angle was defined as the angle between the native weightbearing line (WBL) and the planned WBL on preoperative standing whole-leg plain radiographs. The predicted knee JLO was calculated as the sum of the preoperative knee JLO and the limb adduction angle. Multivariable linear regression analysis was used to identify the preoperative radiologic factors associated with the postoperative knee JLO. The agreement between postoperative and predicted values was determined using intraclass correlation coefficients (ICCs).
Results:
The estimated limb adduction angle was 4.2° ± 1.3°, and the predicted knee JLO was 4.9° ± 3.0°. The actual postoperative knee JLO was 4.5° ± 2.4°, which was a significant increase from 0.7° ± 2.4° preoperatively (P < .001). Excellent agreement was found between the predicted knee JLO and postoperative knee JLO (ICC = 0.928; P < .001). Limb adduction angle and changes in preoperative MPTA were significantly associated with changes in knee JLO (P < .001). On multivariable linear regression analysis, preoperative knee JLO and limb adduction angle were significantly associated with postoperative knee JLO (P < .001; R 2 = 0.83).
Conclusion:
Changes in knee JLO after OWHTO were associated with adduction of the lower limb after OWHTO. During preoperative planning, postoperative knee JLO can be predicted as the sum of the preoperative knee JLO and the limb adduction angle between the preoperative WBL and planned WBL.
Open-wedge high tibial osteotomy (OWHTO) is an effective treatment for medial compartment osteoarthritis in a knee with varus alignment and has gained popularity with advances in surgical technique and rigid fixation devices. 4 The goal of OWHTO is to realign the lower extremity by correcting the proximal tibia to redistribute medial compartment pressure toward the lateral compartment. 7,21
Lower limb realignment through correction of the proximal tibia induces inevitable changes in knee joint orientation on the coronal plane. This becomes more obvious when there is a large correction of the tibia. Increased joint-line obliquity (JLO) >4° results in excessive shear forces on the articular surface, which eventually have an adverse effect on OWHTO outcomes. 1,2,14,23 Several strategies, such as double osteotomy and intentional undercorrection, have been proposed to maintain knee joint-line orientation. When treatment decisions are made, the prediction of postoperative knee JLO should be given priority. 3 However, although studies have reported factors associated with postoperative JLO, including preoperative JLO, correction angle, and medial proximal tibial angle (MPTA), a simple and accurate method to preoperatively predict postoperative knee JLO has not been introduced. 1,20
Changes in lower extremity alignment cause a compensatory reaction in the hip and ankle joints adjacent to the knee, and previous studies 9,17 have focused mainly on changes in the ankle joint. Because this compensation also occurs in the hip joint, resulting in adduction of the lower limb after OWHTO, the relationship between the hip joint and changes in JLO should be elucidated.
The purpose of this study was to estimate the amount of lower limb adduction after OWHTO and assess the correlation between the amount of lower limb adduction and changes in knee JLO after OWHTO. We also aimed to devise a simple and accurate method for predicting postoperative knee JLO preoperatively. The hypothesis was that postoperative knee JLO could be predicted with the amount of lower limb adduction after OWHTO.
Methods
This study was approved by the institutional review board of our institution. We reviewed the medical records of 77 consecutive patients (87 knees) who underwent OWHTO for medial compartment osteoarthritis in knees with varus alignment between January 2012 and December 2016. OWHTO was indicated for active patients with medial compartment osteoarthritis with varus alignment who had persistent medial compartment pain despite nonoperative treatment for >3 months. Although no limits were imposed regarding age, when the patient was physically active enough to participate in postoperative rehabilitation and wanted to preserve the knee joint without joint replacement, OWHTO was cautiously indicated in patients aged >60 years. The contraindications for OWHTO were medial compartment osteoarthritis of Ahlbäck grade >3, flexion contracture >15°, active inflammatory arthritis, lateral compartment osteoarthritis, and severe patellofemoral osteoarthritis.
Patients were included if they had an available standing whole-leg plain radiograph between 6 and 12 months postoperatively. Patients were excluded if they (1) underwent concomitant ligament procedures, (2) had a confirmed displaced lateral hinge fracture, or (3) had delayed or nonunion within 1 year postoperatively. Of the 87 knees, we excluded 7 knees that had undergone ligament procedures; 2 knees with displaced lateral hinge fractures; and 1 knee with delayed union, which was treated using an autologous bone graft. Thus, 77 knees in 67 patients (19 men and 58 women) were ultimately enrolled in this study. Patient characteristics are presented in Table 1.
Patient Characteristics (N = 77 Knees)

Surgical Procedures and Rehabilitation
Preoperative planning was performed through use of the true anteroposterior standing whole-leg plain radiograph with the patella facing forward using a picture archiving and communication system. The target weightbearing line (WBL) crossing the knee joint from the hip center to ankle center was determined to be around 62.5% of the width of the tibial plateau and was adjusted according to the degree of medial chondral wear. The correction angle was determined as described by Miniaci et al. 12 The size of the medial opening gap was measured on magnification plain radiograph using a 10-cm bar as a reference length. An anteromedial longitudinal skin incision was made on the proximal tibia. The superficial medial collateral ligament was released distally below the osteotomy level. The horizontal osteotomy plane was marked using 2 Kirschner wires starting at 3 to 4 cm below the medial joint line and obliquely oriented to the lateral hinge 2 cm distal to the lateral joint line at the level of the upper tip of the fibula under fluoroscopy. An anterior ascending osteotomy was made 1 cm behind the tibial tuberosity at an approximate 120° angle to the horizontal osteotomy. The medial gap was opened gradually using a laminar spreader according to preoperative plans. No grafts were used to fill the osteotomy gap. The proximal tibia was fixed using the TomoFix Osteotomy System (DePuy Synthes) under fluoroscopy. Partial-weightbearing walking was permitted during the first 2 weeks, followed by gradual full weightbearing at 6 to 8 weeks postoperatively.
Radiologic Parameters
All radiologic parameters were measured on the standing whole-leg plain radiograph preoperatively and 6 to 12 months postoperatively using picture archiving communication system. All of the radiologic parameters were measured independently by 2 orthopaedic surgeons (J-G.P. and B-S.L.), and the mean values were used in the analysis. The intraclass correlation coefficient (ICC) was assessed to determine the inter- and intraobserver reliability (obtained from values measured 1 week apart).
The mechanical hip-knee-ankle (HKA) axis was defined as the angle between a line drawn from the center of the femoral head to the center of the knee joint and a line drawn from the center of the knee joint to the center of the talus (varus, positive; valgus, negative). The lateral distal femoral angle was defined as the lateral angle formed between the lines of the mechanical femoral axis and the articular surface of the distal femur. The MPTA was defined as the medial angle formed between the mechanical tibial axis line and a line tangent to the proximal tibial plateau joint surface. The WBL was defined as a line drawn from the center of the femoral head to the center of the talus. The WBL ratio was calculated as the ratio between the tibial width and the width of the WBL tibial intersection (measured from the medial side with the medial tibial edge at 0% and the lateral tibial edge at 100%). The joint-line convergence angle (JLCA) was defined as the angle between the lines tangential to the articular surface of the distal femur and the proximal tibia. The knee JLO was defined as the angle between the line tangential to the articular surface of the proximal tibia and a horizontal line parallel to the ground (negative, joint line tilted medially relative to the horizontal line; positive, joint line tilted laterally relative to the horizontal line). The ankle JLO was defined as the angle between the line tangential to the articular surface of the talus and a horizontal line parallel to the ground.
The limb adduction angle was defined as the angle between the native WBL and the planned WBL on the preoperative standing whole-leg plain radiograph (angle β in Figure 1), which geometrically corresponded to the change in knee JLO after OWHTO. The predicted knee JLO was calculated as the sum of the preoperative knee JLO and the limb adduction angle (Figure 1).

Illustration of limb adduction angle measurement. (A) Line a indicates the weightbearing line (WBL), drawn from the center of the hip to the center of the ankle. (B) Line b represents the planned WBL, from the center of the hip through the knee target point to the center of the ankle. α indicates the correction angle. β, the angle between line a and line b, indicates the limb adduction angle. (C) After open-wedge high tibial osteotomy, lower limb adduction occurs (arrows indicate the direction of change), and (D) changes in knee joint-line obliquity correspond to the limb adduction angle (beta indicates the lamb adduction angle).
Statistical Analysis
The Kolmogorov-Smirnov test was used to determine normality. Differences between the pre- and postoperative radiologic parameters were determined using paired t test (normal distribution) or Mann-Whitney U test (nonnormal distribution). Correlations between changes in knee JLO and other radiologic parameters were determined using the Pearson correlation coefficient test.
Multivariable linear regression analysis was performed to identify the preoperative radiologic factors associated with postoperative knee JLO. The stepwise method was used to avoid multicollinearity problems, with the criteria for entry and elimination being P values of .05 and .1, respectively. The limb adduction angle used in the analysis was retrospectively estimated according to the postoperative WBL. It was measured as the angle between the preoperative WBL and a WBL virtually drawn on the preoperative radiograph that intersected the same point on the tibia as the postoperative WBL ratio.
Agreement between the predicted and postoperative knee JLO was determined using the ICC. Subgroup analysis between the predicted and postoperative JLO was performed to evaluate the errors attributable to soft tissue and was categorized as change in JLCA after OWHTO of ≤1° and >1°.
A post hoc power analysis (α error, .05; 1 – β error, .95) was performed to calculate the statistical power of multivariable linear regression analysis and ICC agreement using Power Analysis and Sample Size Software (NCSS). With a sample size of 77, the study was adequately powered to detect significance on multivariable linear regression analysis and ICC analysis with a power of 0.99 and 0.93, respectively.
All statistical analyses except the post hoc power analysis were performed using SPSS Version 21.0 (IBM Corp). P values <.05 were considered statistically significant.
Results
The inter- and intraobserver ICCs of the radiologic measurements ranged from 0.911 to 0.987, indicating excellent reliability (Appendix Table A1). All radiologic parameters except LDFA changed significantly after OWHTO. The MPTA changed from 85.1° ± 2.5° to 93.4° ± 2.8° (P < .001), resulting in an HKA axis correction from 7.6° ± 2.7° to –1.3° ± 2.7° (P < .001). Knee JLO increased from 0.7° ± 2.4° to 4.5° ± 2.4° (P < .001) (Table 2). The limb adduction angle was 4.2° ± 1.3°. The changes in knee JLO were significantly correlated with the limb adduction angle (P < .001) (Table 3).
Radiologic Parameters in Open-Wedge High Tibial Osteotomy a

a Data are reported as mean ± SD. Bolded P values indicate statistically significant difference between pre- and postoperative (P < .05). HKA, hip-knee-ankle; JLCA, joint-line convergence angle; JLO, joint-line obliquity; LDFA, lateral distal femoral angle; MPTA, medial proximal tibial angle; WBL, weightbearing line.
Correlation Between Changes in Knee Joint-Line Obliquity and Other Radiologic Parameters a
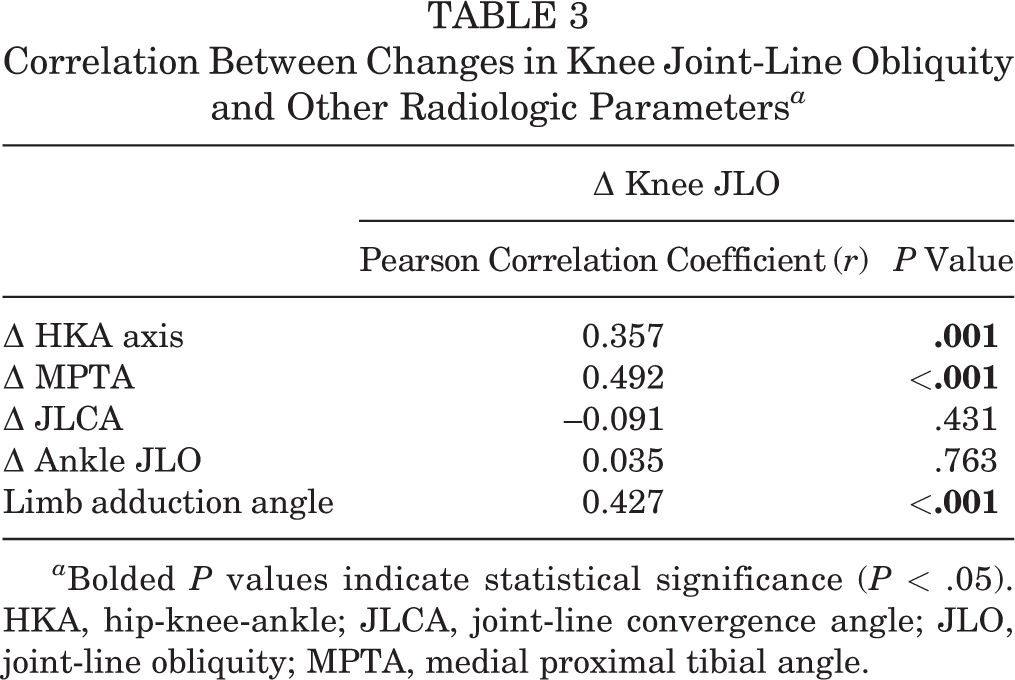
a Bolded P values indicate statistical significance (P < .05). HKA, hip-knee-ankle; JLCA, joint-line convergence angle; JLO, joint-line obliquity; MPTA, medial proximal tibial angle.
On the multivariable linear regression analysis using the stepwise method, preoperative knee JLO and the limb adduction angle were the only significant preoperative factors associated with postoperative knee JLO (P < .001; R 2 = 0.83) (Table 4).
Multivariable Linear Regression Analysis of Preoperative Radiologic Factors Associated With Postoperative Knee Joint-Line Obliquity a

a Bolded P values indicate statistical significance (P < .05). The coefficient of determination (R 2) was 0.83. HKA, hip-knee-ankle; JLCA, joint-line convergence angle; JLO, joint-line obliquity; LDFA, lateral distal femoral angle; MPTA, medial proximal tibial angle.
Based on the sum of the preoperative knee JLO and limb adduction angle, the predicted knee JLO was 4.9° ± 3.0°. The agreement between predicted and postoperative knee JLO was high, with an ICC of 0.928 (P < .001) (Table 5). In cases where changes in the JLCA after OWHTO were ≤1°, the estimated values did not differ from the actual postoperative knee JLO. However, in cases where the change in JLCA was >1°, the postoperative knee JLO was smaller than the predicted value (Table 6 and Figures 2 and 3).
ICC for Agreement Between Predicted and Postoperative Knee JLO a

a ICC, intraclass correlation coefficient; JLO, joint-line obliquity.
Comparison Between Predicted and Postoperative Knee Joint-Line Obliquity According to Changes in Joint-Line Convergence Angle a

a Data are reported as mean ± SD. Bolded P value indicates statistical significance (P < .05). JLCA, joint-line convergence angle; JLO, joint-line obliquity.
b Predicted knee JLO was calculated as the sum of preoperative knee JLO and the limb adduction angle.
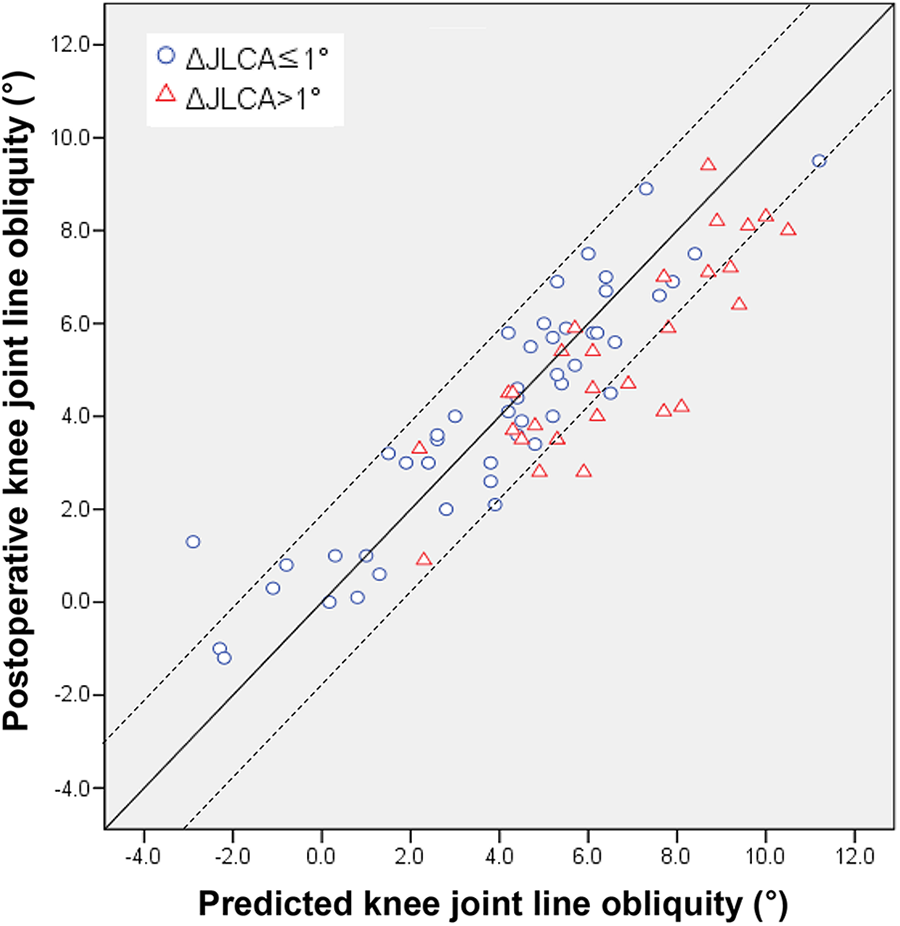
Agreement between predicted and postoperative knee joint-line obliquity. The dashed lines indicate an error of ±2°. JLCA, joint-line convergence angle.
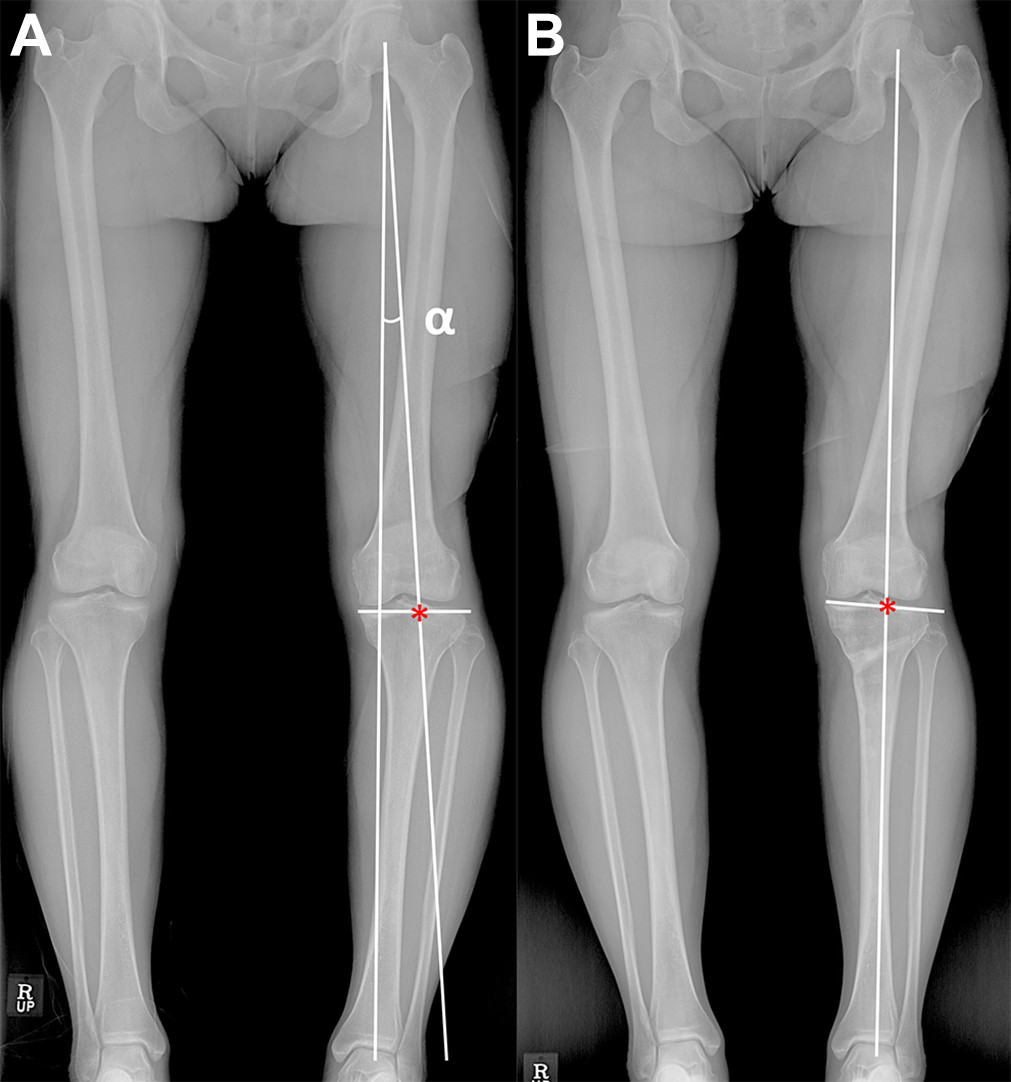
Pre- and postoperative standing whole-leg plain radiographs of a 55-year-old woman who underwent open-wedge high tibial osteotomy of the left knee. The alignment was corrected as the weightbearing line (WBL) ratio of 60% marked with an asterisk. (A) Based on the postoperative WBL ratio, the limb adduction angle (α) was measured as 4.2°, and the preoperative knee joint-line obliquity (JLO) was 0°. Thus, postoperative knee JLO was predicted as 4.2°. (B) The postoperative knee JLO was measured as 4.0°, and the predicted value showed strong agreement with the actual value.
Discussion
The primary finding of the present study was that the limb adduction angle was correlated with the changes in knee JLO after OWHTO. Postoperative knee JLO could be predicted using the sum of the preoperative knee JLO and limb adduction angle. In particular, the accuracy of the predicted value was high in patients with minor changes in JLCA. On the contrary, in a few cases involving patients with large changes in JLCA, errors between predicted and postoperative knee JLO were identified. However, postoperative knee JLO was smaller than the predicted knee JLO.
Previous studies have reported changes in knee JLO as well as the factors associated with postoperative knee JLO after OWHTO. Lee et al 9 reported that knee JLO increased from 0.3° to 4.4° and MPTA increased from 84.4° to 93.4°. Oh et al 17 reported a mean increase of 2.1° in knee JLO and of 7.4° in MPTA after OWHTO. In the present study, knee JLO and MPTA increased from 0.7° to 4.5° and from 85.1° to 93.4°, respectively, which is similar to the increase observed in previous studies.
In a study using a 3-dimensional finite element model, Nakayama et al 14 suggested that a postoperative MPTA of 95° closely corresponded to a postoperative knee JLO of 5° to 10°. Akamatsu et al 1 analyzed radiologic and clinical outcomes between 2 groups after OWHTO according to a postoperative MPTA of 95° and reported that a postoperative MPTA of 95° was calculated as a postoperative knee JLO of 3.9° using regression analysis. However, the range of the actual postoperative knee JLO corresponding to the postoperative MPTA of 95° was quite broad, approximately 10°. In a similar study by Goshima et al, 6 a postoperative knee JLO of 4° showed a postoperative MPTA of 98.4° on regression analysis. In a study comparing the preoperative radiologic parameters between 2 groups in accordance with a postoperative knee JLO of 4°, the preoperative HKA axis and JLCA were identified to be significant factors for abnormal knee JLO after OWHTO. 17 However, that study could not show a quantitative postoperative knee JLO prediction. Park et al 20 devised an equation to estimate postoperative JLO using preoperative radiologic parameters. The preoperative knee JLO, preoperative MPTA, and correction angle were significant variables for predicting postoperative knee JLO. The results of the present study were similar to those of previous studies, and the changes in knee JLO were significantly associated with changes in the HKA axis and MPTA.
Changes in lower extremity alignment resulted in secondary compensatory changes in the hip and ankle joints, which are adjacent to the knee, and previous studies 5,9,17 have analyzed the changes in ankle joint-line orientation after OWHTO. The results of previous studies suggested that ankle joint-line orientation was altered after OWHTO; however, the relationship between the changes in ankle and knee JLO was unclear. The result of the current study is consistent with those of previous studies, suggesting that changes in knee JLO were not correlated with changes in ankle JLO. The reason for this is that unlike the hip joint, which is a ball and socket joint, the ankle is subject to compensatory movement not only in the tibiotalar joint but also in the subtalar joint. 15,18
Previous studies have not focused on compensatory changes in the hip joint after OWHTO. After proximal tibial correction via a medial opening, the lower limb is positioned relatively outward to a neutral standing position. Therefore, to maintain a neutral standing position after OWHTO, the hip joint must make a compensatory movement that induces lower limb adduction. This concept is illustrated in Figure 1. In post-OWHTO gait analysis studies, adduction momentum decreased after OWHTO. However, the stance width did not change, which indicated that the foot position was similar to that in the preoperative state. 11,13 If this concept is valid, postoperative knee JLO should be predicted as the sum of preoperative JLO and the limb adduction angle, and the results of the present study support this concept by showing that the predicted JLO value showed excellent agreement with the actual postoperative JLO (Figure 3). Interestingly, differences between the predicted and actual values were identified in cases with substantial changes in JLCA after OWHTO. The effect of overcorrection due to a change in JLCA after OWHTO can explain this difference. 8,16,19,22 Whereas several studies 8,19 have proposed a method to predict overcorrection due to soft tissue effects after OWHTO, there are some limitations to accurately predicting this soft tissue effect preoperatively. Although postoperative knee JLO may increase due to an increase in limb adduction by overcorrecting the overall alignment, the local effect of the decrease in JLO caused by the decrease in JLCA compensates for the increase in JLO due to overcorrection. Therefore, the actual postoperative value may not present with a substantial error compared with the predicted value (Figure 4).

Illustration of the effect of changes in the joint-line convergence angle (JLCA) on the changes in knee joint-line obliquity (JLO). (A) Line a indicates the preoperative weightbearing line (WBL), and line b indicates the planned WBL. β, the angle between line a and line b, indicates the limb adduction angle. If a decrease in JLCA by γ occurs, the WBL is shifted to b′, resulting in overcorrection of overall alignment, and the amount of changes in knee JLO increases by β′. (B) However, the decrease in JLCA results in a decrease in knee JLO locally. Thus, overall change in knee JLO (δ) due to overcorrection is smaller than β′. Although the changes in JLCA induce an error between actual and predicted knee JLO, this compensation mechanism diminishes the error. The arrows indicate the direction of change.
As shown in Figure 1, the limb adduction angle is primarily determined using the correction angle. A study reported that the amount of change in knee JLO was less than half of the correction angle, and the authors interpreted it as a compensation effect in the ankle joint. 9 However, as shown in Figure 1, the lever arm from the hip joint to the ground is longer than the lever arm from the hinge point to the ground. Therefore, the limb adduction angle, which corresponds to the amount of change in knee JLO, must be smaller than the correction angle. Moreover, the correction angle is determined using preoperative MPTA and alignment, and it might be an index parameter reflecting all these factors, which have been mentioned in previous studies. 1,14,20 The correction angle can be calculated easily by measuring the angle between the native and planned WBLs during preoperative planning.
Excessive knee JLO may produce shear stress on the joint line, resulting in inferior clinical outcomes after OWHTO. Although the acceptable knee JLO after OWHTO is still under debate, several studies 1,14,23 have presented an acceptable range as 4° to 5°. Therefore, this method can help clinicians decide whether to perform a double osteotomy or slight undercorrection when knee JLO is predicted to exceed 4° to 5° after OWHTO.
This study has several limitations. First, this was a retrospective study, and potential selection bias could exist. Second, the radiologic parameters were analyzed in only a 2-dimensional plane, which imposes a limitation in terms of 3-dimensional structures. However, most preoperative planning and OWHTO evaluations are performed using a plain anteroposterior radiograph, except for OWHTO using a navigational tool; thus, the results of the present study could be applied clinically. Third, radiologic protocols such as foot position could influence the knee joint-line orientation, and errors in measurement could exist. 10 Moreover, because this study was a retrospective study and each radiograph was taken no more than 2 times with intervals, the reproducibility of the radiologic protocols could not be determined. However, to maintain accuracy and reliability, all images were acquired from the same hospital, and these images were taken by skilled technicians according to a standardized protocol with the patella facing forward and a neutral foot position.
Conclusion
Changes in knee JLO after OWHTO were associated with adduction of the lower limb after OWHTO. In preoperative planning, postoperative knee JLO could be predicted as the sum of preoperative knee JLO and limb adduction angle between the preoperative WBL and planned WBL.
Footnotes
Final revision submitted November 8, 2020; accepted December 14, 2020.
The authors have declared that there are no conflicts of interest in the authorship and publication of this contribution. AOSSM checks author disclosures against the Open Payments Database (OPD). AOSSM has not conducted an independent investigation on the OPD and disclaims any liability or responsibility relating thereto.
Ethical approval for this study was obtained from the institutional review board at Asan Medical Center (ref: AMC IRB 2020-0033).
Appendix
ICCs for Inter- and Intraobserver Agreement of the Radiologic Measurements a

| Interobserver ICC | Intraobserver ICC | |
|---|---|---|
| Preoperative | ||
| HKA axis | 0.972 | 0.984 |
| WBL ratio | 0.954 | 0.984 |
| LDFA | 0.963 | 0.972 |
| MPTA | 0.911 | 0.940 |
| JLCA | 0.976 | 0.968 |
| Knee JLO | 0.973 | 0.975 |
| Ankle JLO | 0.937 | 0.946 |
| Postoperative | ||
| HKA axis | 0.961 | 0.964 |
| WBL ratio | 0.964 | 0.987 |
| LDFA | 0.957 | 0.965 |
| MPTA | 0.974 | 0.981 |
| JLCA | 0.947 | 0.942 |
| Knee JLO | 0.935 | 0.967 |
| Ankle JLO | 0.954 | 0.962 |
| Limb adduction angle | 0.964 | 0.978 |
a ICC values: poor, <0.50; moderate, 0.5-0.75; good, 0.75-0.9; and excellent, ≥0.9. HKA, hip-knee-ankle; ICC, intraclass correlation coefficient; JLCA, joint-line convergence angle; JLO, joint-line obliquity; LDFA, lateral distal femoral angle; MPTA, medial proximal tibial angle; WBL, weightbearing line.