



Abstract
Background:
Bone-patellar tendon-bone (BTB) and hamstring tendon (HS) are commonly used grafts for anterior cruciate ligament reconstruction (ACLR). The optimal graft choice for ACLR remains unclear. We evaluated clinical and self-reported outcomes of patients who underwent ACLR with use of a BTB autograft or double-bundle HS autograft/allograft-augmented HS autograft (HS hybrid).
Hypothesis/Purpose:
No significant differences in outcomes exist between graft choices.
Methods:
Retrospective review of prospectively collected data from patients aged
Results:
A total of 109 subjects were included; 59 had a HS graft (55 HS autograft, 4 HS hybrid) and 50 a BTB autograft. Patients were between 13 and 21 years old at ACLR and had a follow-up of 1.5 ±1 year. Baseline comparison of demographic, injury and surgical parameters is presented in Table1.1.
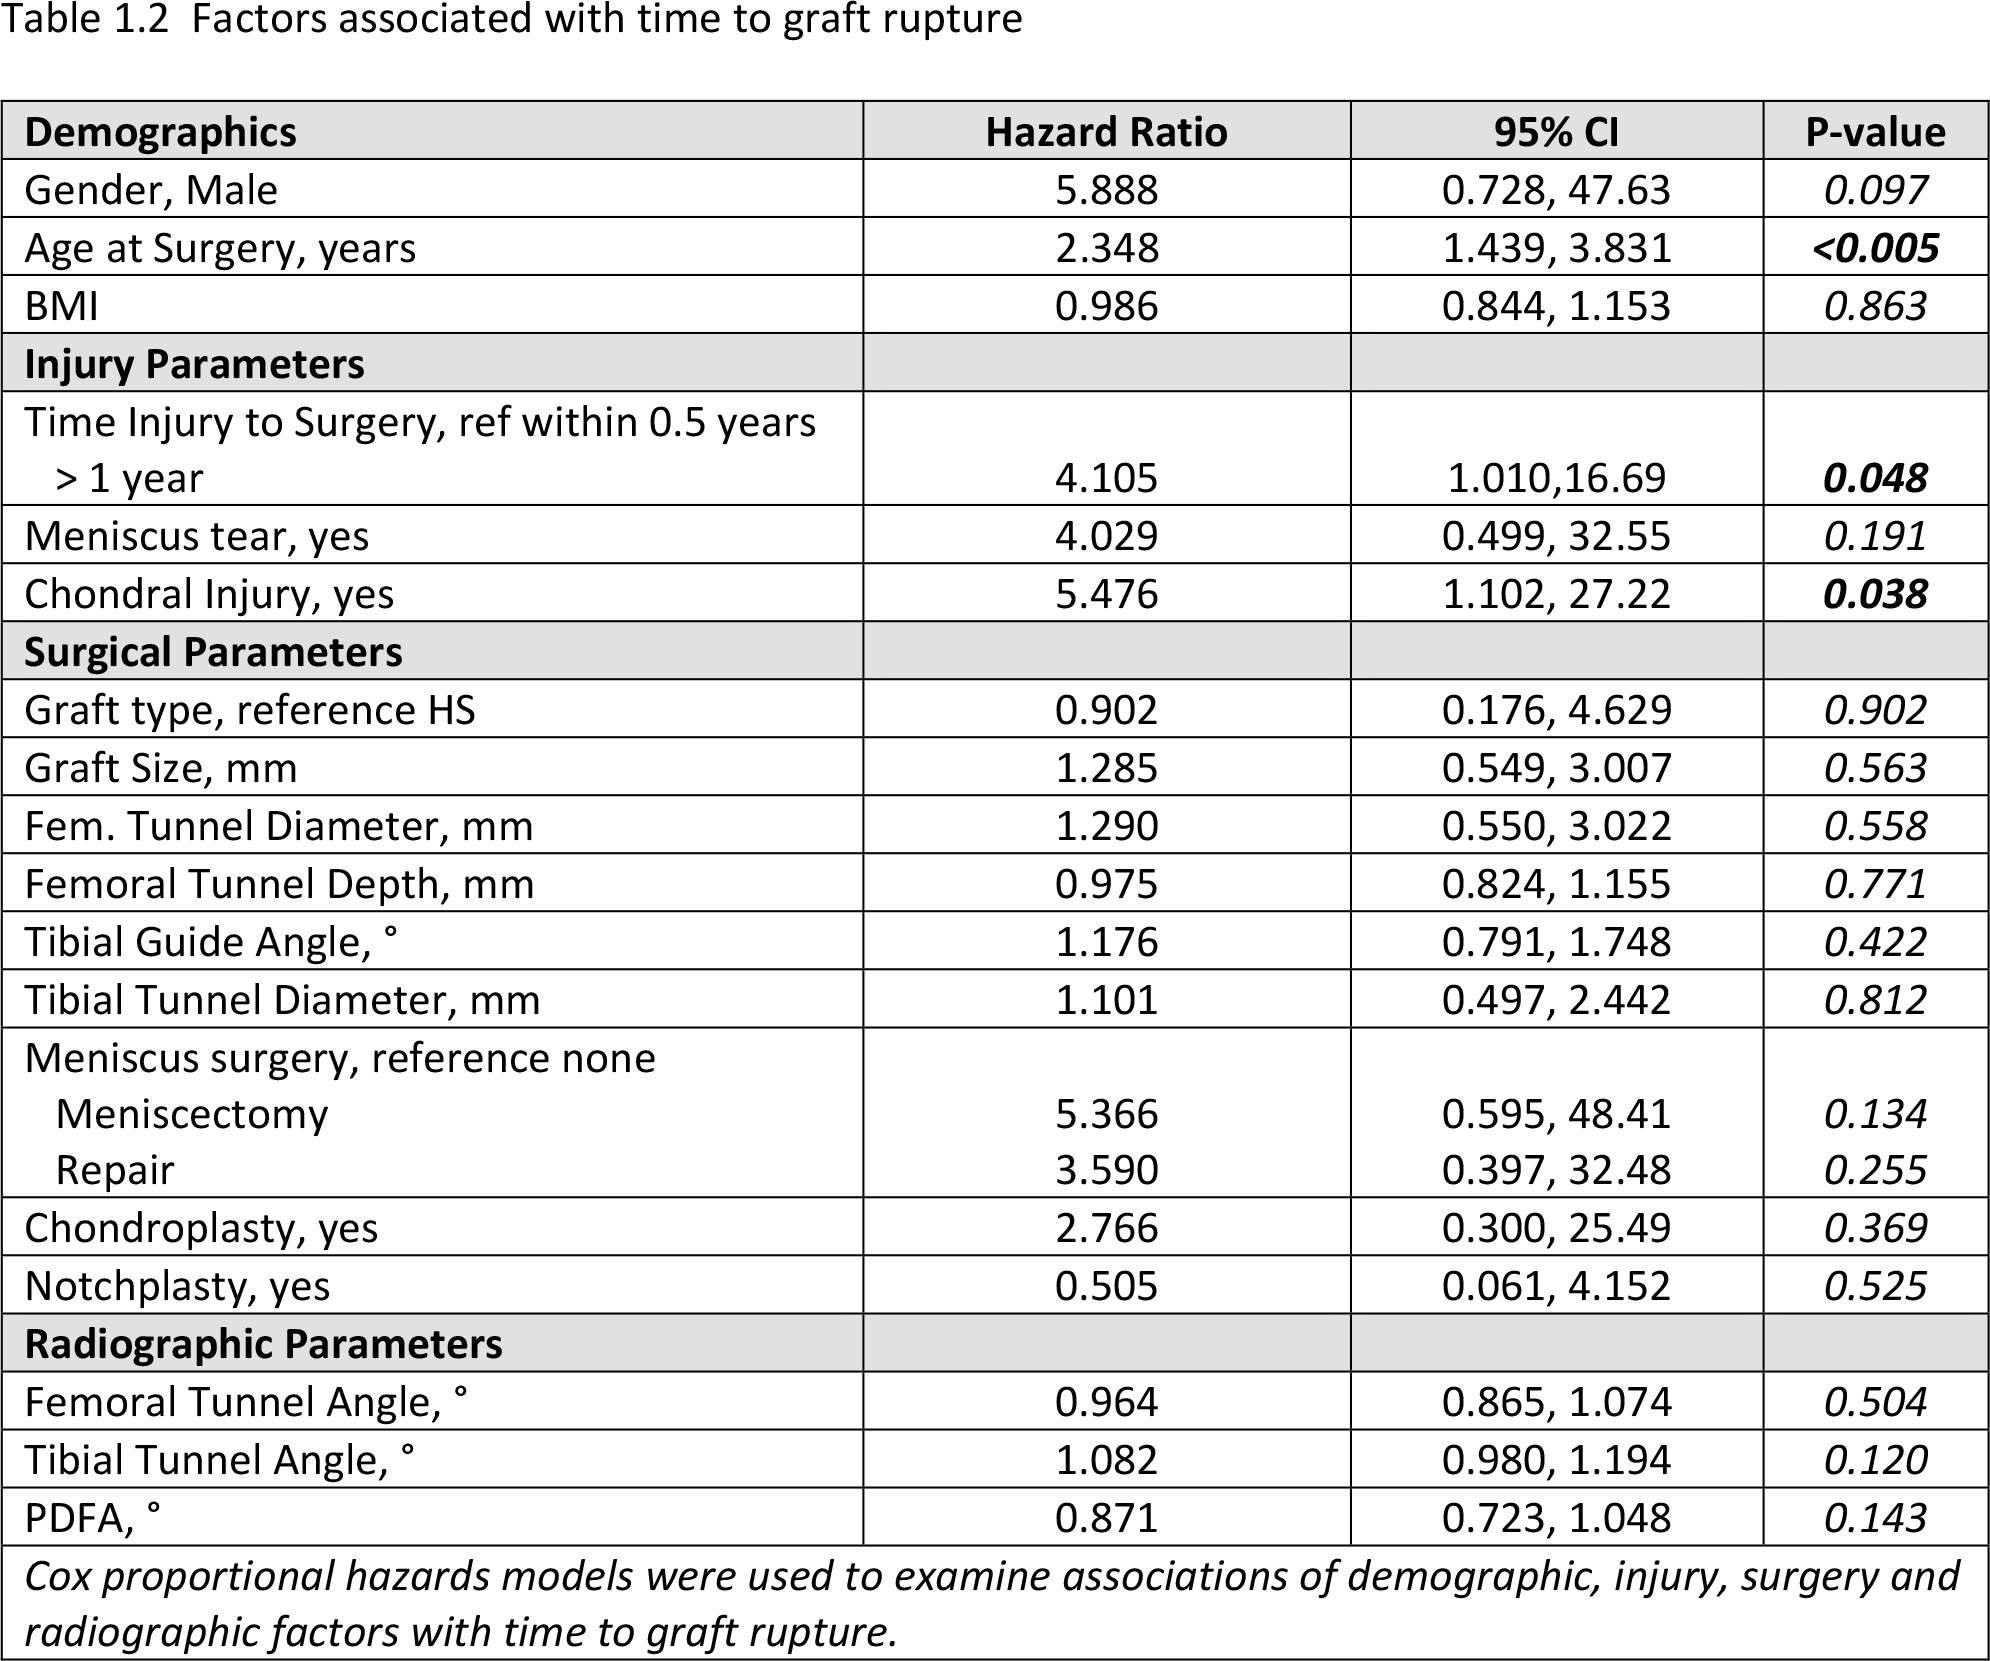
Graft rupture occurred in 10 patients (9.2%; 9 males and 1 female) at an average of 2 years after initial ACLR; 8 graft ruptures occurred in the HS group (13.6%, none in HS hybrids) and 2 in the BTB group (4%) (p=0.105). Parameters increasing the likelihood of a re-tear were older age at ACLR (HR: 2.348, p<0.005), a >1-year delay to surgery (HR: 4.105, p=0.048) and a concomitant chondral injury (HR: 5.476, p=0.038) (Cox proportional hazards model, Table1.2).
Arthrofibrosis developed in 4 BTB patients (8%) at an average of 6 months after initial ACLR, but not in HS patients (p=0.041). At most recent follow-up, patellofemoral pain was present in 15 (28%) HS and 5 (10%) BTB patients (p=0.027) and a contralateral ACL tear had occurred in 4 patients (3.7%). No differences were seen between graft groups for knee range of motion, Lachman testing, leg raise, ligament stability and subjective scores - Tegner-Lysholm, pediIKDC, KOOSChild (p>0.05 for each comparison at 6-months, 1-year and most recent follow-up).
Conclusion:
In patients <21 years undergoing ACLR, BTB autograft lead to fewer graft ruptures, however, was associated with a higher rate of arthrofibrosis. Older age at surgery, a delay to surgery and chondral injuries increased the likelihood of re-tear. However, failure rates were low, and we observed no differences between graft types in terms of laxity and patient self-reported outcomes.
Tables/Figures:

| Demographics | HS, N=59 | BTB, N=50 | P-Value |
|---|---|---|---|
| Gender, Female | 23 (39%) | 22 (44%) | 0.697 |
| Age at Surgery, years | 16.7 ± 1.61 | 16.5 ± 1.33, | 0.382 |
| BMI | 25.2 ± 4.0 | 26.9 ± 5.3 | 0.146 |
| Follow-up time, years | 1.84 ± 1.19, range 0.5-4.8 | 1.11 ± 0.70, range 0.5-4.21 |
|
|
|
|||
| Time Injury to Surgery, years | 0.41 ± 0.34, range 0.07-1.65 | 0.52 ± 0.52, range 0.09-2.52 | 0.477 |
| Laterality, Right | 33 (56%) | 25 (50%) | 0.568 |
| Meniscus tear, yes | 35 (59%) | 40 (80%) |
|
| Chondral Injury, yes | 22 (37%) | 16 (32%) | 0.687 |
|
|
|||
| Graft Size, mm | 8.6 ± 0.62, range 8-10 | 10 ± 0.1, range 9.5-10 |
|
| Fem. Tunnel Diameter, mm | 8.6 ± 0.6 | 10 ± 0 |
|
| Femoral Tunnel Depth, mm | 29.9 ± 4.2 | 27.8 ± 1.2 |
|
| Tibial Guide Angle, ° | 55.2 ± 1.0, range 55-60 | 58.1 ± 2.7, range 50-65 |
|
| Tibial Tunnel Diameter, mm | 8.6 ± 0.6 | 10 ± 0.1 |
|
| Meniscus surgery | 0.050 | ||
| None | 25 (42.4%) | 10 (20%) | |
| Meniscectomy | 12 (20.3%) | 15 (30%) | |
| Repair | 22 (37.3%) | 25 (50%) | |
| Chondroplasty, yes | 6 (10%) | 9 (18%) | 0.274 |
| Notchplasty, yes | 7 (12%) | 7 (14%) | 0.782 |
|
|
|||
| Femoral Tunnel Angle, ° | 34.6 ± 6.3 | 31.7 ± 8.3 | 0.064 |
| Tibial Tunnel Angle, ° | 64.8 ± 7.3 | 68.4 ± 7.3 |
|
| PDFA, ° | 87.3 ± 3.7 | 86.9 ± 4.2 | 0.582 |
| Data are presented as Mean ± SD or N (%) Differences in demographic, injury, surgery and radiographic parameters between the two graft groups were compared using t-tests or Wilcoxon rank-sum tests for con.tinuous variables and chi-square or Fisher’s exact tests for categorical variables | |||
Factors associated with time to graft rupture
| Demographics | Hazard Ratio | 95% CI | P-value |
|---|---|---|---|
| Gender, Male | 5.888 | 0.728, 47.63 | 0.097 |
| Age at Surgery, years | 2.348 | 1.439, 3.831 |
|
| BMI | 0.986 | 0.844, 1.153 | 0.863 |
|
|
|||
| Time Injury to Surgery, ref within 0.5 years > 1 year | 4.105 | 1.010,16.69 |
|
| Meniscus tear, yes | 4.029 | 0.499, 32.55 | 0.191 |
| Chondral Injury, yes | 5.476 | 1.102, 27.22 |
|
|
|
|||
| Graft type, reference HS | 0.902 | 0.176, 4.629 | 0.902 |
| Graft Size, mm | 1.285 | 0.549, 3.007 | 0.563 |
| Fem. Tunnel Diameter, mm | 1.290 | 0.550, 3.022 | 0.558 |
| Femoral Tunnel Depth, mm | 0.975 | 0.824, 1.155 | 0.771 |
| Tibial Guide Angle, ° | 1.176 | 0.791, 1.748 | 0.422 |
| Tibial Tunnel Diameter, mm | 1.101 | 0.497, 2.442 | 0.812 |
| Meniscus surgery, reference none | |||
| Meniscectomy | 5.366 | 0.595, 48.41 | 0.134 |
| Repair | 3.590 | 0.397, 32.48 | 0.255 |
| Chondroplasty, yes | 2.766 | 0.300, 25.49 | 0.369 |
| Notchplasty, yes | 0.505 | 0.061, 4.152 | 0.525 |
|
|
|||
| Femoral Tunnel Angle, ° | 0.964 | 0.865, 1.074 | 0.504 |
| Tibial Tunnel Angle, ° | 1.082 | 0.980, 1.194 | 0.120 |
| PDFA, ° | 0.871 | 0.723, 1.048 | 0.143 |
| Cox proportional hazards models were used to examine associations of demographic, injury, surgery and radiographic factors with time to graft rupture. | |||