
Abstract
Background:
The Marx Activity Rating Scale (MARS) and the Hospital for Special Surgery Pediatric Functional Activity Brief Scale (HSS Pedi-FABS) are both validated activity scales. While the MARS examines greatest physical activity level within the last year, the HSS Pedi-FABS assesses the greatest level of physical activity within the last month.
Purpose:
To determine whether the different time frames used in MARS and HSS Pedi-FABS affect scores on common items in both scales, and if so, to determine whether age or injury status affect this difference.
Methods:
The MARS and 4 analogous items on the HSS Pedi-FABS were administered sequentially in random order to patients being evaluated at two sports surgeons’ clinic for knee injuries in addition to their healthy companions in order to enroll an uninjured comparison group. Responses to each question were scored from 0-4 for a maximum overall score of 16. Participant demographics were also recorded. Paired and independent sample t-tests were used to determine mean differences between the two scales and between healthy and injured adults and children, respectively.
Results:
The final cohort included 88 participants of which 47% were children (ages 10-17) and 51% had a knee injury. All participants except for healthy adults scored significantly lower on the HSS Pedi-FABS than the MARS (p < 0.05,
Conclusion:
Physical activity level is significantly different when evaluated by either MARS or its analogue portion of HSS Pedi-FABS. Because the only difference between the scales is the timeframe, the lower scores on the Pedi-FABS than the MARS are likely due to seasonal changes in activity which are not captured in the MARS. Because the Pedi-FABS analyzes a shorter window, it is more likely to capture acute changes in physical activity due to a recent injury than the MARS scale while the MARS scale is better suited for examining general physical activity unaffected by seasonality. Understating the differences between these scales can guide clinicians in using them appropriately when evaluating patient activity level.
Tables:
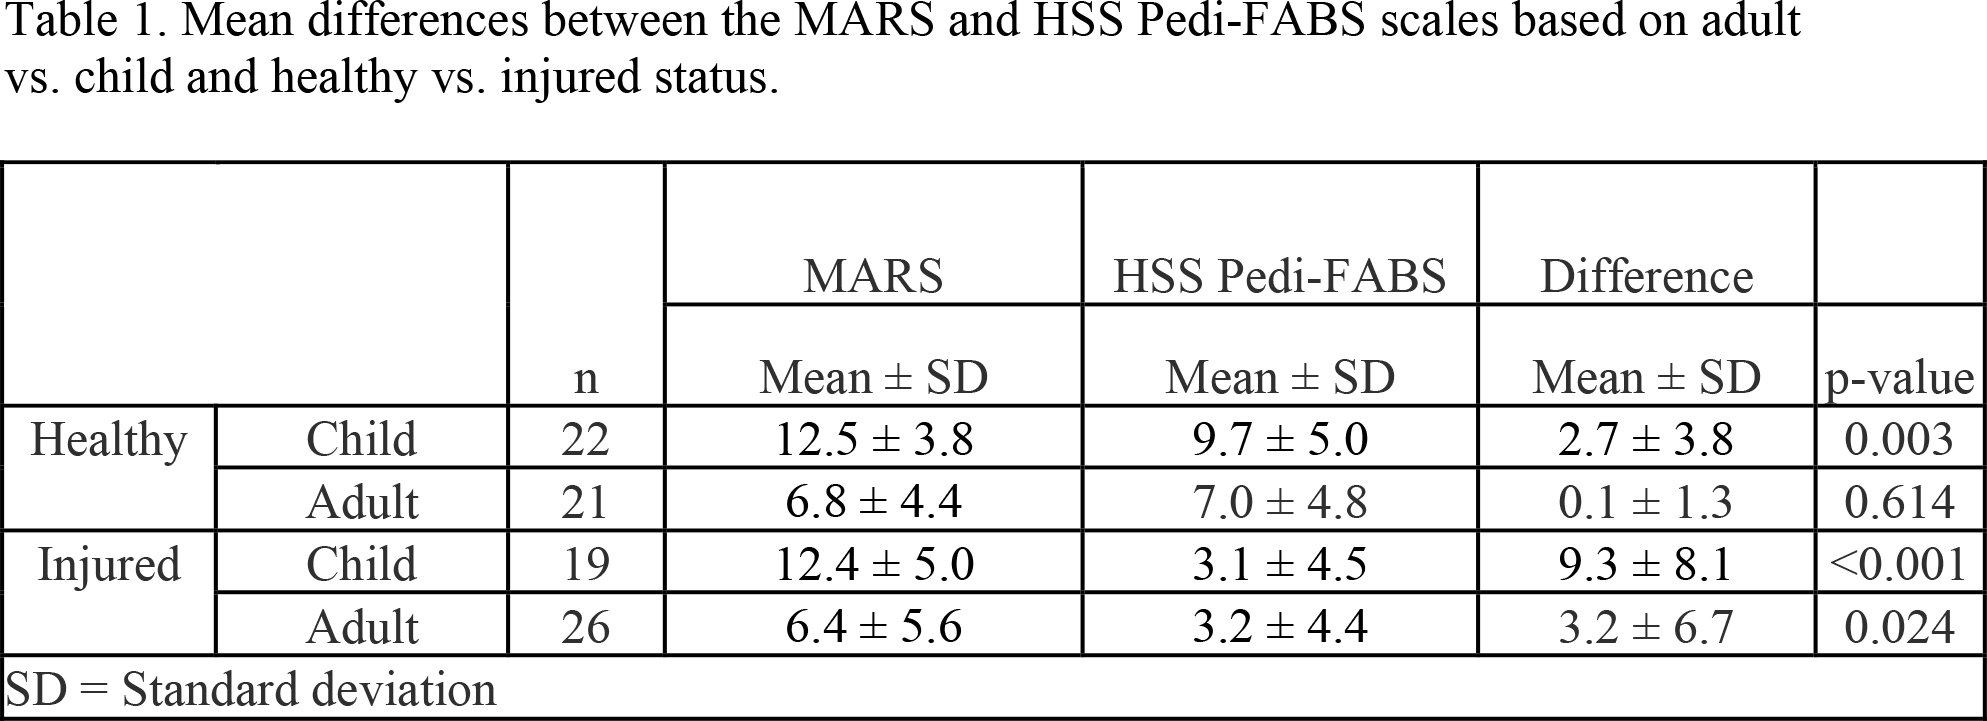
Mean differences between the MARS and HSS Pedi-FABS scales based on adult vs. child and healthy vs. injured status.
| n | MARS | HSS Pedi-FABS | Difference | |||
|---|---|---|---|---|---|---|
| Mean ± SD | Mean ± SD | Mean ± SD | p-value | |||
| Healthy | Child | 22 | 12.5 ± 3.8 | 9.7 ± 5.0 | 2.7 ± 3.8 | 0.003 |
| Adult | 21 | 6.8 ± 4.4 | 7.0 ± 4.8 | 0.1 ± 1.3 | 0.614 | |
| Injured | Child | 19 | 12.4 ± 5.0 | 3.1 ± 4.5 | 9.3 ± 8.1 | <0.001 |
| Adult | 26 | 6.4 ± 5.6 | 3.2 ± 4.4 | 3.2 ± 6.7 | 0.024 | |
| SD = Standard deviation | ||||||
Figures:
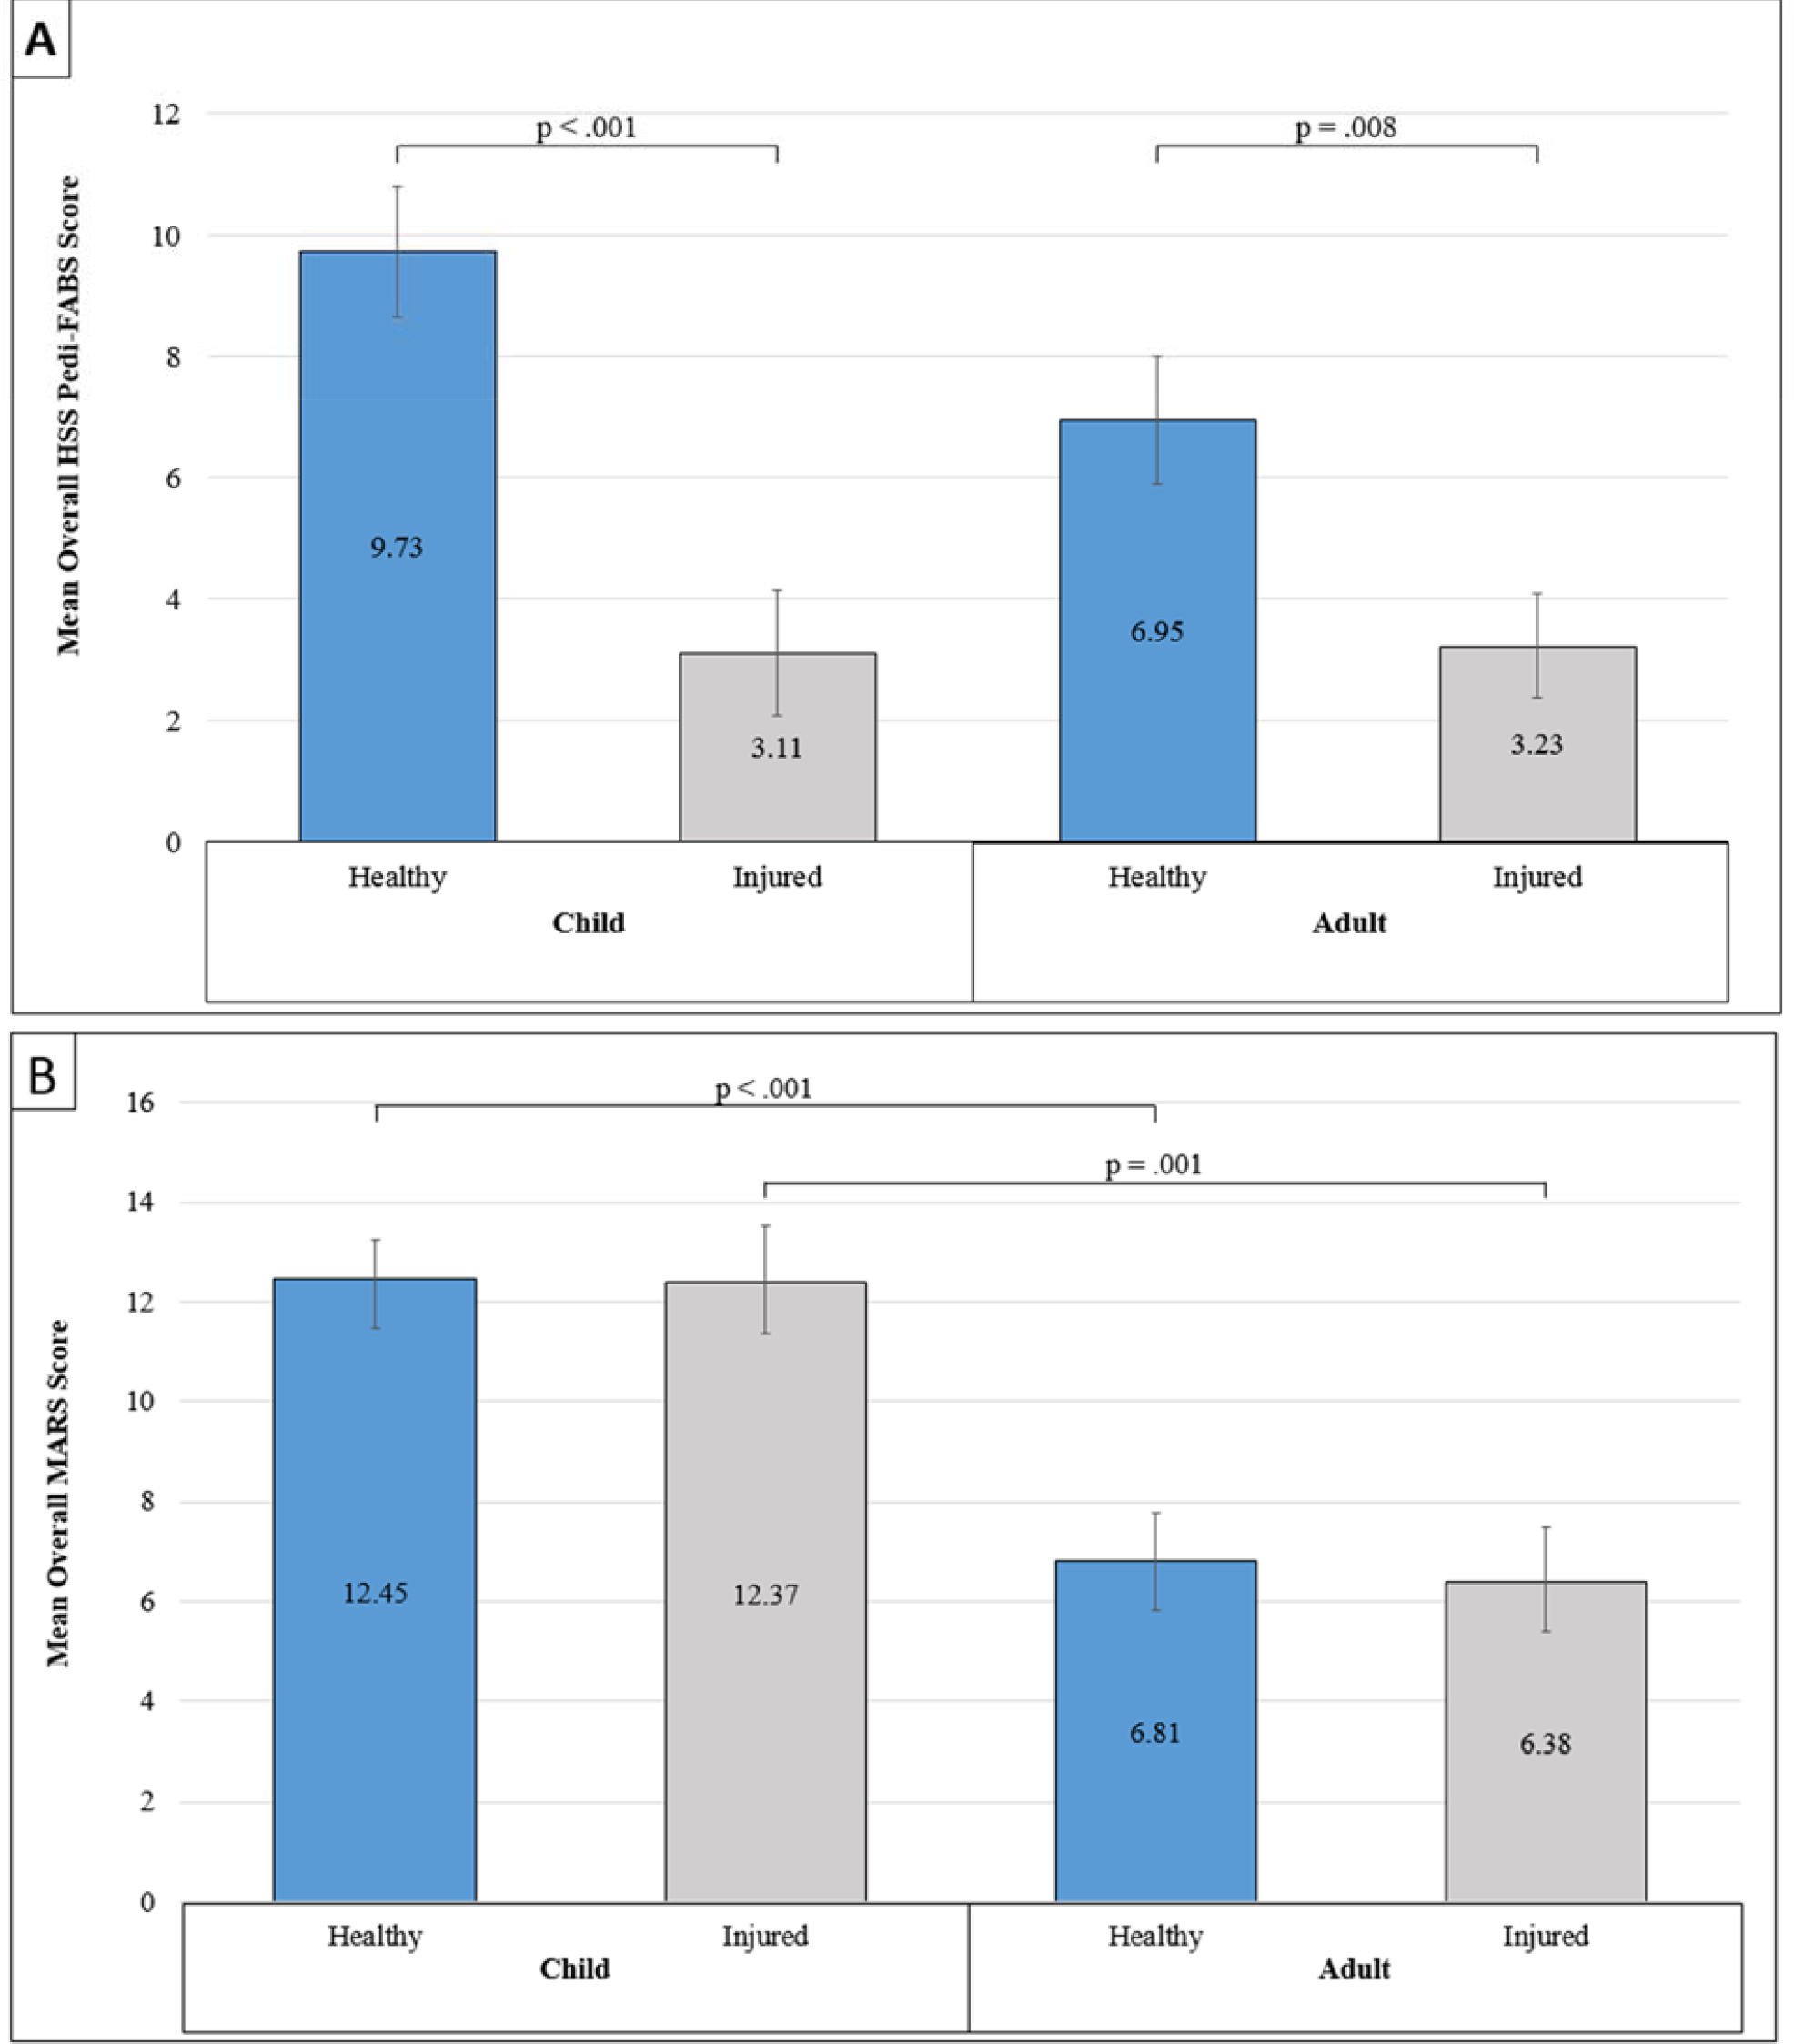
Significant differences between injured and healthy adults and children on the A) HSS Pedi-FABS scale and B) MARS scale.