
Abstract
Background:
Non-tackle football (ie, flag, touch, 7v7) is purported to be a lower-risk alternative to tackle football, particularly in terms of head injuries. However, data on head injuries in non-tackle football are sparse, particularly among youth participants.
Purpose:
To describe the epidemiology of emergency department visits for head injuries due to non-tackle football among youth players in the United States and compare the data with basketball, soccer, and tackle football.
Study Design:
Descriptive epidemiology study.
Methods:
Injury data from 2014 to 2018 were obtained from the National Electronic Injury Surveillance System database. Injury reports coded for patients aged 6 to 18 years and associated with basketball, football, or soccer were extracted. Data were filtered to include only injuries to the head region, specifically, the head, ear, eyeball, mouth, or face. Football injuries were manually assigned to “non-tackle” or “tackle” based on the injury narratives. Sports & Fitness Industry Association data were used to estimate annual sport participation and calculate annual injury rates per 100,000 participant-years.
Results:
A total of 26,770 incident reports from 2014 to 2018 were analyzed. For head region injuries in non-tackle football, the head was the most commonly injured body part, followed by the face; the most common diagnosis was a laceration, followed by concussion and internal injury (defined as an unspecified head injury or internal head injury [eg, subdural hematoma or cerebral contusion]). The most common contacting object was another player. The projected national rate of head region injuries was lowest for non-tackle football across the 4 sports. In particular, the projected rate of injuries to the head for non-tackle football (78.0 per 100,000 participant-years) was less than one-fourth the rates for basketball (323.5 per 100,000 participant-years) and soccer (318.2 per 100,000 participant-years) and less than one-tenth the rate for tackle football (1478.6 per 100,000 participant-years).
Conclusion:
Among youth in the United States aged 6 to 18 years who were treated in the emergency department for injuries related to playing non-tackle football, the most common diagnosis for injuries to the head region was a laceration, followed by a concussion. Head region injuries associated with non-tackle football occurred at a notably lower rate than basketball, soccer, or tackle football.
Non-tackle football, which includes flag football, touch football, and 7v7 football, is a popular sport among youth athletes, 29 with lower turnover than most sports. 34 The low cost to play, minimal required equipment, and relatively easy accessibility to both organized and unorganized games may be key drivers in the sport’s popularity. The sport also is popular among tackle football players who desire to develop skill and fitness in the offseason. Perceived safety is also an important consideration. In 2018, The Aspen Institute cited safety concerns in its recommendation that athletes delay participating in tackle football until the age of 14 years by playing flag football instead. 35 However, some non-tackle leagues have begun requiring protective equipment for the head and face, 26,33 which appears to conflict with reports of the sport’s relative safety.
Despite its popularity and perception of safety, data on non-tackle football injuries are limited. Kaplan and colleagues 12 estimated 0.14 time-loss injuries per 1000 athlete-exposures (AEs) for an adult recreational flag football league. A time-loss injury was defined as an injury that resulted in a player’s being unable to return to future training or the current game, and 1 AE was defined as 1 athlete participating in 1 game. Likewise, the injury incidence for collegiate intramural flag football was reported as 1.82 medical attention injuries per 100 athletes, in which a medical attention injury was any injury for which medical personnel were consulted, regardless of whether the injury influenced the ability of the athlete to return to play. 20 However, older studies of college intramural non-tackle football reported higher rates (up to 10.9 medical attention injuries per 100 athletes). 14,15,19 In modern adult non-tackle football, head and face injuries have been reported to account for 12% of injuries. 2 Concussions were reported to make up less than 5% of injuries in adult leagues. 2,12
Although multiple studies have examined adult and collegiate non-tackle football, only 1 study to date has examined youth participants. Peterson et al 24 reported that 7- to 13-year-old flag football players experienced a time-loss injury incidence of 5.77 per 1000 AEs. This rate was double the injury incidence for youth tackle football players in the same study. However, injuries in both flag and tackle groups were lower than youth tackle football injury rates reported elsewhere. 6,18,28,31,37 Additionally, Peterson et al found that 23% of reported flag football injuries were concussions, which was equivalent to an incidence rate of 1.33 concussions per 1000 AEs and similar to the concussion rate for the tackle football leagues evaluated. The study was isolated to only 1 flag football league, and further details about head or face injuries were not provided.
The rate and nature of head injuries due to playing non-tackle football, particularly among participants younger than 18 years, are not well known. This information is critical for informed discussions about the safety of the sport. Therefore, the purpose of this study was to utilize publicly available data sets to assess the type, frequency, and mechanism of head region injuries due to non-tackle football for patients aged between 6 and 18 years. A secondary purpose was to compare non-tackle football injury rates with tackle football, soccer, and basketball. We hypothesized that non-tackle football would have lower injury rates than tackle football because of the differences in full-body contact between the sports, and that non-tackle football would have similar injury rates to the lower contact sports of soccer and basketball.
Methods
Injury Data Collection
Injury data were obtained from the National Electronic Injury Surveillance System (NEISS) database, which is managed by the US Consumer Product Safety Commission (CPSC) for the purpose of collecting data about the occurrence of consumer product–related injuries. 39 The database is populated with entries of reported injuries from a representative sample of emergency departments across the US. Data are publicly available and can be used to create estimates for the prevalence of injuries nationally. Incident reports are completed by hospital staff and contain information such as age, sex, race, ethnicity, injury diagnosis, body part, incident locale, and narrative description of the incident. 38
Data Selection
Using a publicly available website (www.cpsc.gov/cgibin/NEISSQuery/home.aspx), data were accessed on June 11, 2019. The query assembled incident reports from the most recent 5 years (2014-2018) that met the following “product subgroup” criteria (codes in parentheses): “basketball (activity/apparel/equipment)” (1205), “football (activity/apparel/equipment)” (1211), or “soccer (activity/apparel/equipment)” (1267); “body part” was coded as “head” (75), “face” (76), “eyeball” (77), “mouth” (88), or “ear” (94). The age category was between 6 and 18 years inclusively, and both male and female patients were included in the query. Soccer and basketball were chosen as comparative sports because they are popular field-based team sports that involve moving a ball with the player’s body (without using a stick or other equipment), involve physical contact between players but are not collision or tackle based, and do not require protective headgear. Because the main focus of the study was to understand injury rates in organized sports, the age group was selected to encompass the typical age ranges of organized youth and high school sports. The minimum age of 6 years was selected because the youngest youth tackle football players tend to be ≥6 years, although organized youth soccer, basketball, or non-tackle football leagues may begin at an earlier age. 8,10,25
Data Reduction
For the purposes of this analysis, incident reports with narratives that indicated that the incident was not related to typical gameplay were removed: unrelated to gameplay (eg, stung by a bee while playing), patient not involved in the game (eg, spectator, handling equipment in the locker room after a game), using wrong equipment (eg, hitting a basketball with a baseball bat), or playing in wrong surroundings (eg, hitting a refrigerator, desk, or car).
Manual Categorization for Object Contacting Patient’s Head
Incidents were manually categorized by the object contacting the patient’s head, as described in the incident narrative, to allow for a more detailed analysis of the circumstances under which patients became injured during sport activities. The object contacting the patient’s head was categorized as follows: ball, another person (head, elbow, knee, kicked, other), playing surface (soft/natural, hard/manmade, “ground”/unknown), vertical object (in-field [eg, goalpost], adjacent [eg, building]), or not stated. Narratives that described more than 1 head contact occurring (eg, “17YOF playing soccer hit on head, fell backwards hit concrete, DX: Head injury”) were categorized as “multiple contacts.”
Manual Categorization for Type of Football
Incidents were, where feasible, categorized as either “tackle football” or “non-tackle football” based on the wording of the incident narrative (eg, a mention of “flag football” would be assigned to “non-tackle football,” whereas a mention of “tackling” would be assigned to “tackle football”). Specifically, a panel of 3 reviewers (J.F., S.H., and Judith J. Isaacson, MS) developed an initial coding manual to distinguish the following mutually exclusive categories: “flag football,” “touch football,” “7v7 football,” “other non-tackle football,” and “tackle football.” These were determined to be the simplest categories to achieve the primary objective of the study. Code words focused on keywords related to the rules of engagement, such as “tackle,” “flag,” and “helmet.” The coding manual was refined iteratively by reviewing a sample of narratives until a static manual, reached by a consensus, was developed. Subsequently, a single reviewer (Luke Grieser; separate from the consensus panel) was trained on the coding manual and was responsible for coding all narratives. Any uncertain narratives were flagged by the primary reviewer for a review and final decision by the consensus panel. 32 Any narratives that remained ambiguous were assigned to “unknown football.” Because of the small number of narratives in the “flag,” “touch,” “7v7,” and “other non-tackle” football categories, these were combined into a single “non-tackle football” category for subsequent analyses. Table 1 provides the keywords used to identify each category, along with exemplary narratives.
Coding Keywords Used for Categorizing Type of Football and Example Narratives

a Non-tackle football disciplines were initially coded separately, but subsequently, they were combined into a single category for quantitative analyses owing to small sample sizes.
b 7v7, 7-on-7 non-tackle football; CHI, closed head injury; D/L, dislocation; DX, diagnosis; FB, football; LAC, laceration; LT, left; LOC, loss of consciousness; M, male; OBS, observation; PT, patient; S/P, status post; YO, year old.
“Unknown football” was subsequently allocated to tackle or non-tackle football for each injury classification of interest (eg, contacted by another player’s head) using the ratio of tackle football and non-tackle football figures for that particular injury classification. For example, if there were 10,000 nationally projected “vertical object, adjacent” injuries categorized as “non-tackle football,” 20,000 as “tackle football,” and 6000 as “unknown football,” 2000 of the nationally projected football injuries from “unknown football” would be added to “non-tackle football.”
Estimating Participation for 2014-2018
Injury prevalence numbers from the NEISS database were normalized with estimated sport participation numbers to enable comparisons across sports. Participation data were gathered from the Sports & Fitness Industry Association (SFIA) 2018 Single Sport Participation Reports for tackle football, flag football, touch football, basketball, outdoor soccer, and indoor soccer. 30 The SFIA is the trade association of leading industry sports and fitness brands, suppliers, retailers, and partners. The SFIA publishes annual reports summarizing participation rates for sports and other physical activities as part of its service to industry partners. This study used the annual reports of the most recent year (2018) for which the SFIA Single Sport Participation Report across all sports of interest was available. The 2018 reports provide participation estimates for calendar year 2017. Each SFIA Single Sport Participation Report estimates the total number of people who participated in the activity at least once in the year of interest. These values are based on the results of a survey sample size of 30,999. Demographic information is used to determine a participation estimate that more accurately reflects the US population.
A number of assumptions were made to prepare a rough estimate for sport participation during the 5-year span of the NEISS data reviewed. First, using each SFIA Single Sport Participation Report, estimates for the total number of 6- to 18-year-old players who participated (at least 1 time in a year) in each sport in 2017 were developed. This was calculated by summing the SFIA “total participants” estimates of the 6-12 and 13-17 age groups with one-seventh of the 18-24 age group. Subsequently, flag and touch football estimates and indoor and outdoor soccer estimates were combined to form a “total participants” estimate for non-tackle football and soccer, respectively. This was calculated as the sum of the 2 sports’ adjusted 6- to 18-year age figure minus those who played both sports. The adjusted 6- to 18-year age figure for flag football was multiplied by the SFIA-provided cross-participation rate for touch football of 24.9%. This was repeated with the adjusted 6- to 18-year age figure for touch football and the SFIA-provided cross-participation rate of 35.5% for flag football. Because the 2 resulting estimates were not equal (presumably because of the SFIA’s weighting technique), the 2 figures were averaged to estimate the population of 6- to 18-year-old participants who played both flag and touch football according to the following equation:

where B, C, and D correspond to the labeled columns in Table 2, and FF and TF represent flag football and touch football, respectively. This process was repeated for indoor and outdoor soccer:
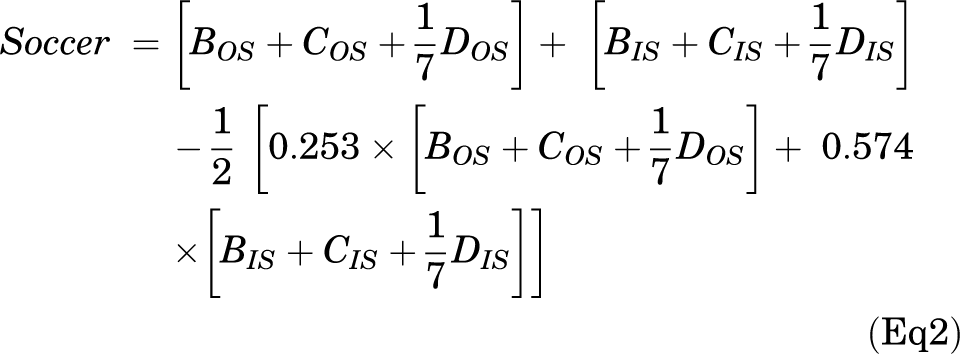
where IS and OS represent indoor soccer and outdoor soccer, respectively. The results for estimated total participation in 2017 by sport are shown in Table 2 (column E).
Estimates of Participation for 2017
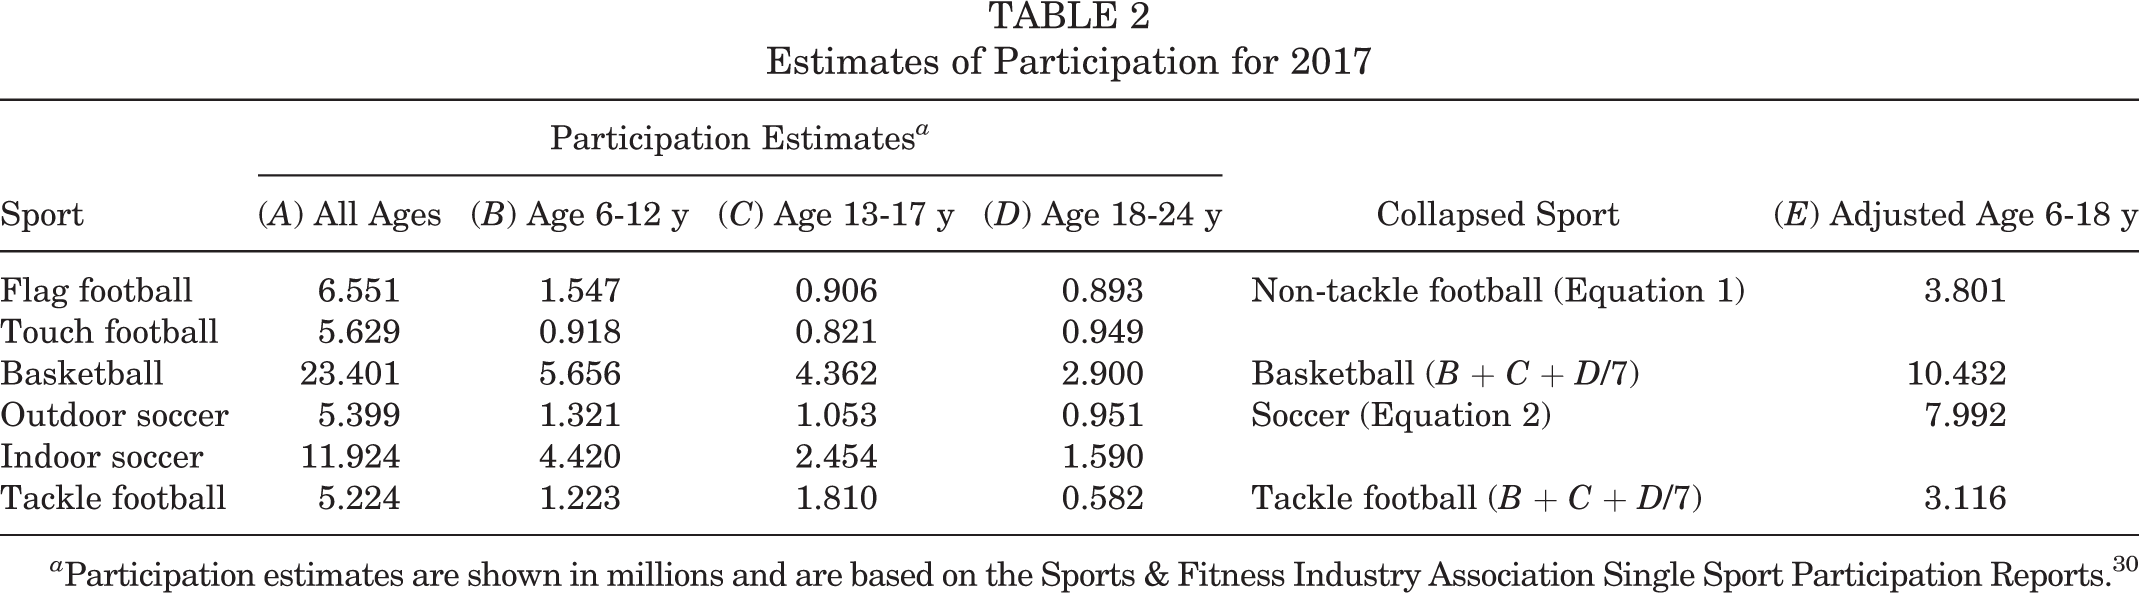
a Participation estimates are shown in millions and are based on the Sports & Fitness Industry Association Single Sport Participation Reports. 30
Finally, a 5-year annual participation estimate was derived using the SFIA-reported trends. Each sport-specific 2018 participation report provided total participation (all age groups) estimates for 2012 through 2017 and the 5-year average annual growth. A projection for participation for 2018 was calculated by applying the 5-year average annual growth to the reported 2017 participation estimate and then used to create a 5-year annual average participation estimate for 2014-2018 for each sport (Table 3 [column L]). Participation estimates specific to our age group of interest, 6 to 18 years, were extracted from the 5-year annual average. For basketball and tackle football, this was calculated by multiplying the 5-year annual average by the 2017 adjusted 6- to 18-year age figure, divided by the 2017 SFIA-provided “total participants” estimate. The same calculation was made for flag football, touch football, outdoor soccer, and indoor soccer. Each calculation was then multiplied by the corresponding combined sport’s 2017 adjusted “total participants” 6- to 18-year age figure, divided by that individual sport’s 2017 adjusted “total participants” 6- to 18-year age figure. Again, resulting figures for flag and touch football as well as indoor and outdoor soccer were averaged to form estimates for non-tackle football and soccer, respectively, using the following equations:


where A, E, and L correspond to the values in the labeled columns of Table 3, FF is flag football, NT is non-tackle football, TF is touch football, OS is outdoor soccer, and IS is indoor soccer. Final 5-year annual participation estimates for 2014-2018 are shown in Table 3 (column M).
Estimates of Average Annual Participation for 2014-2018
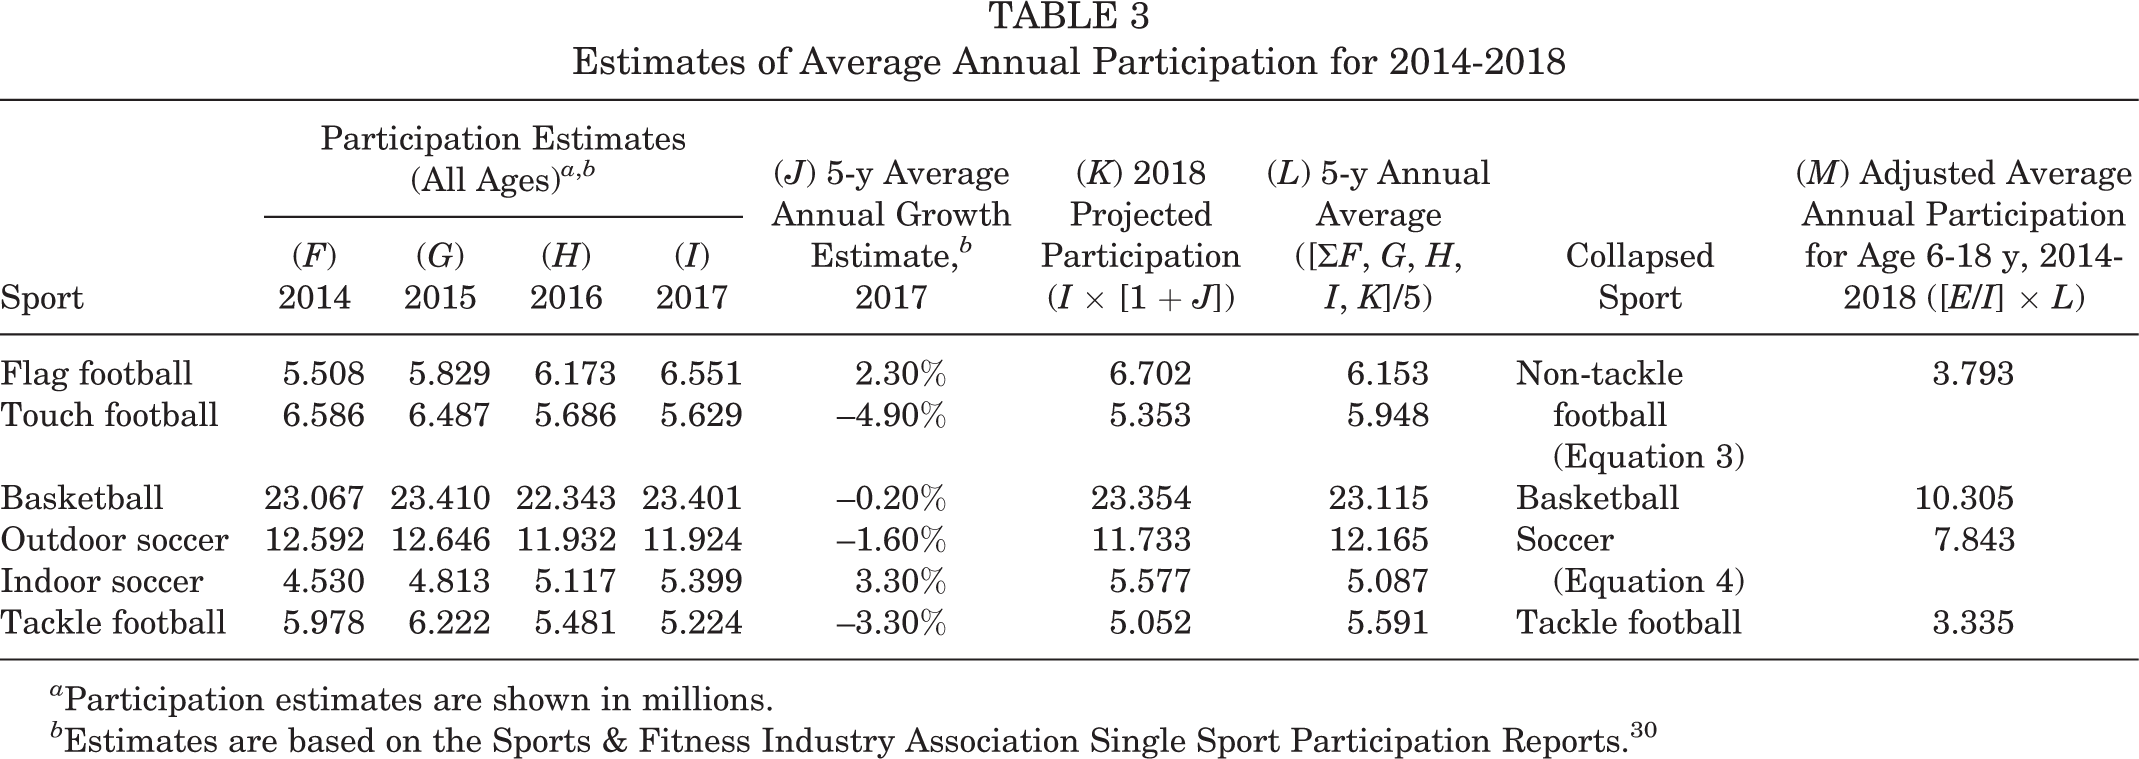
a Participation estimates are shown in millions.
b Estimates are based on the Sports & Fitness Industry Association Single Sport Participation Reports. 30
Analysis
The NEISS assigns each incident report 1 of 5 weight values based on representativeness to the US population of the hospital from which the injury was reported. Weight values are based on the size class of the hospital and are reassessed annually. The sum of the weights represents a national projected total for that injury. The national projected total was used as the estimate of injury prevalence. For the purposes of this analysis, for cases in which the national projected total of incidents based on NEISS weighting was < 1200, results were marked “low” per NEISS recommendations. 39 In addition, a 95% CI was determined using data from a NEISS-provided table approximating the general relative sampling error for the estimated number of injuries fitted to a curve, where approximate sampling error is a function of estimated injuries (see Equation 5; R 2 = 0.9577). 27

Estimated injury rates were calculated by dividing the NEISS-derived national projected total injuries from 2014-2018 by 5 times the average annual participation estimate derived from SFIA reports. Injury rates were reported as injuries per 100,000 participant-years. Demographic characteristics were compared across sports for sex and age using the Pearson chi-square test, with the level of significance set at .05. Age was grouped as pre–high school (6-14 years) and high school (15-18 years).
Results
Cases Identified
The NEISS query yielded a total of 27,910 incident reports across football, basketball, and soccer. Of these, 1140 (4.08%) were removed as “not typical” incidents, leaving 26,770 (95.91%) incident reports. Of the remaining incident reports, 290 (1.08%) cases were identified as non-tackle football, 3769 (14.07%) as tackle football, 6429 (24.02%) as unknown football, 10,312 (38.52%) as basketball, and 5970 (22.30%) as soccer. The non-tackle cases included flag football (n = 248; 85.52%), touch football (n = 38; 13.10%), and 7v7 football (n = 2; 0.69%), with 2 cases (0.69%) in which the non-tackle discipline was unspecified. Injury narratives from the cases attributed to non-tackle football can be found as separate Supplemental Material for this article. Table 4 summarizes the demographic characteristics by sport. There were significant associations between type of sport and sex: χ2 (4) = 21,087.51; P < .001; and between type of sport and age group: χ2 (4) = 1536.78; P < .001. Tackle football and unknown football injuries were almost entirely associated with male players, whereas soccer injuries were equally split between male and female players. Approximately two-thirds of injuries in the football disciplines were associated with patients younger than high school age (6-14 years), while approximately one-half of injuries in basketball and soccer were associated with the 6- to 14-year age group.
Annual Average National Estimates for Head Region Injuries by Demographic Characteristics a

a Data are shown as n (%) unless otherwise indicated.
Injured Body Part
Compared to the other sports, non-tackle football displayed the lowest injury rate for each body part category (Figure 1 and Table 5). The estimated rate of injuries to the head for tackle football (1478.6 per 100,000 participant-years) was 18 times higher than the rate for non-tackle football (78.0 per 100,000 participant-years). Head injury rates for basketball (323.5 per 100,000 participant-years) and soccer (318.2 per 100,000 participant-years) were approximately 4 times higher than for non-tackle football. For non-tackle football, the projected injury estimates indicated the head as the most common body part injured, followed by the face, mouth, eyeball, and ear. Non-tackle football and basketball had the most similar injury distributions.

Projected annual injury rate among participants aged 6 to 18 years by injured body part. Rate is reported per 100,000 participant-years. Bars represent 95% CIs. Participant estimates represent athletes playing the sport at least once in the year. Non-tackle football was associated with the fewest injuries of the selected sports, regardless of the injured body part.
Projected Annual National Total and Estimated Rates of Injury by Body Part a
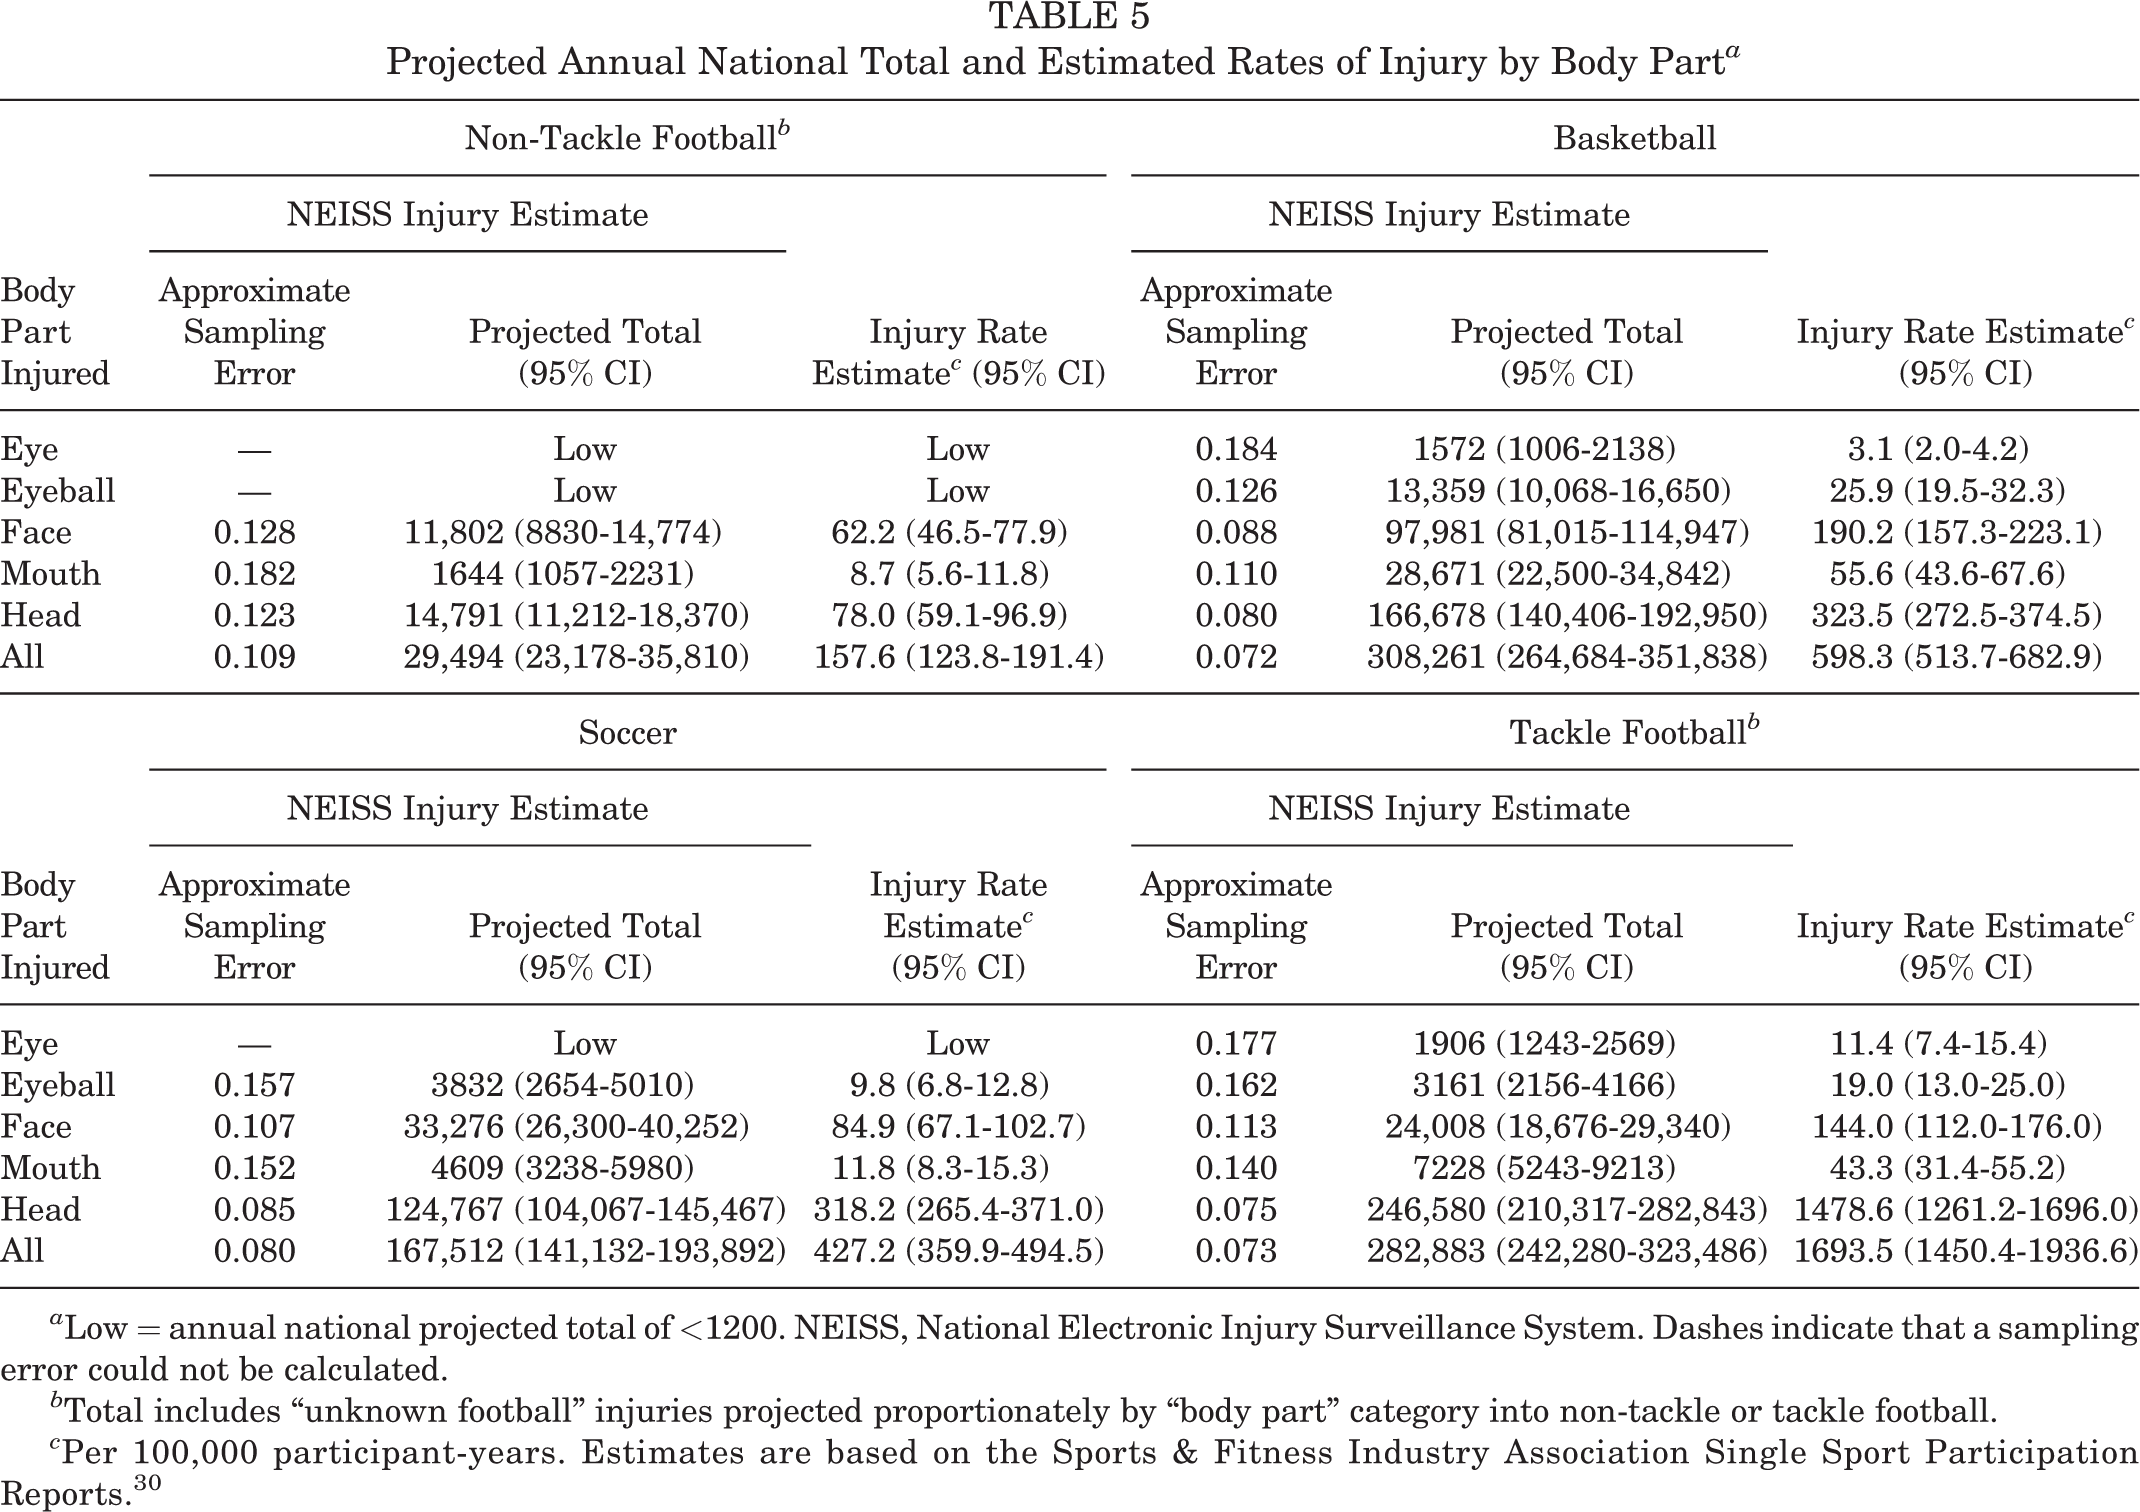
a Low = annual national projected total of <1200. NEISS, National Electronic Injury Surveillance System. Dashes indicate that a sampling error could not be calculated.
b Total includes “unknown football” injuries projected proportionately by “body part” category into non-tackle or tackle football.
c Per 100,000 participant-years. Estimates are based on the Sports & Fitness Industry Association Single Sport Participation Reports. 30
Injury Type
Across all sports, the identified NEISS diagnosis codes (code number in parentheses) included the following: concussion (52); internal organ injury (62); laceration (59); contusion, abrasion (53); fracture (57); dental injury (60); hemorrhage (66); hematoma (58); avulsion (72); dermatitis, conjunctivitis (74); dislocation (55); foreign body (56); nerve damage (61); puncture (63); strain or sprain (64); and other/not stated (71). Among non-tackle football injuries, laceration was the most common injury diagnosis, followed by concussion, internal injury, contusion/abrasion, and fracture. It should be noted that an internal injury diagnosis in this context may refer to “internal head injuries, such as subdural hematomas or cerebral contusions” or indicate a lack of specific diagnosis for the head injury, per NEISS coding guidelines. 38 There were insufficient non-tackle football cases reported for the remaining codes to produce a stable injury rate estimate.
The rate of lacerations in non-tackle football (43.2 per 100,000 participant-years) was similar to that in soccer (49.1 per 100,000 participant-years) and notably smaller than the rates of lacerations in tackle football (120.9 per 100,000 participant-years) and basketball (163.5 per 100,000 participant-years) (Table 6 and Figure 2). The rate of concussions in non-tackle football (40.7 per 100,000 participant-years) was 3 times smaller than that in basketball (124.9 per 100,000 participant-years) or soccer (138.6 per 100,000 participant-years) and 19 times smaller than that in tackle football (770.4 per 100,000 participant-years). Dental injury, hemorrhage, and hematoma represented the least common diagnoses across sports. No sport had sufficient cases to produce stable estimates for the remaining diagnoses. The relative distribution of non-tackle football injuries was most similar to basketball injuries, whereas soccer and tackle football skewed more heavily to concussions and internal injuries. In each of these injuries (Figure 2), non-tackle football produced the lowest injury rate across the 4 sports.
Projected Annual National Total and Estimated Rates of Injury by Diagnosis a

a Low = annual national projected total of <1200. Avulsion, dermatitis/conjunctivitis, dislocation, foreign body, nerve damage, puncture, and strain/sprain were low across all sports. NEISS, National Electronic Injury Surveillance System. Dashes indicate that a sampling error could not be calculated.
b Total includes “unknown football” injuries projected proportionately by “diagnosis” category into non-tackle or tackle football.
c Per 100,000 participant-years. Estimates are based on the Sports & Fitness Industry Association Single Sport Participation Reports. 30

Projected annual injury rate among participants aged 6 to 18 years by primary diagnosis. Rate is reported per 100,000 participant-years. Bars represent 95% CIs. Participant estimates represent athletes playing the sport at least once in the year. Non-tackle football injury rates were the lowest of the selected sports, across all diagnosis codes examined.
Contacting Object
For non-tackle football, “another player” was the most common contacting object reported (Figure 3 and Table 7). “Ball” and “playing surface” ranked second and third, accounting for nearly equal proportions of injuries, followed by “vertical object” in fourth. This profile was similar to soccer and basketball, although “playing surface” was represented more heavily in basketball, and “ball” was represented more heavily in soccer. In contrast, “another player” was linked to two-thirds of tackle football injuries, with very few injuries associated with “vertical object” or “ball.” It should be noted that a substantial portion of narratives did not report the contacting object.
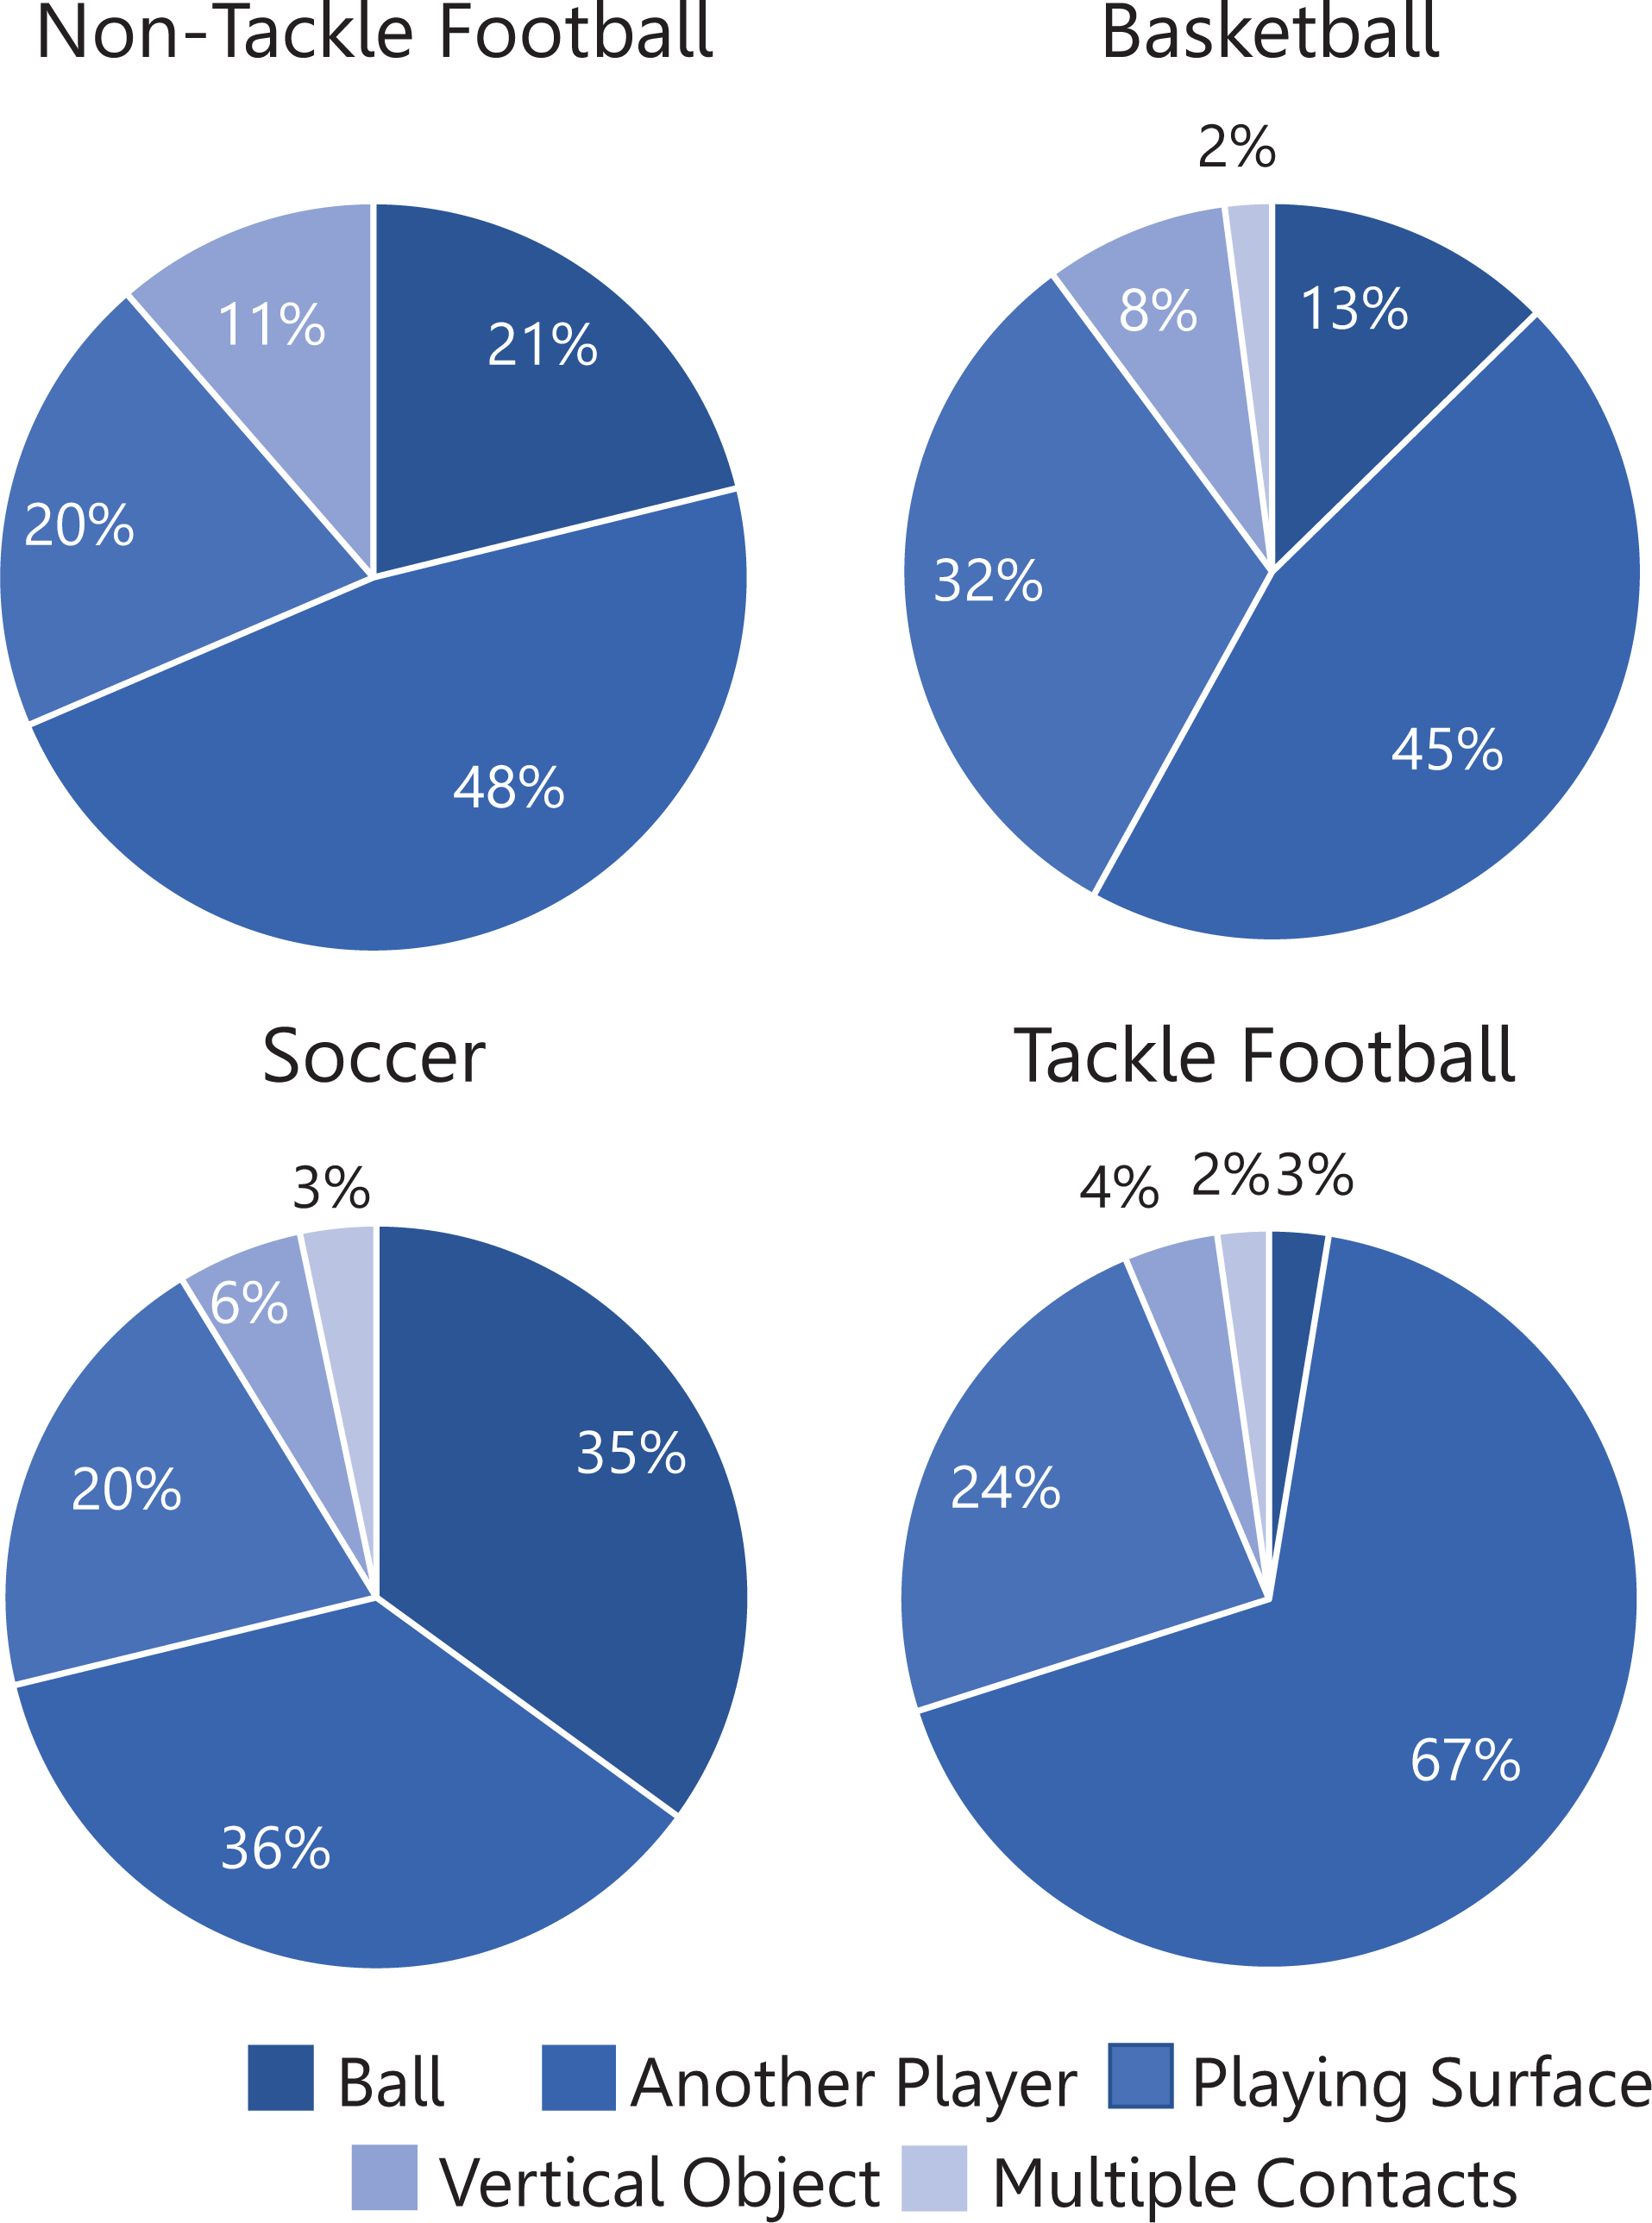
Reported contacting object causing an injury to the head, face, eye, ear, or mouth for selected sports among participants aged 6 to 18 years. Only cases in which the injury narrative reported the contacting object are included. Relative distributions varied by sport, but the most common source of contact across all sports was another player.
Projected Annual National Total and Estimated Rates of Injury by Contacting Object a

a Low = annual national projected total of <1200. NEISS, National Electronic Injury Surveillance System. Dashes indicate that a sampling error could not be calculated.
b Total includes “unknown football” injuries projected proportionately by “contacting object” category into non-tackle or tackle football.
c Per 100,000 participant-years. Estimates are based on the Sports & Fitness Industry Association Single Sport Participation Reports. 30
For non-tackle football cases reporting “another player” as the contacting object, the most common body part making contact was “other,” followed by “elbow,” “head,” and “knee.” “Other” included narratives that suggested that the entire body made contact (eg, “collided with another player”), did not indicate a specific contacting body part (eg, “poked in the eye”), or were uncertain about the contacting body part (eg, “might have been kneed”). “Other” was the second most common contacting body part for the comparative sports. Soccer and tackle football reported “head” as the most common contacting body part, while basketball narratives were most commonly associated with the elbow as the contacting body part.
Discussion
We analyzed injury data from a representative sample of US emergency departments to estimate the annual incidence of head region injuries caused by non-tackle football among youth patients aged 6 to 18 years. A secondary aim was to contextualize these findings by comparing non-tackle football injuries with team sports with similar playing styles and permitted player contact (ie, basketball, soccer) and with tackle football, a sport to which non-tackle football has been offered as a safer option. To our knowledge, this is the first study to produce a national estimate of pediatric head injuries associated with non-tackle football.
Nature of Injuries in Non-Tackle Football
While non-tackle football continues to grow in popularity, the nature of head injuries associated with the sport has not been well established. The interpretation of previous studies has been limited by a number of factors, including not separating tackle football from non-tackle football, 1,13,21,22 sampling from only a few leagues, 15,19,24 and providing minimal details about head and face injuries. 9 Furthermore, only 1 study to date 24 has investigated injuries in athletes younger than 18 years. The present study focused on injuries to the head and face, including the eyeball, ear, and mouth, to provide a comprehensive scope of the injury risk to the head region. Likewise, it was important to separate tackle and non-tackle football, as the 2 sports were expected to produce unique injury profiles because of differences in protective equipment requirements and amount of physical contact, among other factors.
Among the non-tackle football injuries, eyeball, mouth, or ear injuries were significantly less frequent than injuries to the face or head body parts. Face injuries were typically characterized as a laceration, contusion/abrasion, or fracture. The most common injuries to the head were a concussion or internal injury, with some instances of a contusion/abrasion and laceration and very few hematoma or fracture diagnoses. Kaplan et al 12 examined time-loss injuries over 2 seasons in an adult contact flag football league and found that over 50% of injuries to the head, face, and lips were lacerations, while contusions, concussions, and fractures accounted for the remainder of injuries. Interestingly, a study of youth non-tackle football injuries 24 found concussions to be much higher (23% of all injuries) than suggested by our present data (26% of head region injuries) or by other studies (4%-11% of all injuries). 2, 12,14,22 The discrepancy could represent the difference between examining a nationwide sample and a single league. Alternatively, the NEISS database only captures injuries that are seen in an emergency department and may underestimate injuries (eg, concussions) that frequently present to an athletic trainer, primary care physician, or specialty clinic rather than an emergency department. 7
Similar to other studies of non-tackle football injuries, 2,12 contact with another player was the most commonly reported injury mechanism for non-tackle football. Although non-tackle football is considered a lower contact sport, it is clearly not a noncontact sport. The body part of the contacting athlete was most commonly classified as “other,” which included narratives that suggested that the entire body made contact, did not indicate a specific contacting body part, or were uncertain about the contacting body part. The head, elbow, or knee was the contacting object in one-third of the reports. Injuries also were commonly attributed to the playing surface. These findings agree with a study of head contact in organized youth 7v7 football that found that head-to-body contact and head-to-ground contact were the most common sources of head contact and that head-to-head contact was infrequent. 11
Interestingly, several non-tackle football injuries were classified as being caused by a vertical object adjacent to the field, such as a brick wall, metal pole, fence, bleacher, or door. Likewise, several injuries referenced hard or manmade ground, including asphalt, concrete, and gym flooring. Most of these are features that are not typical of organized non-tackle football. Correspondingly, many of these cases indicated that the injury setting was a school, street, or home, and several narratives referenced physical education class or recess. Injury prevention measures may benefit from accounting for these scenarios, such as encouraging flag football during gym class to be played on a turf field without hard objects immediately surrounding the field of play. Likewise, the majority of the cases reported in the NEISS database were associated with flag football. It is unclear whether this represents a true difference in the risk between flag, touch, and 7v7 football or rather reflects differences in overall participation. Many of the flag football narratives referenced a school setting or physical education class, which may suggest that flag football is a more common staple of physical education curriculums than other disciplines and in turn may lend itself to a higher proportion of injuries, as noted above.
Comparison of Non-Tackle Football With Basketball, Soccer, and Tackle Football
In agreement with our hypothesis, these data suggest that non-tackle football is associated with lower head-region injury rates than tackle football for athletes aged 6 to 18 years when examining injuries warranting a hospital visit. Tackle football was associated with the highest rate of injuries of the 4 sports analyzed—approximately 10 times higher than non-tackle football after accounting for estimated participation. This finding agrees with a recent study that found flag football to be associated with significantly fewer head impacts per player, as measured by head impact sensors, compared with tackle football. 17 Peterson et al 24 reported fewer total injuries but double the rate of concussions in youth flag football compared with tackle football. The source of discrepancy between these results and those of the present study is unclear, but it may represent a difference between the nationwide sample over 5 years used here compared with the more limited sample (2 tackle leagues and 1 flag league over a single season) of Peterson and colleagues. 24
We also hypothesized that the lower contact sports (ie, soccer, basketball, and non-tackle football) would have similar injury rates, which was not confirmed. Rather, the rate of non-tackle football injuries was approximately 30% of that of soccer or basketball. An analysis of all NEISS injuries from 2003 to 2007 for people aged ≥15 years found that football-related injuries occurred at twice the rate of soccer and basketball injuries when participation rates were accounted for in the calculation, 3 although football was not differentiated between tackle and non-tackle. One may expect that soccer, basketball, and non-tackle football would have similar injury rates because all 3 sports are considered lower contact than tackle football and none typically requires protective headgear. The rates reported for basketball and soccer were generally similar, which agrees well with other studies. 1,3
The low rate of head region injuries in non-tackle football supports non-tackle football as a suitable alternative to tackle football for players and parents concerned about head injuries in other sports, including tackle football. 5,35 It also supports recent work calling for expanded access to non-tackle football, particularly in communities of lower socioeconomic status. 16 Owing to the small number of non-tackle football cases in the NEISS query, we were unable to examine injury rates by age, sex, or non-tackle discipline. Future work should examine head injury profiles by these factors to further refine safety recommendations.
Limitations
There are several important limitations that should be considered when interpreting these findings. Both male and female athletes and all ages (6-18 years) were included in the analysis because non-tackle football is played by both sexes and these ages. We acknowledge that sex and age may influence the injury risk, 4,23,36 but we were unable to parse out data by either, as some estimates were rendered unstable because of too few cases. Thus, we cannot postulate whether significant differences across sports in these demographic factors reflect underlying differences in participation or demographic-specific injury risks. Likewise, there were insufficient data to examine by non-tackle category (ie, flag, touch, 7v7), so we could not determine how the styles differ in their injury profile. Although we sought to eliminate injuries reflecting nontypical play (eg, hitting a basketball with a baseball bat), the injuries reported likely reflect a mix of organized and unorganized (eg, “pick-up”) play, which may have different injury risk profiles. For example, it would be reasonable to expect that tackle football is more frequently played in an organized setting than the other sports, which should include better enforcement of safety rules and fewer injuries but also may include better medical coverage, leading to more injuries identified.
Both sources of data (NEISS and SFIA) for this analysis are projections based on national sampling and carry inherent errors. The sampling error associated with the NEISS was approximated, as described in Equation 5. In estimating injury rates across sports, SFIA participation was treated as a point estimate. In its single-sport participation reports, the SFIA provided a standard error estimate for participation rates of 0.27 percentage points with a 95% confidence level (eg, 95% confidence that a participation rate listed at 5% is ±0.27%). Also, the manual categorization of sports were based on incident narratives entered by hospital staff, of which the level of detail may vary by circumstance and could lead to bias in some unknown way. Furthermore, attributing “unknown football” data to “tackle football” and “non-tackle football” in proportion to the relative rates for “tackle” and “non-tackle” assumes that narratives that cannot be categorized into “tackle” or “non-tackle” have the same relative rates as those that can. This is a critical assumption that represents a best guess in the absence of other information. Adjustments to produce estimated sport participation rates from SFIA data presented here contribute errors and represent one way to estimate sport participation with injury information in the absence of complete data. Other strategies, data sets, or assumptions may be appropriate for other research questions. 3 Finally, participation for 18-year-old players was estimated as one-seventh of that of the 18- to 24-year age group. However, 18-year-old players who are still in high school may be more likely to play tackle football than 18- to 24-year-old players as a whole, so the one-seventh approach may have somewhat underestimated tackle versus non-tackle football participation. It is not clear how the assumption would influence the other sport participation numbers.
Conclusion
Among 6- to 18-year-old athletes presenting to US emergency departments for sport-related head-region injuries, the rate of injuries for non-tackle football was found to be lower than that for tackle football, soccer, and basketball. This finding held true for all examined body parts (head, face, eye, ear, mouth) and diagnosis codes. The relative distribution of injuries by body part, diagnosis, and mechanism was generally similar across sports. These results suggest that non-tackle football poses a lower head and face injury risk than these other sports, and they provide context for developing appropriate safety measures for the sport. Future work should expand this analysis to examine injury profiles by sex, age, and non-tackle discipline.
Supplemental material for this article is available at http://journals.sagepub.com/doi/suppl/10.1177/2325967120975402.
Supplemental Material
Supplemental Material, sj-pdf-1-ojs-10.1177_2325967120975402 - Emergency Department Visits From 2014 to 2018 for Head Injuries in Youth Non-Tackle Football Compared With Other Sports
Supplemental Material, sj-pdf-1-ojs-10.1177_2325967120975402 for Emergency Department Visits From 2014 to 2018 for Head Injuries in Youth Non-Tackle Football Compared With Other Sports by Jessica M. Zendler, Ron Jadischke, Jared Frantz, Steve Hall and Grant C. Goulet in Orthopaedic Journal of Sports Medicine
Footnotes
Acknowledgment
The authors acknowledge Judith J. Isaacson, MS, and Luke Grieser for their assistance with data analysis.
Final revision submitted July 17, 2020; accepted September 14, 2020.
One or more of the authors has declared the following potential conflict of interest or source of funding: Financial support for this study was received from Xenith, which manufactures protective equipment for American football. J.M.Z. is a member of the Scientific Advisory Board of Xenith. R.J. and G.C.G. are employees of Xenith. J.M.Z., J.F., and S.H. are paid consultants for Xenith. AOSSM checks author disclosures against the Open Payments Database (OPD). AOSSM has not conducted an independent investigation on the OPD and disclaims any liability or responsibility relating thereto.
Ethical approval was not sought for the present study.
References
Supplementary Material
Please find the following supplemental material available below.
For Open Access articles published under a Creative Commons License, all supplemental material carries the same license as the article it is associated with.
For non-Open Access articles published, all supplemental material carries a non-exclusive license, and permission requests for re-use of supplemental material or any part of supplemental material shall be sent directly to the copyright owner as specified in the copyright notice associated with the article.