
Abstract
Background:
Two types of stress, bending stress and traction stress, have been reported to be involved in the mechanism of Jones fracture. However, little is known about the risk factors for traction stress.
Purpose:
To classify the attachment position of the peroneus brevis muscle (PB), peroneus tertius (PT), lateral band of the plantar aponeurosis (LB), and the long plantar ligament (LPL), focusing on the zone where a Jones fracture occurs (zone 2), and to compare the footprint area of each tissue type.
Study Design:
Descriptive laboratory study.
Methods:
This study examined 102 legs from 55 Japanese cadavers. Type classification was performed by focusing on the positional relationship between each tissue attachment and the zone where Jones fracture occurs (zone 2). The classifications were as follows: type I, attached proximal to the border between zones 1 and 2; type IIa, attached to the border between zones 1 and 2 with one attached part; and type IIb, attached across the border between zones 1 and 2 with two or more attached parts. The footprint areas of the PB, PT, LB, and LPL were compared between tissue types and within each attachment classification.
Results:
The PB was recorded as type I in 41 feet (40.2%), type IIa in 56 feet (54.9%), and type IIb in 5 feet (4.9%); the PT was recorded as type IIa in 54 feet (60.0%) and type IIb in 36 feet (40.0%); and the LB was recorded as type I in 27 feet (26.5%) and type IIa in 75 feet (73.5%). The LPL did not attach to the fifth metatarsal bone. No significant difference was found in the footprint area between type I PB and type I LB.
Conclusion:
The results indicate that type I, which attaches proximal to zone 2, occurs with PB and LB, and there was no significant difference in the footprint area between them. These findings suggest that type I is involved in traction stress. In the future, biomechanical research based on the results of this study will be necessary.
Clinical Relevance:
The results of this study provide basic research for investigating the mechanism of Jones fracture and the cause of delayed healing.
Fractures of the proximal fifth metatarsal are common fractures of the foot. 12,14,27 Such fractures have been classified into 3 types: tuberosity avulsion fractures (zone 1), Jones fractures (zone 2), and diaphyseal stress fractures (zone 3). 19,28 Zones 2 and 3 are often treated together as Jones fractures, and it has been reported that there is no difference in treatment results. 3 Therefore, in this study, zones 2 and 3 were treated as Jones fractures. Because the area where Jones fractures occur has a poor blood supply, 22,33,36 basketball, 17 soccer, 6,7 and American football 37 players with such injuries have been reported to have low rates of return and healing. Furthermore, the high rate of male injury 23 and refracture 7,42 and reports of injury on both sides 4,21 have recently been regarded as problems. Therefore, Jones fracture is an injury related to a player’s career, and its prevention is an urgent issue.
To prevent a fracture, it is necessary to accurately understand the mechanism of occurrence and identify the risk factors. 8,41 There are 2 types of Jones fracture mechanisms. The first is bending stress caused by distortion of the fifth metatarsal bone on ground contact. 25 The second is traction stress caused by the tension of the tissues attached to the proximal part of the fifth metatarsal bone during ankle plantarflexion. 38 The risk factors for bending stress have been reported to be an increase in anterior lateral plantar pressure, 1,11,35,40 hindfoot varus alignment, 20,29 forefoot supination alignment, 21 metatarsal adduction alignment, 15,43 reduced toe grip force, 10 hip internal rotation limitation, 31 and narrow shoe width. 16 However, risk factors for traction stress have not been fully elucidated, and it has been pointed out that traction stress may have an adverse effect on fracture incidence and healing. 24 If we could understand the characteristics of players with high traction stress and bending stress, it would be easier to identify players at high risk of Jones fractures.
The differences in the tissues attached to the proximal part of the fifth metatarsal bone have been associated with traction stress. The tissues that cause traction stress on the fifth metatarsal bone have been reported to be the peroneus brevis muscle (PB), the peroneus tertius muscle (PT), the lateral band of the plantar aponeurosis (LB), and the long plantar ligament (LPL), which are considered to be the cause of zone 1 fractures. 26,30,39 In a study using fresh-frozen cadavers, 24 it was reported that the type in which the PB is attached more proximally than the fracture line is significantly opened by the traction force of the PB compared with the type in which the PB crosses the fracture line. In addition, it has been reported that fractures distal to the PB attachment heal slowly. 5 In a study using fixed cadavers, 13 investigators reported that the distance between the PB attachment site and the tarsometatarsal joint (fifth metatarsal bone–cuboid bone) was 8.53 ± 3.11 mm. However, the location at which each tissue attaches to zone 2 has not been fully investigated.
Therefore, in the present study, the aim was to classify cadaveric specimens based on where the PB, PT, LB, and LPL attach to zone 2 and to examine the footprint area of the tissues for each type classification. We hypothesized that that the attachment type in which tissues were located more proximally than zone 2 will be the PB and LB.
Methods
Cadaversic Specimens
This investigation examined 102 legs from 55 Japanese cadavers (mean age at death, 78.5 ± 12.1 years; 57 legs from men, 45 legs from women; 50 right sides, 52 left sides) that had been switched to alcohol after placement in 10% formalin. None showed signs of previous major surgery around the foot or ankle or any relevant deformities, and there was no obvious degeneration in any specimen. The cadavers were donated to the Nippon Dental University School of Life Dentistry in Niigata.
Procedure
The dissection procedure was as follows. First, isolated specimens of the leg were created by transection 10 cm above the ankle. Skin and subcutaneous tissues were subsequently removed, and the PB, PT, LB, and LPL were carefully exposed. Whether each tissue was present and attached to the fifth metatarsal bone was checked in all specimens.
Zones 1 and 2 were identified based on the Lawrence and Botte 19 classification. Based on a previous study, 32 the border line between zones 1 and 2 was created with the vertical line to the fifth metatarsal long axis from the proximal end of the fourth to fifth intermetatarsal joints. The border line between zones 2 and 3 was created with the vertical line to the fifth metatarsal long axis from the distal end of the fourth to fifth intermetatarsal joint. The long axis and the vertical line of the fifth metatarsal bone were made by use of nylon thread with a diameter of 0.33 mm (GAIM) (Figure 1). The long axis of the fifth metatarsal was defined by measuring the midpoint of 2 widths of the fifth metatarsal shaft with a digital caliper (Shinwa Rules) and connecting the midpoints.

Zone determination method; left side, lateral view. ① Long axis of the fifth metatarsal (a line connecting the midpoints of 2 diaphyses). ② The vertical line to the fifth metatarsal long axis from the proximal end of the fourth to fifth intermetatarsal joint. ③ The vertical line to the fifth metatarsal long axis from the distal end of the fourth to fifth intermetatarsal joint. 1 (blue area), zone 1; 2 (red area), zone 2; A, anterior; P, posterior.
The standard for type classification was the attachment of the PB, PT, LB, and LPL to zone 2. The classifications were as follows: type I, attached proximal to the border between zones 1 and 2; type IIa, attached to the border between zones 1 and 2 with one attached part; and type IIb, attached across the border between zones 1 and 2 with two or more attached parts. The presence of each tissue within each attachment type was recorded. In addition, for each attachment type we evaluated the footprint area of the PB, PT, LB, and LPL tissues, as well as any sex- or laterality-based differences. In determining differences between left and right legs, we measured both legs of 94 cadavers (54 legs from 27 male specimens; 40 legs from 20 female specimens).
The footprint area was identified by coloring the attached site with a pen after exfoliating each attached tissue. The measurement of the footprint was digitized at about 2-mm intervals through use of the MicroScribe system (G2XSYS; Revware). Rhinoceros 3D software (McNeel) was used to analyze the footprint (Figure 2). To determine differences between left and right legs, we measured both legs of 94 cadavers (54 legs from 27 male specimens, 40 legs from 20 female specimens). All measurements were made by the same examiner (F.K.), each site was measured 3 times, and the mean value and standard deviation were calculated.

Footprint area measurement method. (A) Measurement using the MicroScribe system; left side. (B) Digitizing around the footprint area; left side, lateral view. 1 (blue), peroneus brevis muscle; 2 (red), peroneus tertius muscle; 3 (green), lateral band of the plantar fascia; A, anterior; P, posterior.
Statistical Analysis
We analyzed the intrarater reliability for type classification and footprint area. Examination of intrarater reliability was performed with measurement of the 10 legs treated in this study. The 10 legs were randomly selected from the specimens in this study. The first measurement was taken by the method described above, and the second measurement was then taken within 1 week. The intrarater reliability for type classification was calculated through use of the Cohen κ coefficient, and the intrarater reliability for footprint area calculation was calculated using the intraclass correlation coefficient, ICC (1,3). The minimal detectable difference at the 95% CI (MDD95%) was calculated as follows 34 : MDD95% = z × SEM × √2, where z = 1.96 and SEM = SD√(1 − ICC).
Sex- and laterality-based differences in attachment type were examined through use of the chi-square test and residual analysis. The difference in the footprint area between types was examined in each tissue using 1-way analysis of variance for parametric data and the Mann-Whitney U test for nonparametric data. The choice of statistics reflected the results of performing the Shapiro-Wilk test. The footprint area was compared between tissues by attachment type through use of the unpaired t test. The level of significance was taken to be 5%.
Results
Intrarater Reliability for Type Classification and Footprint Area
The Cohen κ coefficient for the intrarater reliability of type classification was 1.00 for all tissues. The ICC (1,3) of intrarater reliability of the footprint area was 0.970 for the PB, 0.919 for the PT, and 0.953 for the LB (Table 1). In this study, the measurements of type classification and footprint area showed almost perfect reliability, according to the classification by Landis and Koch. 18 The intrarater reliability of the LPL was not investigated because the LPL was not attached to the fifth metatarsal bone.
Intrarater Reliability and MDD95% of the Footprint Area Measurement a

a ICC, intraclass correlation coefficient; MDD95%, minimal detectable difference at the 95% CI.
b Classified according to Landis and Koch 18 : <0, no agreement; 0-0.20, slight agreement; 0.21-0.40, fair agreement; 0.41-0.60, moderate agreement; 0.61-0.80, substantial agreement; 0.81-1.00, almost perfect agreement.
Classification by Attachment Type
The presence of each type of tissue to the fifth metatarsal bone is shown in Table 2. In all specimens, the LPL was not attached to the fifth metatarsal bone, and it had migrated to the origin of the flexor digiti minimi brevis muscle and the opponens digiti minimi muscle. The tissue presence by attachment type was as follows: the PB was recorded as type I in 41 feet (40.2%), type IIa in 56 feet (54.9%), and type IIb in 5 feet (4.9%); the PT was recorded as type IIa in 54 feet (60.0%) and type IIb in 36 feet (40.0%); and the LB was recorded as type I in 27 feet (26.5%) and type IIa in 75 feet (73.5%) (Figures 3 -5).
Tissue Presence Rate and Attachment Rate to the Fifth Metatarsal Bone


Classification of the peroneus brevis muscle; left side, lateral view. Type I, attached proximal to the border line between zones 1 and 2 (vertical gray line). Type IIa, attached to the border line between zones 1 and 2 with one attached part. Type IIb, attached across the border line between zones 1 and 2 with two or more attached parts. A, anterior; P, posterior; dotted line around the blue-shaded area signifies the peroneus brevis muscle attachment.

Classification of the peroneus tertius muscle; left side, lateral view. Type IIa, attached to the border line between zones 1 and 2 (vertical gray line) with one attached part. Type IIb, attached across the border line between zones 1 and 2 with two or more attached parts. A, anterior; P, posterior; dotted line around the red-shaded area signifies the peroneus tertius muscle attachment.

Classification of the lateral band of the plantar fascia; left side, lateral view. Type I, attached proximal to the border line between zones 1 and 2 (vertical gray line). Type IIa, attached to the border line between zones 1 and 2 with one attached part. A, anterior; P, posterior; dotted line around the green-shaded area signifies the lateral band of the plantar fascial attachment.
Regarding sex-based differences, in male specimens, the PB was type I in 29 feet (50.9%) and type II in 28 feet (49.1%), whereas in female specimens, the PB was type I in 12 feet (26.7%) and type II in 33 feet (73.3%). Results of the chi-square test and residual analysis indicated that there were significantly more male type I and female type II PB cases (P = .013, adjusted residuals for male type I, 2.48; adjusted residuals for female type II, 2.48). In male specimens, the LB was type I in 16 feet (28.1%) and type II in 41 feet (71.9%), whereas in female specimens, the LB was type I in 11 feet (24.4%) and type II in 34 feet (75.6%); the chi-square test showed no difference in LB type between the sexes (P = .680).
Regarding type I laterality differences (n = 94 specimens), the PB was type I on both sides in 11 cadavers (23.4%), unilateral type I in 19 cadavers (40.4%), and non–type I on both sides in 17 cadavers (36.2%). The LB was type I on both sides in 5 cadavers (10.6%), unilateral type I in 16 cadavers (34.0%), and non–type I on both sides in 26 cadavers (55.3%). The chi-square test showed no significant difference in laterality for the PB or the LB (P = .111).
Footprint Area Measurement
Table 3 shows the footprint area of each tissue by type. No significant differences between attachment types were found in the footprint area of the PB or PT (PB: P = .070; PT: P = .125). For the LB, the type I attachment area was significantly smaller than that of type IIa (P = .002). No significant difference was seen between the PB and the LB in the type I attachment area (P = .960).
Footprint Area of Each Tissue by Classification a
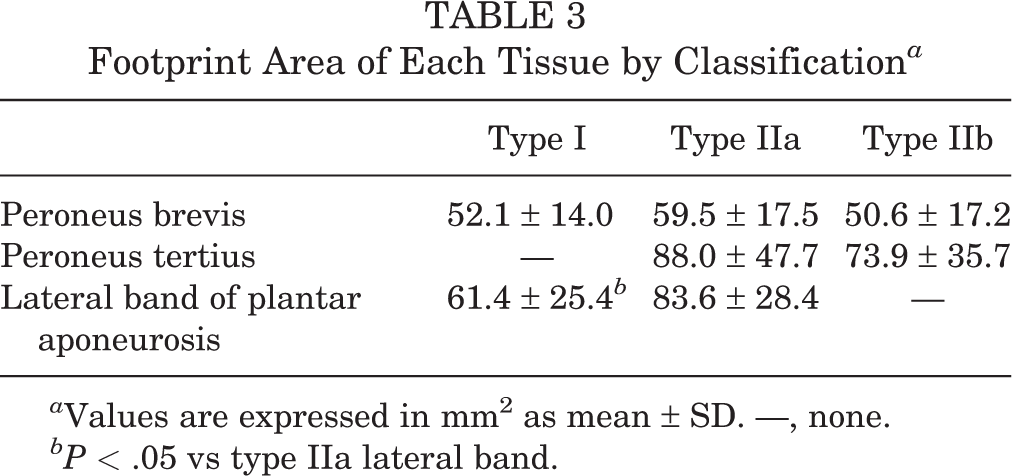
a Values are expressed in mm2 as mean ± SD. —, none.
bP < .05 vs type IIa lateral band.
Discussion
In this study, the attachments of the PB, PT, and LB were classified based on their presence in the Jones fracture area (zone 2), and the footprint area of each was compared between tissue types and within each attachment classification. To the best of our knowledge, this is the first study focusing on the location of each tissue attached to the proximal part of the fifth metatarsal bone.
In this study, type I, attachment location proximal to zone 2, was present in the PB (40.2%) and the LB (26.5%), and the PT was only attached in type II locations. In a previous study using fresh-frozen cadavers, 24 investigators reported that the type in which the PB was attached more proximally than the artificial fracture line significantly opened the fracture line more than the type in which the PB was attached so as to straddle the artificial fracture line. Other investigators reported that patients with Jones fractures have a fracture line distal to the attachment site of the PB, and these take time to heal. 5 Based on the results of the present study, it is possible that type I PB and type I LB are related to traction stress and the development of Jones fractures and delayed healing. Furthermore, because there is a possibility that PT, which was classified as type II, exists in the distal part of the attachment of PB and LB, the combination of the 3 tissue attachment types of PB, LB, and PT may affect traction stress.
In the present study, there were significantly more male type I and female type II cases. In a study using a questionnaire survey of 1854 soccer players regarding sex-based differences in Jones fracture incidence, investigators reported that the incidence of Jones fracture was 0.88% for female players and 2.29% for male players. 23 Although the factors that occur more frequently in men have not been clarified, it has been reported that men are more heavily loaded on the outside of the forefoot than women. 35 Therefore, it is thought that the sex difference in the incidence is due to bending stress. However, based on the present study, it is possible that not only the sex difference in bending stress but also the sex difference in the attachment of the proximal part of the fifth metatarsal bone may be the cause of the higher incidence in men.
In this study, the LB had a significantly smaller footprint area with type I attachments than with type IIa, and no significant difference was found between the footprint areas of type I PB and type I LB. The traction force of the tissue can be obtained by the following equation: Traction Force (N·mm2) = Tension (N) / Footprint Area (mm2) (excerpt from the Young modulus calculation formula 2,9 ). If the tension is constant, a larger traction force may be generated if the footprint area is small. Therefore, it is possible that type I LB has greater traction than type IIa LB. In addition, we found no significant difference in the footprint area between type I PB and type I LB, so the traction force may depend on the tension of each tissue. Therefore, we think that it is necessary to consider the traction stress of both tissues, not the PB or the LB alone.
A limitation of this study is that all cadaveric specimens were Japanese. The Jones fracture rate has been reported to be 0.5% 7 for professional soccer players in the European league and 2.21% 23 for Japanese soccer players. The racial difference in Jones fracture incidence has not been fully investigated, but it appears that this type of fracture occurs more frequently in Japan than in Europe. Therefore, it is necessary to examine the racial difference in the attachment type of each tissue. In addition, the cadavers used in this study were elderly and preserved. It is conceivable that the morphologic characteristics of the bone may have been acquired after long-term mechanical stress due to age. Because the cadavers were preserved, biomechanical examination 24 could not be conducted. Another limitation was that the measurement in this study was made by only 1 examiner, however the intrarather reliability showed almost-perfect agreement.
Conclusion
In this study, type I, attaching proximal to zone 2, was present in the PB and the LB, and no significant difference was found in the footprint area between type I PB and type I LB. These findings suggest that type I is involved in traction stress. In future research, based on this study, it will be necessary to verify whether type I actually increases traction stress to the Jones fracture area, whether type classification in vivo is possible by ultrasonography or magnetic resonance imaging, and whether type I is actually a risk factor for the occurrence of Jones fractures and healing delay.
Footnotes
Acknowledgement
The authors acknowledge and thank those anonymous individuals who generously donate their bodies so that studies such as this can be performed.
Final revision submitted March 21, 2020; accepted April 6, 2020.
One or more of the authors has declared the following potential conflict of interest or source of funding: This study was supported by Japan Society for the Promotion of Science (JSPS) KAKENHI, grant JP19K11358, and a grant-in-aid program from Niigata University of Health and Welfare. AOSSM checks author disclosures against the Open Payments Database (OPD). AOSSM has not conducted an independent investigation on the OPD and disclaims any liability or responsibility relating thereto.
Ethical approval was not sought for the present study.