
Abstract
Background:
The majority of patients with an acute lateral ankle ligamentous injury are successfully treated nonoperatively with functional rehabilitation; however, a small proportion of these patients experience persistent chronic instability and may require surgical intervention. Delayed primary repair of the ruptured ligaments is most commonly indicated for these patients. Optimal rehabilitation after lateral ankle ligament repair remains unknown, as surgeons vary in how they balance protection of the surgical repair site with immobilization against the need for ankle joint mobilization to restore optimal postoperative ankle range of motion.
Purpose:
To compare early and delayed mobilization (EM and DM, respectively) postoperative protocols in patients undergoing primary lateral ankle ligament repair to determine optimal evidence-based rehabilitation recommendations.
Study Design:
Systematic review; Level of evidence, 4.
Methods:
Following the PRISMA (Preferred Reporting Items for Systematic Reviews and Meta-Analyses) guidelines, a meta-analysis using the PubMed/Ovid MEDLINE database was performed (October 11, 1947 to October 16, 2017), searching for articles involving lateral ankle ligament repair. Postoperative protocols were reviewed and divided into 2 categories: EM (within 3 weeks of surgery) and DM (more than 3 weeks post surgery). Return to sport (RTS), outcome scores (American Orthopaedic Foot and Ankle Society [AOFAS] ankle-hindfoot scale and Karlsson score), radiographic outcomes (talar tilt and anterior drawer), and complications of both populations were recorded and statistically analyzed.
Results:
A total of 28 of 1574 studies met the criteria for the final analysis, comprising 1457 patients undergoing primary lateral ankle ligament repair. The postoperative AOFAS score was significantly greater in the EM versus DM group (98.8 vs 91.9, respectively; P < .001), as was the postoperative Karlsson score (92.2 vs 90.0, respectively; P < .001). However, the EM group had significantly greater postoperative laxity on both the anterior drawer test (6.3 vs 3.9 mm, respectively; P < .001) and talar tilt test (5.1° vs 4.5°, respectively; P < .001). Also, the DM group had significantly lower rates of overall complications (3.1% vs 11.4%, respectively; P < .001) and skin wound complications (1.3% vs 3.8%, respectively; P = .005). RTS was not significantly different between groups (P = .100).
Conclusion:
Patients with EM postoperative protocols demonstrated improved functional outcomes; however, the EM group had increased objective laxity and a higher complication rate. Additional randomized studies are needed to definitively evaluate early versus delayed rehabilitation protocol timetables to optimize functional outcomes without compromising long-term stability.
Lateral ankle ligamentous injuries occur frequently in both athletes and the general population. 32 Approximately 40% of all athletic injuries involve the ankle, and there is an incidence of 30,000 cases per day in the United States. 9 The anterior talofibular ligament and calcaneofibular ligament are the most commonly injured ankle ligaments. Without appropriate treatment and functional rehabilitation, a lateral ankle ligament injury may progress to chronic lateral ankle instability (CLAI), which may result in either mechanical or functional ankle instability. 34 The diagnosis of mechanical ankle instability relies on a physical examination and imaging such as stress radiography, magnetic resonance imaging, and possibly even ultrasound. However, functional ankle instability is considered more clinically relevant. It may be considered when the patient's history supports subjective ankle instability and neither a physical examination nor imaging reliably identify ankle instability. This is thought to be caused by proprioceptive disorders that result in the subjective feeling of the “ankle giving out.” 15
Nonoperative management of acute lateral ankle ligamentous injuries successfully alleviates symptoms in the majority of patients; however, if symptoms persist for longer than 6 months, surgical treatment to restore ankle stability may be indicated. 35 CLAI may be addressed surgically with anatomic ligament repair or anatomic ligament reconstruction. 33 Anatomic repair has the advantage of recovering the kinematics and anatomy of the ankle while also eliminating donor site morbidity due to autograft reconstruction. 28 The Brostrom technique provides anatomic surgical repair of the anterior talofibular ligament. Brostrom repair has shown excellent outcomes and has become the gold standard in treating CLAI. 3
The recovery time after a Brostrom procedure varies, but full recovery usually takes a minimum of 3 to 6 months. 4 After surgical incisions fully heal, some authors recommend that patients transition to a cast for immobilization for 3 to 6 weeks to protect the operative ligament repair site. 4 Ankle immobilization, while protective of the ligament repair site, restricts ankle range of motion, which may result in diminished postoperative ankle motion as well as disuse muscle atrophy. To prevent these undesired adverse effects, surgeons have sought to examine the clinical outcomes of postoperative rehabilitation protocols that allow early ankle range of motion in the hopes that such protocols fulfill the goal of optimal postoperative function without increasing complications or compromising stability of the ankle.
Postoperative rehabilitation protocols are essential to fulfilling patient expectations and achieving maximal functional outcomes. The optimal postoperative rehabilitation for lateral ankle ligament repair remains unknown. The aim of this review was to provide insight into early and delayed mobilization (EM and DM, respectively) postoperative protocols in patients undergoing primary lateral ankle ligament repair to determine evidence-based rehabilitation guidelines. We hypothesized that EM postoperative rehabilitation protocols would have earlier and better functional outcomes and earlier return to sport (RTS) versus DM postoperative rehabilitation protocols without having an increase in complications.
Methods
Search Strategy and Study Selection
This study followed the PRISMA (Preferred Reporting Items for Systematic Reviews and Meta-Analyses) guidelines. 27 Because this study was a systematic review/meta-analysis of published studies, institutional review board approval was not required. A systematic literature review/meta-analysis was conducted on October 16, 2017 using the PubMed/Ovid MEDLINE database; the dates of publication were limited from October 11, 1947 through October 16, 2017. The main keywords lateral ankle repair, lateral ankle ligament repair, lateral ankle ligament reconstruction, Brostrom, Brostrom Gould Brostrom-Gould, and modified Brostrom were used in the electronic search. Two investigators (A.T., P.G.) performed a separate manual study selection from this list to exclude repetitions and to select those specifically related to our focus. In case of any discrepancies in article selection between the 2 investigators, a third investigator (M.L.V.) was involved. Only studies published in the English language were included in this study. The reference lists of all the studies selected were screened for additional articles.
Eligibility Criteria
Clinical trials that included all of the following criteria were considered eligible: published in the English language, patients undergoing primary lateral ankle ligament repair, a follow-up at least 1 year, reported outcomes (American Orthopaedic Foot and Ankle Society [AOFAS] ankle-hindfoot scale, Karlsson score, RTS, talar tilt, anterior drawer, overall complications, skin wound complications, or reoperation rate), and reported postoperative rehabilitation protocols. Studies were excluded if they included patients who underwent any of the following: lateral ankle ligament reconstruction with an autograft or allograft, suture tape augmentation (internal brace fixation), revision ligament repair or reconstruction, concomitant talar chondral or osteochondral repair or reconstructive procedures, concomitant peroneal tendon procedures (peroneal tendon debridement or tendon repair), concomitant superior peroneal retinaculum repair, concomitant treatment of hindfoot or forefoot abnormalities (calcaneal osteotomy for cavovarus reconstruction or subtalar arthrodesis), and/or syndesmosis repair or open reduction and internal fixation of ankle fractures.
Data Extraction and Quality Appraisal
Postoperative protocols in each article were reviewed and divided into 2 categories: EM, defined as allowing range of motion therapy and/or weightbearing within 3 weeks of the date of surgery, and DM, defined as permitted ankle range of motion after 3 weeks from the date of surgery. Thus, if patients were allowed to bear weight with a cast or splint within 3 weeks, they were considered in the EM group. There was wide variability in the literature on when a patient was permitted to bear weight and/or allowed range of motion of the injured ankle postoperatively. The majority of postoperative protocols seemed to immobilize for at least 1 week postoperatively because of wound healing. Another large portion of studies immobilized at least 4 to 6 weeks postoperatively. Hence, 3 weeks is an appropriate cutoff because this seemed to be the difference in ranges available in the literature. RTS, talar tilt, anterior drawer, functional outcome scores (AOFAS and Karlsson scores), and total complications of both populations were recorded and statistically analyzed. Skin wound complications were further subdivided from the overall complication rate. Skin wound complications were defined as either wound dehiscence, wound infection, and/or wound drainage. This was then further statistically analyzed. An assessment of methodological quality was conducted with the Cochrane Collaboration tool. 14 This was performed by 2 reviewers (A.T., M.H.). A third reviewer (M.L.V.) was designated in the case of any disagreement.
Statistical Analysis
Categorical variables were summarized by mobilization group, 1-3 weeks (EM) and >3 weeks (DM), and included counts and percentages for participants by sex, complications (skin wounds and reoperations), and RTS. Comparisons by group, EM versus DM, were evaluated with 2-sided, independent, 2-sample proportion z tests. Results were reported for P values and 95% confidence intervals (CIs) for the difference in proportions. Continuous variables were summarized with weighted means and standard deviations for age and weeks to RTS. Similarly, weighted means and standard deviations were used to summarize measurements from preoperatively to postoperatively, along with their differences for anterior drawer, talar tilt, AOFAS scores, and Karlsson scores. Comparisons by group were evaluated using 2-sided, independent-sample t tests. Before conducting t tests, the equal variance assumption was assessed with the Levene test for each variable. All statistical analyses were performed with SPSS Statistics (Version 23.0; IBM Corp).
Results
The initial PubMed/Ovid MEDLINE database search identified 1574 articles. Of these, 1317 articles were excluded because they did not meet the inclusion criteria (Figure 1). Of the remaining 257 studies, 69 were selected for initial screening. Then, 41 articles were critically reassessed, and 28 articles remained after the secondary screen. Of the 28 articles identified for study inclusion, 8 studies utilized EM 8,10,22,23,28 –31 for their postoperative rehabilitation protocol, and 21 studies utilized DM. || Only 1 study looked at the comparison between EM and DM postoperative protocols. 22
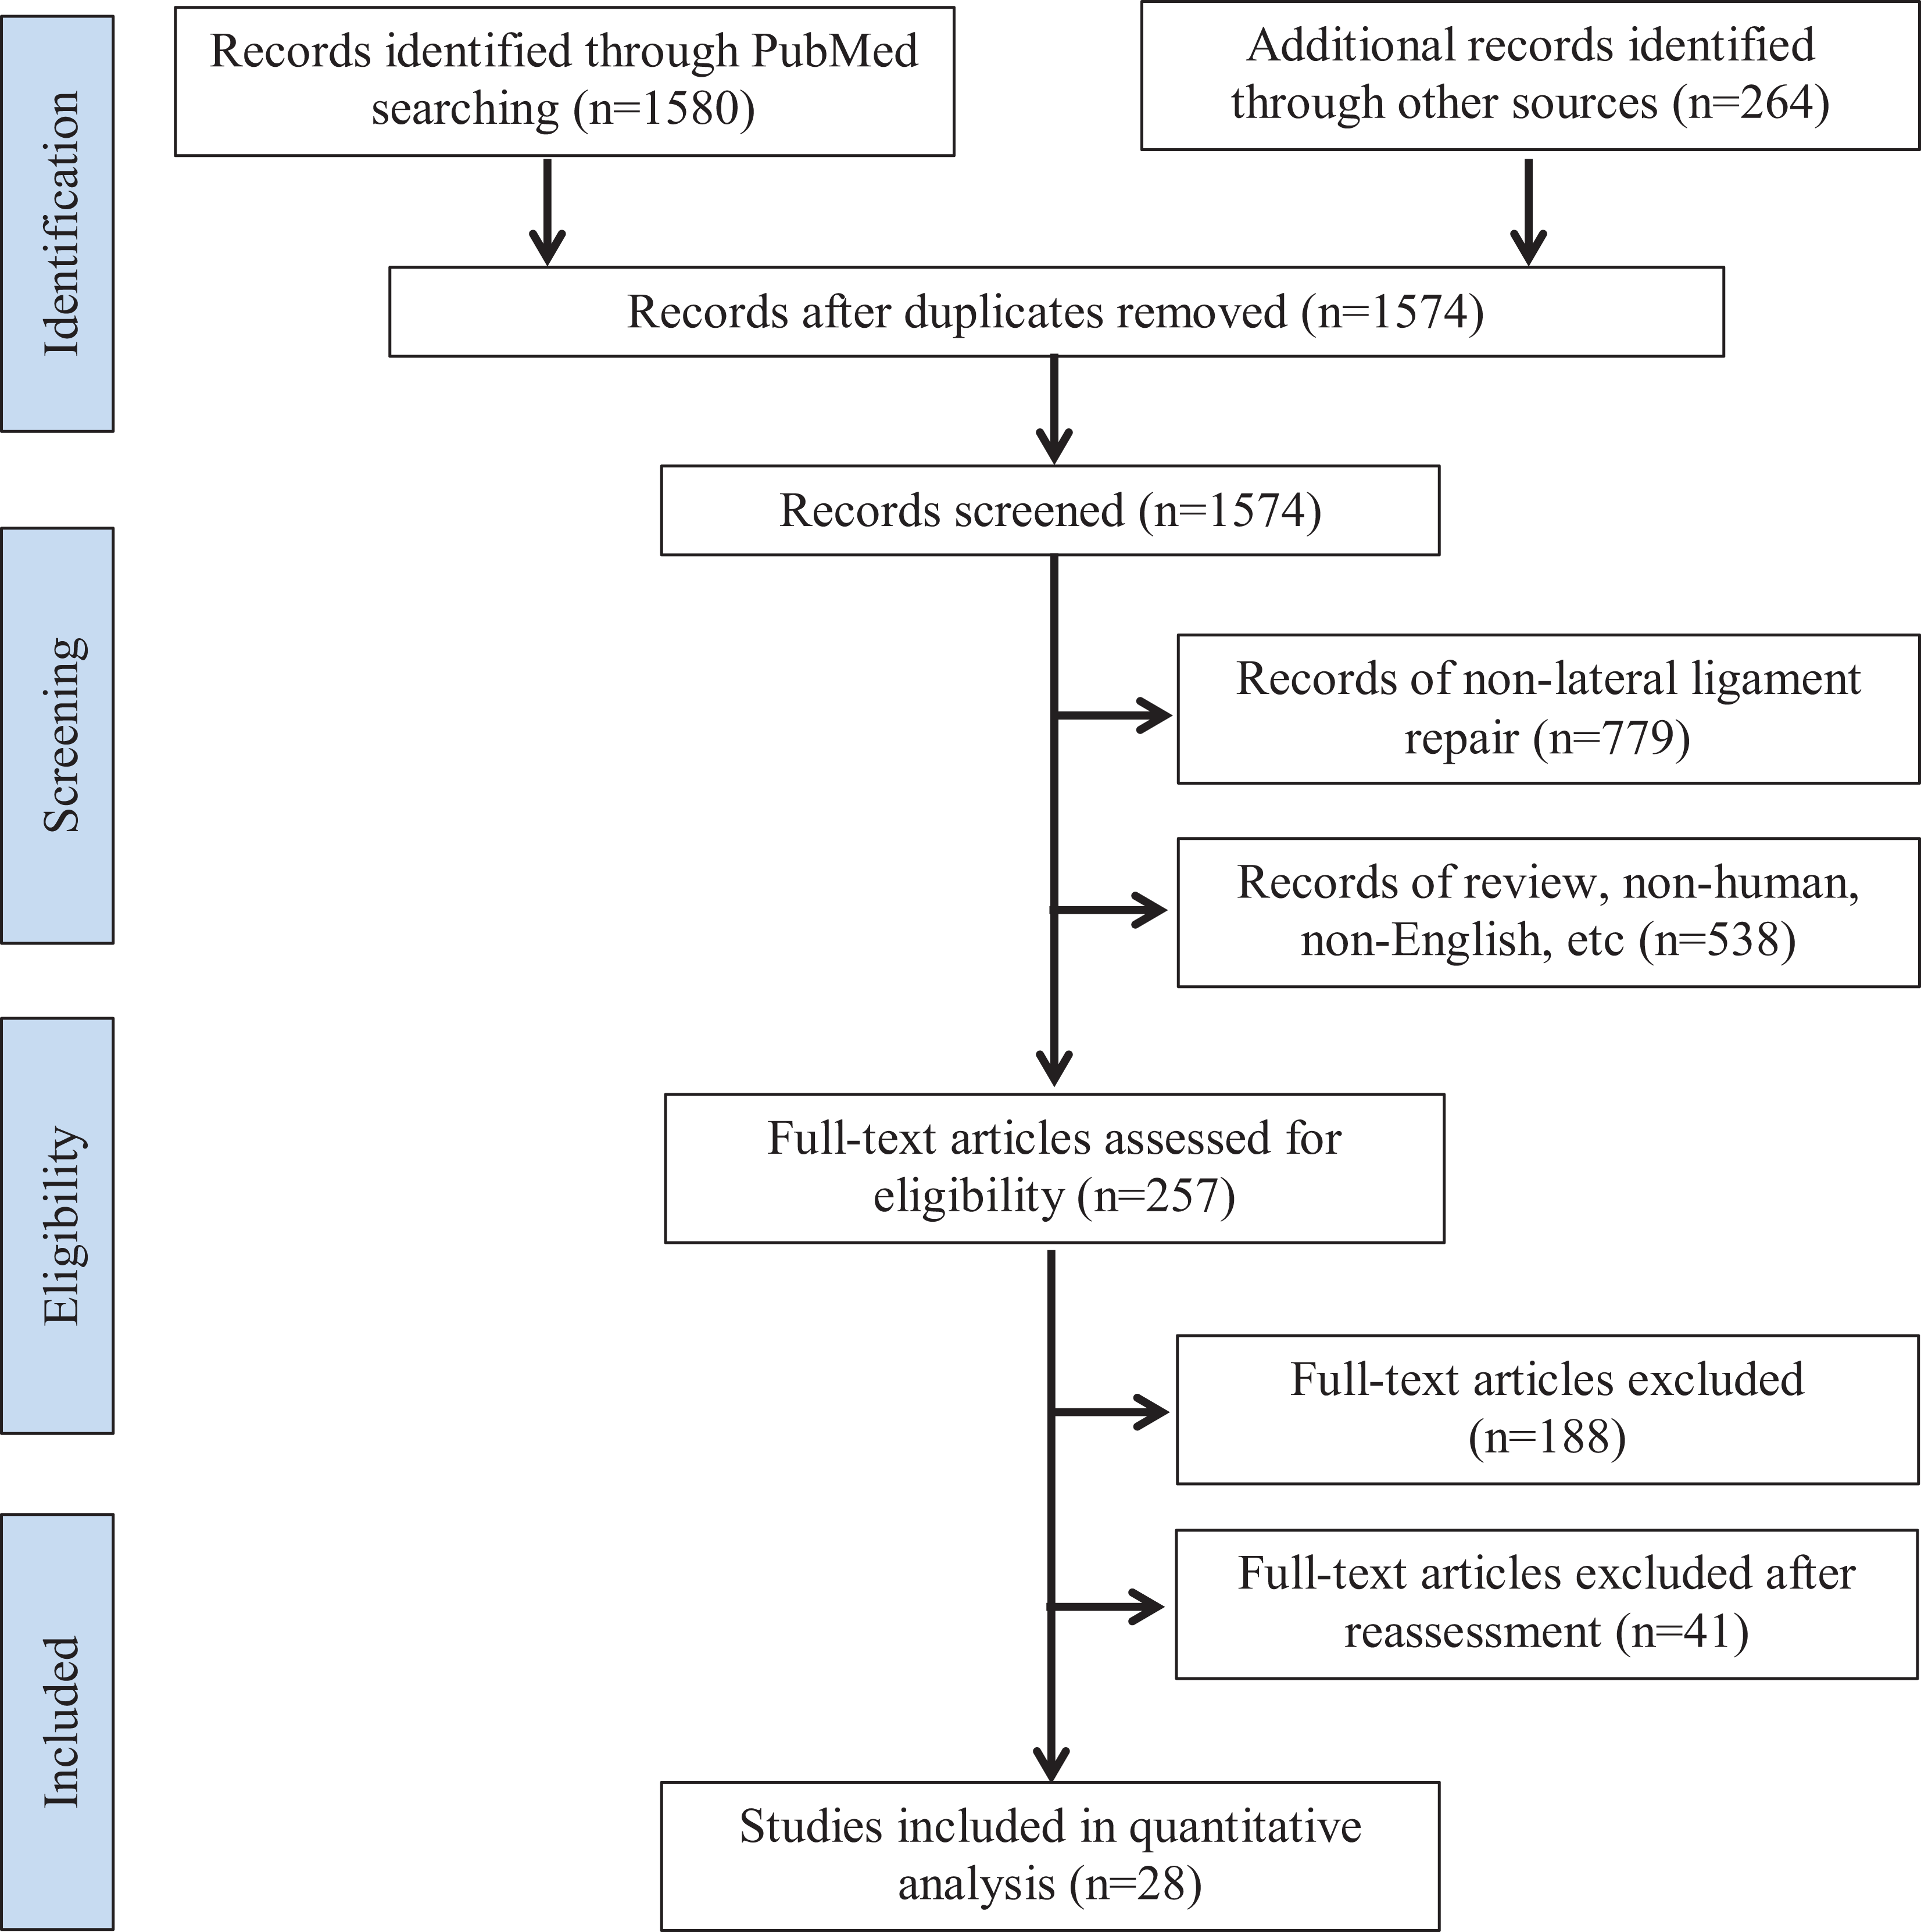
Detailed flowchart of the literature search using PRISMA (Preferred Reporting Items for Systematic Reviews and Meta-Analyses) criteria.
A total of 28 studies met the inclusion criteria, which consisted of 1469 patients undergoing primary lateral ankle ligament repair with at least a 1-year follow-up (range, 1-15 years) (Table 1). The EM group included 264 patients, while 1205 patients were in the DM group. One study evaluated EM versus DM postoperative protocols, and the 2 patient groups from the study were categorized in the appropriate group in the current review. 22
Studies Included in Analyses a

a NA, not available.
b Number of patients for sex is for both early and delayed groups.
Patient Demographics
The mean age in the DM group was 27.1 ± 3.4 versus 25.9 ± 3.7 years in the EM group; the DM group was significantly older than the EM group (P < .001), and the 95% CI of the difference was –1.73 to –0.74 (Table 1). While not all studies included mean age or sex, the DM group had 693 male and 500 female patients, with the EM group including 158 male and 87 female patients.
Quality Bias Assessment
Results from the quality bias analysis can be found in Figure 2. From our literature review, only 2 studies presented level 1 evidence. 10,22 Also, only 5 studies randomized their patient cohorts. 6,10,16,22,33 One study randomized their patient cohorts and examined EM versus DM postoperative protocols and demonstrated an overall low risk for bias. 22 The majority of studies included in our analysis were case series, which may skew our study results because of the risk of overall bias.
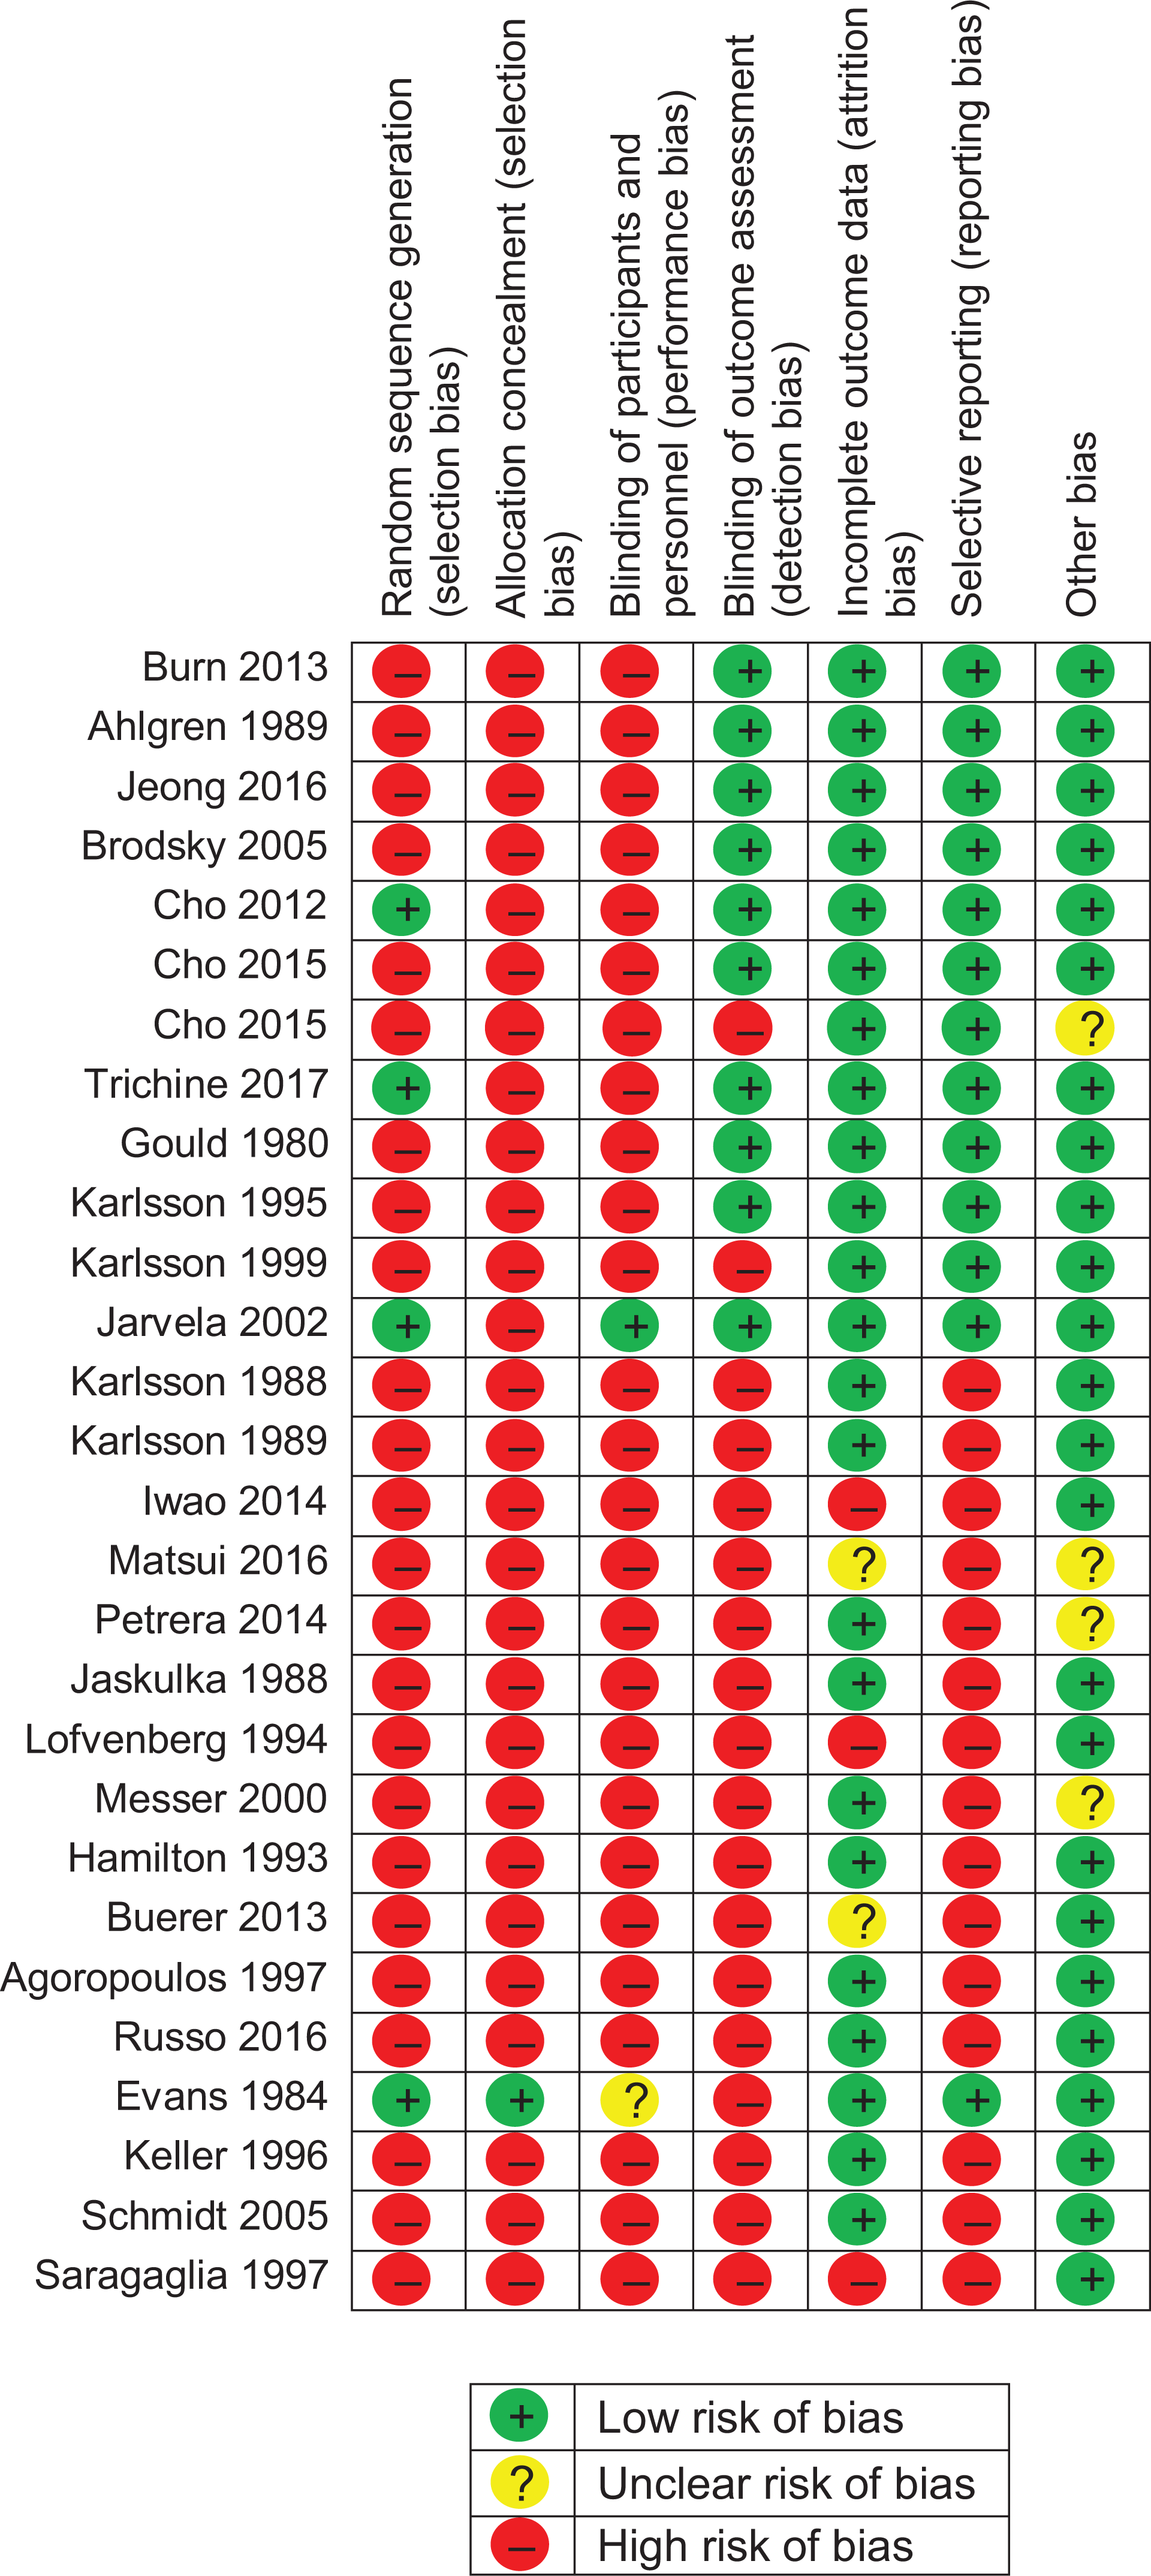
Quantitative bias analysis results for this study.
Functional Outcomes
AOFAS scores were reported in 7 studies, totaling 301 patients: 283 patients in the DM group and 18 patients in the EM group. 3 –5,18,29,33 Preoperative AOFAS scores were only recorded in 128 patients in the DM group versus 18 patients in the EM group. The mean difference in AOFAS scores from preoperatively to postoperatively for the DM group was 25.1 ± 9.2 compared with 31.2 ± 0.0 for the EM group, indicating that the EM group had a significantly greater increase in their AOFAS score from preoperatively to postoperatively compared with the DM group (P < .001; 95% CI, 4.48-7.69) (Table 2). There was a statistically significant lower postoperative AOFAS score in the DM versus EM group, with 91.9 ± 2.6 versus 98.8 ± 0.0 (P < .001; 95% CI, 6.63-7.25), respectively.
Functional and Radiographic Outcomes a

a Results are from t test. AOFAS, American Orthopaedic Foot and Ankle Society; RTS, return to sport.
b Only 1 study had reported AOFAS and Karlsson scores; therefore, the weighted SD is 0.0.
Karlsson scores were reported in 5 studies, consisting of 177 patients in the DM group versus 24 patients in the EM group. 6,8,16,26,33 Preoperative Karlsson scores were only recorded in 123 patients in the DM group versus 24 patients in the EM group. Preoperative Karlsson scores were 57.0 ± 12.7 in the DM group versus 43.5 ± 0.0 in the EM group (P < .001; 95% CI, –15.73 to –11.19). Both groups’ values saw an improvement postoperatively, with 90.0 ± 2.0 versus 92.2 ± 0.0 (P < .001; 95% CI, 1.91-2.52) in the DM and EM groups, respectively. A significant difference between the DM and EM groups was found in the improvement from preoperative to postoperative Karlsson scores, with an increase of 33.8 ± 11.7 versus 48.7 ± 0.0 (P < .001; 95% CI, 12.82-17.01), respectively.
Radiographic Outcomes
Talar tilt was recorded in 12 studies, consisting of 287 patients in the DM group versus 108 patients in the EM group. ¶ Only 277 patients had their preoperative talar tilt values recorded in the DM group and 76 patients in the EM group. Preoperative talar tilt in the DM and EM groups was found to be 12.9° ± 3.3° and 11.5° ± 2.7° (P < .001; 95% CI, –2.12 to –0.66), respectively. Both groups showed an improvement in this measurement postoperatively, with a statistically significant difference observed between the DM and EM groups: 4.5° ± 1.3° versus 5.1° ± 0.8° (P < .001; 95% CI, 0.45-0.87), respectively. Thus, in studies that reported both preoperative and postoperative talar tilt, there was a significant difference in overall improvement between preoperative and postoperative talar tilt of 8.5° ± 2.8° versus 6.8° ± 2.6° (P < .001; 95% CI, –2.43 to –1.09) in the DM and EM groups, respectively.
Anterior drawer was evaluated in 14 studies, accounting for 527 patients in the DM group and 108 patients in the EM group. # Preoperative anterior drawer values were recorded in 336 patients in the DM group and 108 patients in the EM group. Preoperative anterior drawer was measured as 9.5 ± 2.4 mm in the DM group and 10.0 ± 2.0 mm in the EM group (P = .023; 95% CI, 0.07-0.98). A significant difference was found in overall improvement between preoperative and postoperative anterior drawer for the DM and EM groups, with 5.6 ± 2.3 versus 3.7 ± 2.7 mm (P < .001; 95% CI, –1.75 to –0.61), respectively. Postoperative anterior drawer was lower in the DM group compared with the EM group: 3.9 ± 1.8 versus 6.3 ± 0.8 mm (P < .001; 95% CI, 2.17-2.60), respectively.
Return to Sport
RTS was reported in 20 studies (6 EM, 15 DM, with 1 study with both EM and DM 22 ). ** RTS was reported in 890 patients in the DM group versus 175 patients in the EM group. No significant difference was found for RTS between the 2 study groups, with the DM group returning to sport at 11.7 versus 11.2 weeks in the EM group (P = .100; 95% CI, –1.14 to 0.10).
Complications
Overall complication rates between the study groups were found to be significantly different, with 3.0% (37/1195) in the DM group versus 11.4% (30/264) in the EM group (P < .001; 95% CI, 5.0-11.5) (Tables 3 -5). Skin wound complications were the most common complication found in both the DM and EM groups. Additionally, when looking at only skin wound complications, the DM group had a significantly lower rate at 1.2% (14/1195) versus 3.8% in the EM group (10/264) (P = .005; 95% CI, 0.6-4.5). The reoperation rate was 0.3% (4/1205) versus 0.0% (0/264) in the DM and EM groups, respectively. However, because of the low number of reoperations, it was impossible to statistically analyze the reoperation rate between these 2 groups.
Complications a

a Results are from independent, 2-sample proportion z test.
Complications for Each Study

a Data are shown as n (%).
Specific Complications for Each Study

Discussion
These meta-analysis results demonstrate that lateral ankle ligament repair provided excellent functional outcomes in most patients participating in either EM or DM rehabilitation protocols. A statistically lower postoperative AOFAS score was identified in the DM group compared with the EM group (91.9 vs 98.8, respectively; P < .001). The postoperative Karlsson score was also statistically significantly lower in the DM versus EM group (90.0 vs 92.2, respectively; P < .001). However, it should be noted that there were significantly more patients in the DM group with recorded AOFAS and Karlsson scores (271 and 177 patients, respectively) versus the EM group (18 and 24 patients, respectively). However, when evaluating postoperative stability, as determined with radiographically measured anterior drawer and talar tilt, the DM group was found to have significantly greater stability on both the anterior drawer and talar tilt tests. This poses the question of whether an EM protocol would place patients at risk for increased instability clinically in the long term. Complication rates for EM were found to be significantly higher; however, within these findings were complications that could have been directly contributed to the surgical technique instead of postoperative rehabilitation. Thus, we further tried to exclude this bias by looking at only skin wound complications. Nevertheless, there was still a significantly higher skin wound complication rate in the EM group (3.8%) compared with the DM group (1.3%). This may be because an EM postoperative protocol may put more stress on the surgical incision, resulting in an increase in wound complications. Also, no difference was seen in RTS between the 2 protocols.
In a randomized study performed by Karlsson et al, 22 DM versus EM rehabilitation protocols after lateral ankle ligament repair were analyzed. In that study, DM was defined as patients who were immobilized with a short leg cast for 6 weeks. EM was defined as patients who were given an ankle brace after 7 to 10 days in plaster. Their results illustrated that patients treated with EM had no negative effects in terms of lateral ankle stability. Additionally, patients who rehabilitated with EM regained muscle strength in plantarflexion more rapidly as well as returned to sport activities sooner. 22 However, the results found in our meta-analysis suggest that patients treated with EM postoperative protocols had increased laxity on both postoperative talar tilt and anterior drawer tests. Thus, this may put patients at risk for increased postoperative instability. Moreover, this study did demonstrate that there was a low reoperation rate and higher postoperative functional scores in the EM group. Hence, this postoperative instability seen on both talar tilt and anterior drawer tests may not be clinically relevant. They also reported a similar trend in postoperative function, with our results showing that postoperative AOFAS and Karlsson scores were statistically higher in patients with EM. However, these findings are limited by the few number of patients in the EM group who had recorded AOFAS and Karlsson scores. Unlike the study of Karlsson et al 22 that found that patients treated with an EM postoperative protocol returned to sport at a median time of 10 versus 13 weeks for patients treated with a DM postoperative protocol (P < .05), we found no significant difference in RTS between EM and DM postoperative protocols (P = .100), with both groups returning to sport roughly around 12 weeks from surgery.
Even though this study did find statistically significantly greater AOFAS and Karlsson functional outcome scores for the EM protocol, both DM and EM consistently demonstrated significant improvements in both these functional outcomes, with postoperative AOFAS scores ranging from 85.0 to 92.2 and Karlsson scores ranging from 88.9 to 98.9. Thus, the question remains as to whether this is clinically significant, which may be difficult to interpret because of the limited number of patients in each group. It should also be noted that the current study did not subdivide the patient population by occupation, athletic sport, or level of competition. This could limit the clinical relevance of these findings, especially when trying to manage the patient’s expectations if he or she is either a professional or recreational athlete. Also, it should not underestimate the potential risk of increased instability that patients treated with EM rehabilitation may have in the future from their repair in terms of persistent pain and the risk of arthritis. Thus, long-term clinical studies are needed to further evaluate how this increase in instability can potentially affect outcomes for the patient later on in life.
Several limitations are inherent to our study. One limitation is the heterogeneous distribution of patients analyzed in the DM versus EM arm (21 studies with DM vs 8 studies with EM), which could skew our results. Thus, this resulted in fewer patients in the EM versus DM group. An additional limitation is that outcome measures were not standardized across included studies, which limits the statistical conclusions that can be derived by our study. It should also be noted that our meta-analysis had only 2 randomized controlled studies that looked directly at postoperative mobilization after lateral ankle ligament repair, thus limiting the level of evidence for our study. Moreover, the patient demographics for both age and sex distribution were not equal between the 2 groups, which could be another confounding factor in our results. Additionally, our study found no difference in RTS between the DM and EM groups; however, the type of sport played was not recorded. Hence, this also could limit this finding derived from our analysis.
Varying surgical repair techniques further limited the ability to directly compare the 2 groups. Other possible modifications of the Brostrom technique include the Gould modification and use of suture anchors, among other techniques. Additionally, we did not separate open versus arthroscopic techniques, whereas the meta-analysis by Guelfi et al 12 found that this can influence patients’ outcomes in primary lateral ankle ligament repair. Our meta-analysis excluded any study that included patients with a chondral injury; however, as stated previously, not every study included diagnostic arthroscopic surgery. Thus, there is the potential that patients with an undiagnosed chondral injury may have been included in the final analysis, which could be another additional confounding component to our results. Also, our study excluded patients who underwent revision surgery. However, our study did not differentiate patients who underwent repair for an acute versus chronic injury, thus resulting in another potential confounding component to our results. Furthermore, as previously stated, our results demonstrated an increase in postoperative instability in the EM group in terms of the anterior drawer and talar tilt tests. However, long-term studies are needed to see if this correlates to late degenerative changes. Finally, even though we made a generalization in the classification between EM and DM groups, there was variability in the postoperative protocols within each category with no standardization. Thus, this study makes the assumption that protocols were similar in each group. Further studies are needed to elucidate the differences between rehabilitation protocols in patients who undergo lateral ankle ligament repair with standardized outcomes to draw a more accurate conclusion. Additionally, future studies need to compare primary surgical repair techniques with additional surgical techniques, such as suture tape augmentation, anatomic allograft reconstruction, and arthroscopic techniques.
Conclusion
Patients with EM postoperative protocols demonstrated improved functional outcomes; however, the EM group had increased objective laxity and a higher complication rate. Future randomized studies are needed to definitively evaluate early versus delayed rehabilitation protocol timetables to optimize functional outcomes without compromising long-term stability.
Footnotes
Final revision submitted January 7, 2020; accepted January 29, 2020.
One or more of the authors has declared the following potential conflict of interest or source of funding: M.L.V. has received educational support from DePuy and Titan Surgical Group and hospitality payments from Stryker and Zimmer Biomet. B.M. has received educational support from Zimmer Biomet. S.M. has received grant support from DePuy, educational support from Arthrex, and hospitality payments from Stryker and Zimmer Biomet. J.P.S. has received educational support from Arthrex and Titan Surgical Group and hospitality payments from Arthrex. B.G.V. has received consulting fees and grant support from DePuy, educational support from Smith & Nephew and Titan Surgical Group, and hospitality payments from Smith & Nephew. AOSSM checks author disclosures against the Open Payments Database (OPD). AOSSM has not conducted an independent investigation on the OPD and disclaims any liability or responsibility relating thereto.