
Abstract
Background:
Many imaging techniques have been developed for the detection of rotator cuff tears (RCTs). Despite numerous quantitative diagnostic studies, their relative accuracy remains inconclusive.
Purpose:
To determine which of 3 commonly used imaging modalities is optimal for the diagnosis of RCTs.
Study Design:
Systematic review; Level of evidence, 4.
Methods:
Studies evaluating the performance of magnetic resonance imaging (MRI), magnetic resonance arthrography (MRA), and ultrasound (US) used in the detection of RCTs were retrieved from the PubMed/MEDLINE and Embase databases. Diagnostic data were extracted from articles that met the inclusion/exclusion criteria. A network meta-analysis was performed using an arm-based model to pool the absolute sensitivity and specificity, relative sensitivity and specificity, and diagnostic odds ratio as well as the superiority index for ranking the probability of these techniques.
Results:
A total of 144 studies involving 14,059 patients (14,212 shoulders) were included in this network meta-analysis. For the detection of full-thickness (FT) tears, partial-thickness (PT) tears, or any tear, MRA had the highest sensitivity, specificity, and superiority index. For the detection of any tear, MRI had better performance than US (sensitivity: 0.84 vs 0.81, specificity: 0.86 vs 0.82, and superiority index: 0.98 vs 0.22, respectively). With regard to FT tears, MRI had a higher sensitivity and superiority index than US (0.91 vs 0.87 and 0.67 vs 0.28, respectively) and a similar specificity (0.88 vs 0.88, respectively). The results for PT tears were similar to the detection of FT tears. A sensitivity analysis was performed by removing studies involving only 1 arm for FT tears, PT tears, or any tear, and the results remained stable.
Conclusion:
This network meta-analysis of diagnostic tests revealed that high-field MRA had the highest diagnostic value for detecting any tear, followed by low-field MRA, high-field MRI, high-frequency US, low-field MRI, and low-frequency US. These findings can help guide clinicians in deciding on the appropriate imaging modality.
A rotator cuff tear (RCT) is a common source of shoulder pain and disability. Early diagnosis can help determine the treatment strategy to best prevent further loss of function. 9,14,41 Imaging, along with physical examinations and clinical history, provides vital information for diagnosis 55 and possible surgical interventions. 110 Imaging modalities commonly used for the detection of RCTs include magnetic resonance imaging (MRI), magnetic resonance arthrography (MRA), and ultrasound (US).
The finding of a full-thickness (FT) tear is a strong indication for surgical intervention. 95,158 MRA utilizing a contrast agent has high diagnostic accuracy for detecting FT tears, and some authors have even used it as the reference standard when comparing imaging modalities. 44 However, the combination of patient characteristics, history, and clinical shoulder tests for the diagnosis of FT tears could improve the ability of MRI, 171 and a meta-analysis confirmed that 3.0-T MRI appeared equivalent to 3.0-T MRA. 96
In recent years, technological advances in arthroscopic shoulder surgery have made the surgical management of partial-thickness (PT) tears much less invasive and thereby more cost-effective. Consequently, the identification of a PT tear has become more meaningful. 25,95 The diagnostic accuracy of MRI and MRA for PT tears is similar, and because MRA is an invasive modality, MRI is routinely used as the first-choice imaging option. 25,40,60,141
The initial results of US in the detection of RCTs varied, probably because of low-frequency transducers and limited examiner experience. 11,111,142 However, as US technology continues to advance, the advantages of US, including its low cost and capability for real-time dynamic assessments, become more evident. 189 US is still not as widely used in clinical practice as it could be, both because of its steep learning curve and the uncertainty regarding its diagnostic accuracy. 15 Therefore, a synthesis of the literature is warranted to compare the accuracy of US with MRI and MRA.
Several traditional meta-analyses have been published on the accuracy of medical imaging for the detection of RCTs 34,80,96,135,149,163 ; however, their relative accuracy remains inconclusive, which may be because a traditional meta-analysis allows only for comparisons between 2 diagnostic tests. If multiple modalities are assessed simultaneously, a traditional meta-analysis only compares directly the numerical value of sensitivity and specificity, which, while still informative, is not rigorous or ideal. 177 Recently, Nyaga et al 115 developed a Bayesian network meta-analysis using an arm-based model based on the assumption that the missing arms occur at random. This method has been applied in several studies 50,118 because it not only allows analysis of the variability in the accuracy of multiple tests within and between studies simultaneously but also provides more natural variance-covariance matrix structures, making it more appealing than either a traditional meta-analysis or the contrast-based network meta-analysis model introduced by Menten and Lesaffre. 99
The purpose of this study was to compare the diagnostic accuracy of 3 imaging techniques (US, MRI, and MRA) for the diagnosis of RCTs using an arm-based model of a network meta-analysis based on multiple diagnostic tests. The hypothesis was that MRI was equal to US in the diagnosis of RCTs.
Methods
This network meta-analysis was conducted in accordance with the PRISMA (Preferred Reporting Items for Systematic Reviews and Meta-Analyses) statement (PROSPERO identifier: CRD42018118538) and the PRISMA-DTA (Preferred Reporting Items for a Systematic Review and Meta-Analysis of Diagnostic Test Accuracy Studies) statement. 97
Search Strategy
A comprehensive literature search of 2 electronic databases, PubMed/MEDLINE and Embase, was performed. An initial search was made using the following keywords: “systematic review” or “meta-analysis” AND “rotator cuff.” The full text of every article listed in the references of each identified systematic review or meta-analysis was procured. A second search was performed using the following keywords: “diagnostic,” “diagnostic imaging,” “diagnostic test,” or “diagnosis” AND “ultrasound,” “ultrasonography,” “US,” “MRI,” “magnetic resonance imaging,” “MRA,” or “magnetic resonance arthrography” AND “rotator cuff,” “supraspinatus,” “infraspinatus,” “subscapularis,” “labrum,” “shoulder joint,” “subacromial impingement,” “tendinopathy,” “shoulder,” “shoulder pain,” “shoulder impingement syndrome,” or “bursitis.” The search was limited to the English language, and the search date was from database inception to August 31, 2018.
Inclusion and Exclusion Criteria
The inclusion criteria were studies that (1) involved human patients; (2) assessed the diagnostic performance of imaging modalities for RCTs; (3) provided raw data to calculate diagnostic parameters, including the true positive, false positive, false negative, and true negative; and (4) included a surgical (open or arthroscopic) reference standard, that is, surgical findings to prove/disprove the imaging findings.
The exclusion criteria were the following: (1) commentaries, letters, case reports, reviews, or congress proceedings; (2) studies involving animal and cadaveric experiments; (3) studies providing insufficient data to calculate diagnostic parameters; and (4) non–English language studies.
Data Extraction
The following information was extracted from each study: the first author’s surname, publication year, country of origin, participant characteristics (number, age, and sex), study design, reference standard (arthroscopic or open surgery), time from MRI/MRA to reference standard, blinding, number of readers, readers’ experience, final diagnoses of included patients, muscle tendon involved, tear site, clinical findings of the shoulder, technical parameters of MRA (administration of contrast agent [intravenous: indirect or intra-articular: direct], vendor, model, magnetic strength, method, sequence, slice thickness, analyzed image plane), technical parameters of MRI (vendor, model, magnetic strength, sequence, slice thickness, analyzed image plane), technical parameters of US (vendor, transducer specifications), and diagnostic data (true positive, false positive, true negative, and false negative). If the studies had ≥2 modalities and permitted multiple comparisons, all the information and outcomes of interest were extracted. If ≥2 readers evaluated a diagnostic test in a single study, we calculated the mean average of the diagnostic data.
Risk of Bias
The risk of bias for the included trials was assessed independently by 2 researchers (F.L. and F.X.) utilizing QUADAS-2, 181 a quality assessment tool for diagnostic accuracy studies. This system is composed of 11 items, and each item is graded as yes, unclear, or no.
Statistical Analysis
The whole process of searching, filtering, data extraction, and quality assessment was implemented by 2 researchers (F.L. and F.X.) independently and repeatedly. For any discrepancy, a consensus was reached by discussion with a third researcher (J.D.).
A Bayesian network meta-analysis using an arm-based model, developed by Nyaga et al, 115 was performed by running 3 chains in parallel until there was convergence. Trace plots were used to visually check whether the distributions of the 3 simulated chains mixed properly and were stationary. We used the potential scale reduction factor, the effective number of independent simulation draws, and the Markov chain Monte Carlo error to assess convergence. To assess the relative performance of the reviewed diagnostic tests, the definitions of superior, inferior, equal, and not comparable were drawn. A diagnostic test that is pairwise superior to a relatively large number of other tests and pairwise inferior to a relatively small number of other tests should have a high superiority value and be ranked higher than those tests that do not perform as well. In this study, the superiority index was pooled to quantify rank probabilities of each diagnostic test. All network meta-analyses were performed using R (Version 3.4.3; Comprehensive R Archive Network), package rstan (Version 2.17.3), package loo (Version 2.0.0), and package plyr. Sensitivity analyses for the detection of FT tears, PT tears, and any tear were implemented according to at least 2 arm-based tests. Subgroup analyses were performed based on the different tendons injured, gold standard (arthroscopic or open surgery), study design, QUADAS-2 score, and publication year.
Results
Studies Retrieved and Characteristics
A selection flowchart for the studies chosen is presented in Figure 1. After comprehensive searching of 2 electronic databases, excluding duplicate records, screening remaining titles and abstracts, and identifying related full text, a total of 144 studies involving 14,059 patients (14,212 shoulders) were included in this network meta-analysis. The pooled characteristics are presented in Table 1.
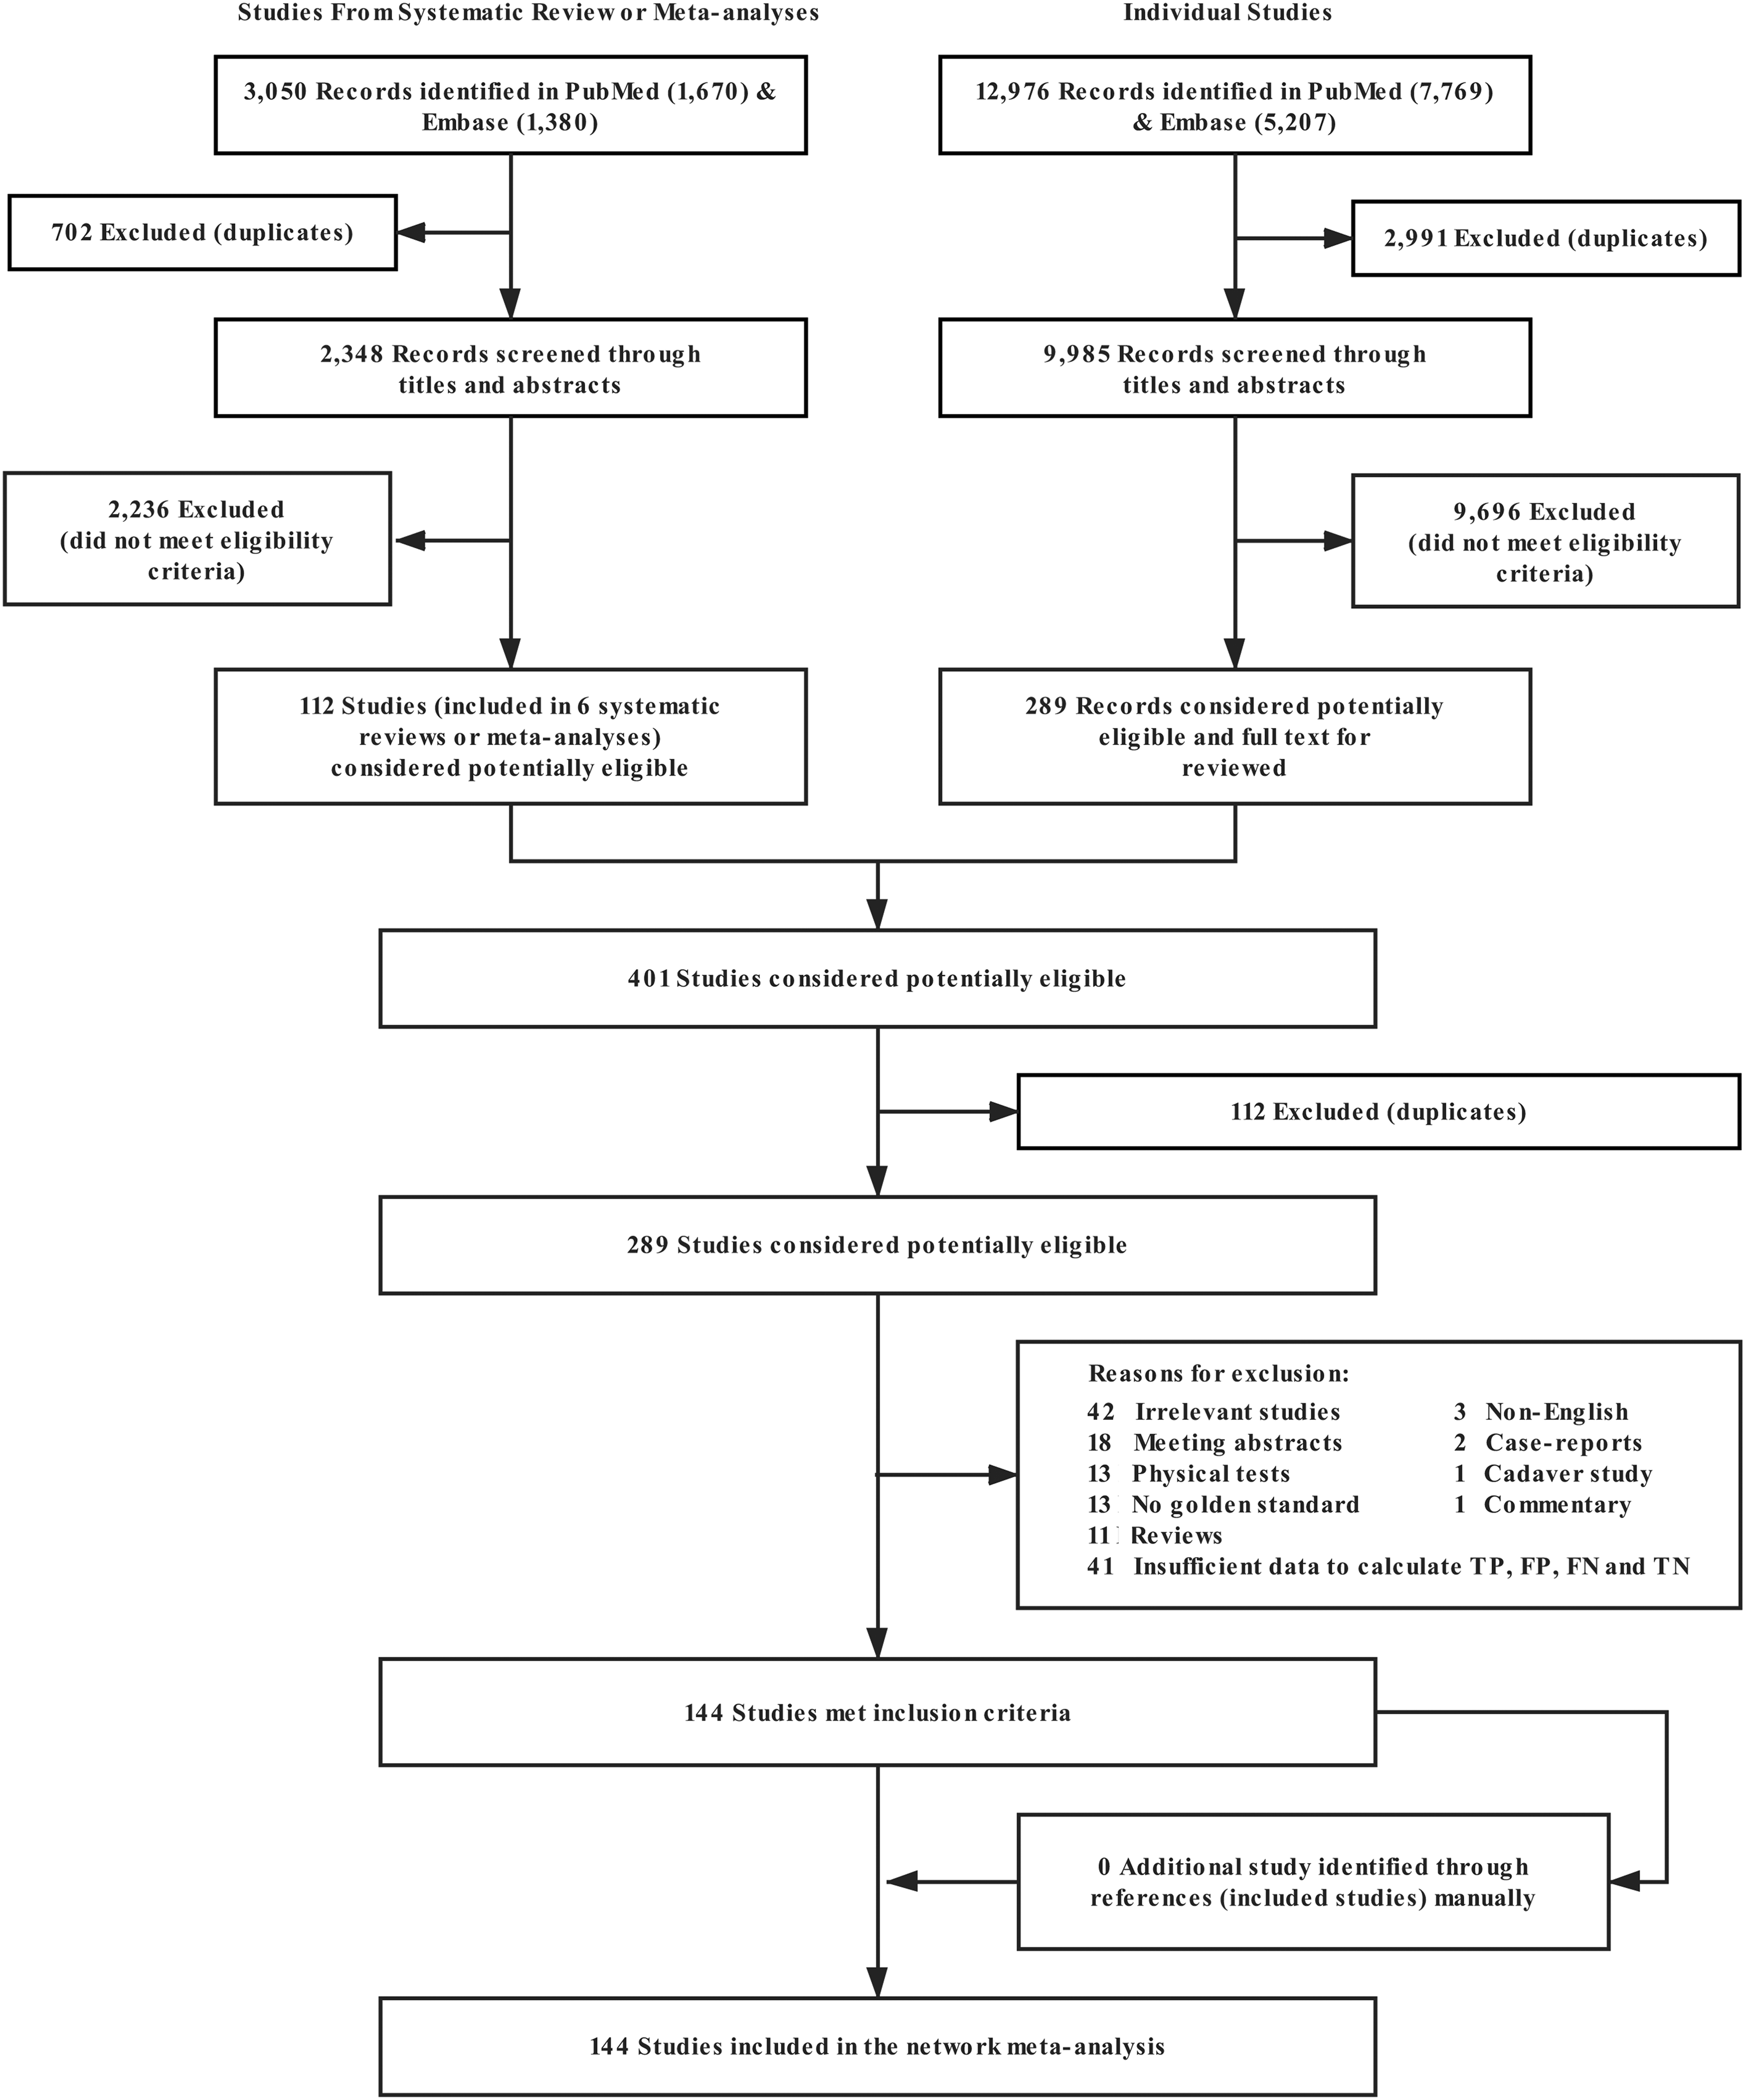
Selection flowchart for studies included in the network meta-analysis. FN, false negative; FP, false positive; TN, true negative; TP, true positive.
Studies Included in Network Meta-analysis (N = 144) a

a 2D, 2-dimensional; 3D, 3-dimensional; FT, full-thickness; MRA, magnetic resonance arthrography; MRI, magnetic resonance imaging; PT, partial-thickness; US, ultrasound.
Data Extraction and Quality Assessment
Appendix Table A1 presents the detailed QUADAS-2 score results from each included study.
Comparison of MRA, MRI, and US
For the detection of FT tears, PT tears, or any tear, MRA had the highest sensitivity, specificity, and superiority index. For the detection of any tear, MRI had a better diagnostic value than US (sensitivity: 0.84 vs 0.81, specificity: 0.86 vs 0.82, and superiority index: 0.98 vs 0.22, respectively). With regard to FT tears, MRI had a higher sensitivity and superiority index than US (0.91 vs 0.87 and 0.67 vs 0.28, respectively) and a similar specificity (0.88 vs 0.88, respectively). The results for PT tears were similar to the detection of FT tears (Figure 2 and Table 2).
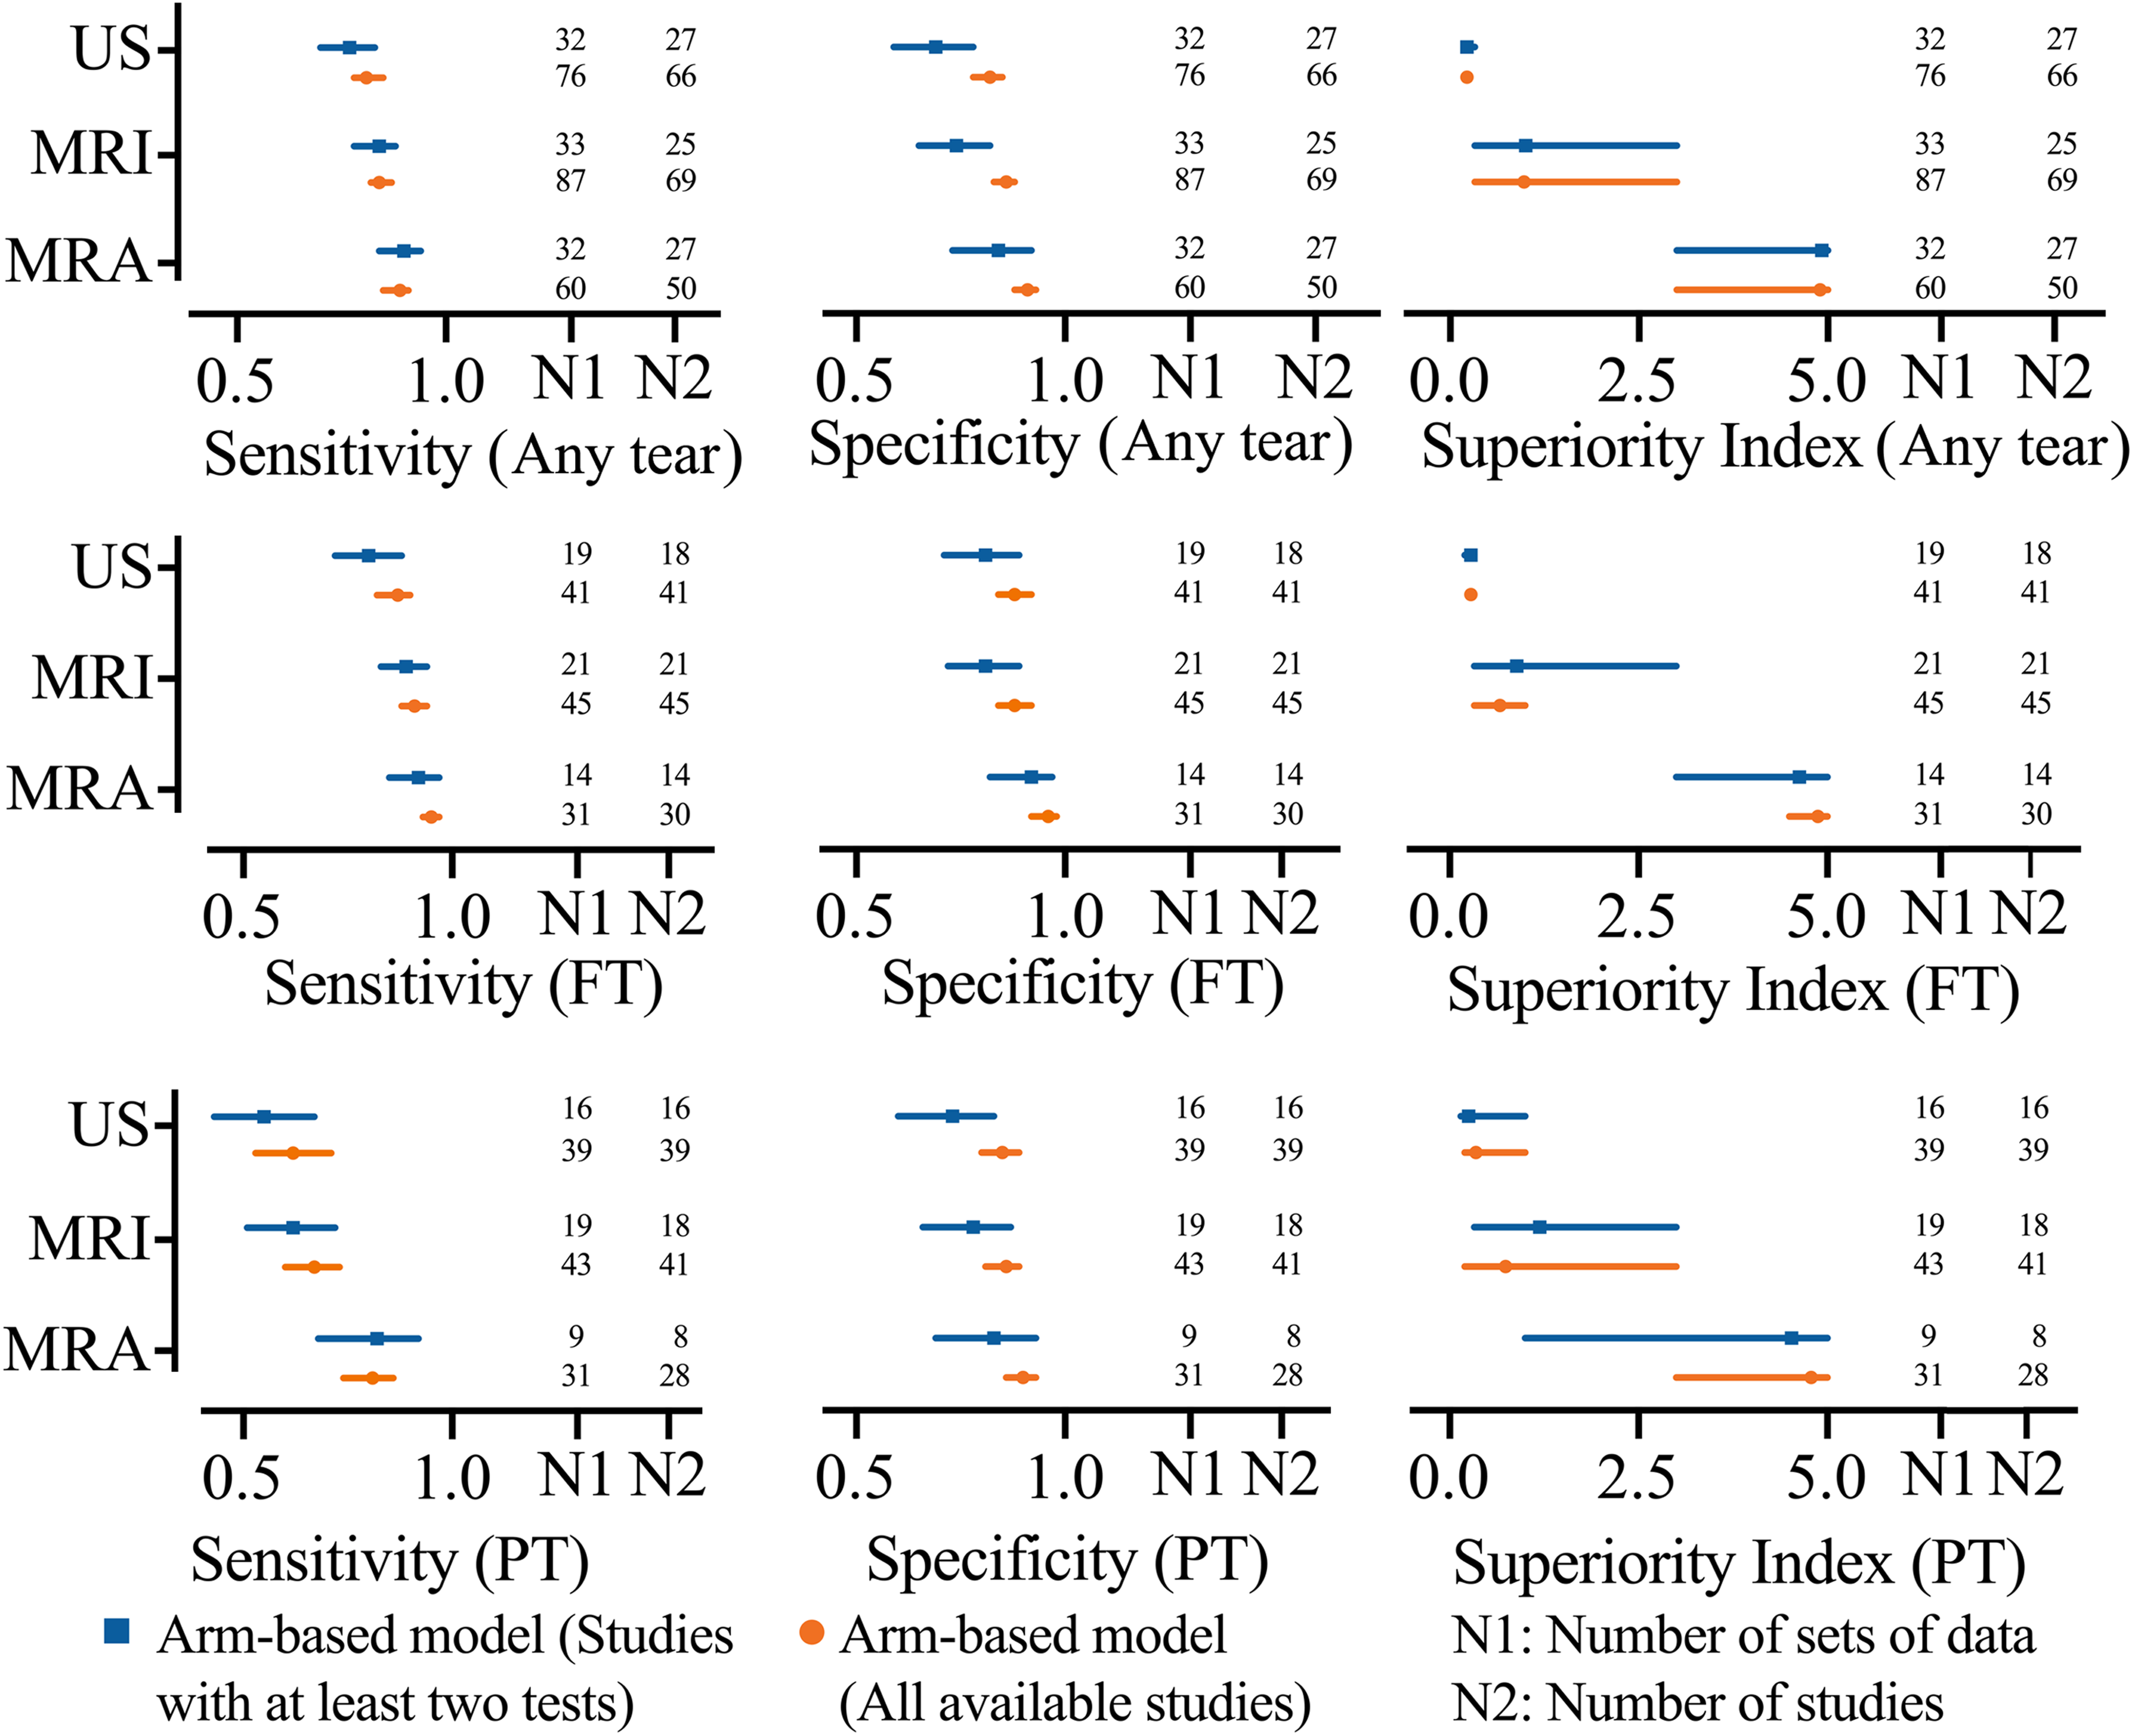
Network meta-analysis results including sensitivity, specificity, and superiority index values of imaging methods for the detection of rotator cuff tears. FT, full-thickness tear; MRA, magnetic resonance arthrography; MRI, magnetic resonance imaging; PT, partial-thickness tear; US, ultrasound.
Comparison of MRA, MRI, and US a

a Data are reported as mean (95% CI) unless otherwise indicated. FT, full-thickness; MRA, magnetic resonance arthrography; MRI, magnetic resonance imaging; PT, partial-thickness; US, ultrasound.
High- or Low-field MRA, High- or Low-field MRI, and High- or Low-frequency US
For the detection of FT tears, the diagnostic value rank (from high to low) of these 6 imaging modalities was 3.0-T MRA, 1.5-T MRA, 3.0-T MRI, ≥7.5-MHz US, 1.5-T MRI, and <7.5-MHz US (superiority index: 8.66 vs 4.73 vs 2.21 vs 0.88 vs 0.64 vs 0.14, respectively). For the detection of PT tears, the diagnostic value rank (from high to low) was 3.0-T MRA, 3.0-T MRI, 1.5-T MRA, ≥7.5-MHz US, 1.5-T MRI, and <7.5-MHz US (superiority index: 8.15 vs 5.25 vs 2.44 vs 0.95 vs 0.35 vs 0.18, respectively). For the detection of any tear, the diagnostic value rank (from high to low) was 3.0-T MRA, 1.5-T MRA, 3.0-T MRI, ≥7.5-MHz US, 1.5-T MRI, and <7.5-MHz US (superiority index: 5.85 vs 5.36 vs 2.71 vs 1.39 vs 0.83 vs 0.16, respectively) (Figure 3 and Table 3). A sensitivity analysis was performed by removing studies involving only 1 arm for FT tears, PT tears, or any tear, and the results remained stable.
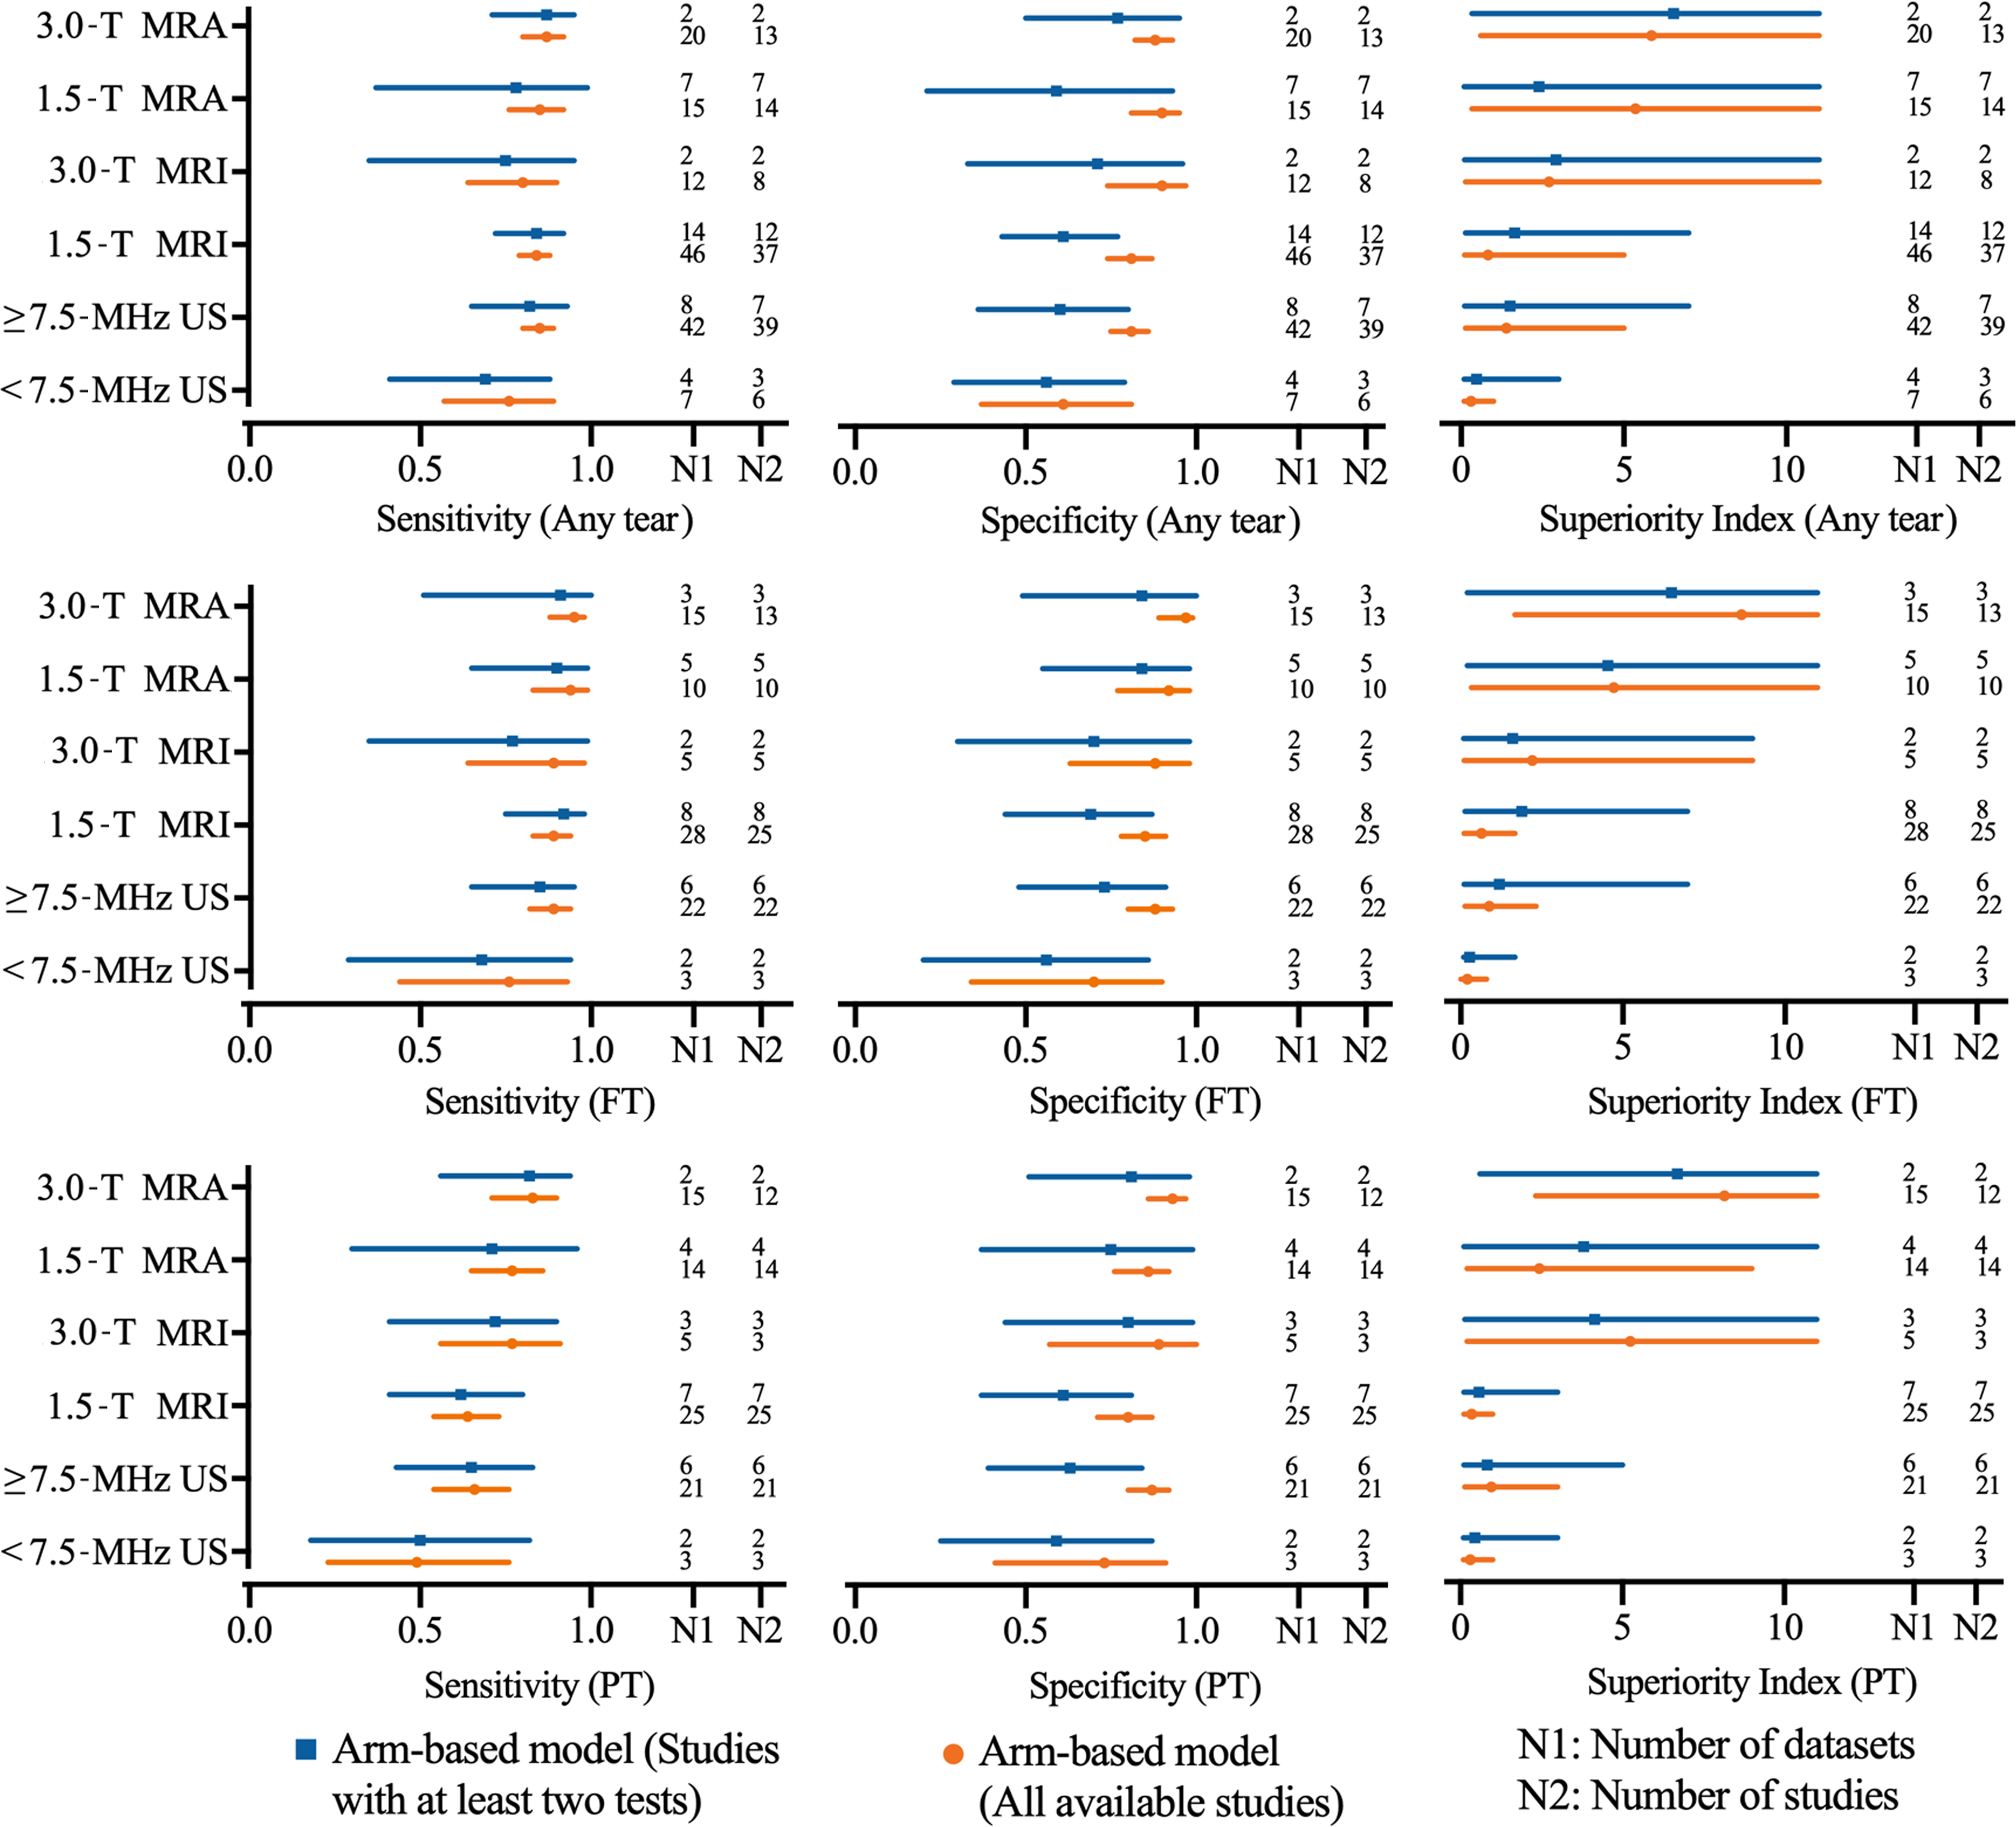
Network meta-analysis results including sensitivity, specificity, and superiority index values of high- or low-field MRA, high- or low-field MRI, and high- or low-frequency US for the detection of rotator cuff tears. FT, full-thickness tear; MRA, magnetic resonance arthrography; MRI, magnetic resonance imaging; PT, partial-thickness tear; US, ultrasound.
Comparison of High- or Low-field MRA, High- or Low-field MRI, and High- or Low-frequency US a

a Data are reported as mean (range) unless otherwise indicated. FT, full-thickness; MRA, magnetic resonance arthrography; MRI, magnetic resonance imaging; PT, partial-thickness; US, ultrasound.
Effect of Publication Year on US Accuracy
The stated diagnostic accuracy of US in articles published between 2016 and 2018 was higher than that in articles published between 2011 and 2015 for FT tears (sensitivity: 0.72 vs 0.77, specificity: 0.85 vs 0.75, and superiority index: 1.49 vs 1.10, respectively), PT tears (sensitivity: 0.60 vs 0.61, specificity: 0.82 vs 0.72, and superiority index: 1.72 vs 0.95, respectively), or any tear (sensitivity: 0.71 vs 0.80, specificity: 0.77 vs 0.67, and superiority index: 1.29 vs 1.19, respectively).
Other Subgroup Analyses
In other analyses, 3-dimensional MRA appeared equivalent to 2-dimensional MRA in the diagnosis of any tear (sensitivity: 0.88 vs 0.87, specificity: 0.89 vs 0.88, and superiority index: 1.86 vs 0.89, respectively), although there was a trend toward greater accuracy in the diagnosis of FT tears. Meanwhile, the accuracy of direct MRA in the diagnosis of any tear was higher than that of indirect MRA (sensitivity: 0.88 vs 0.86, specificity: 0.93 vs 0.86, and superiority index: 2.18 vs 0.63, respectively).
Other subgroup analyses for FT tears, PT tears, and any tear based on the different muscles involved (supraspinatus, subscapularis, infraspinatus, supraspinatus-subscapularis, supraspinatus-infraspinatus, and subscapularis-infraspinatus) (Appendix Table A2), study design (prospective or retrospective) (Appendix Table A3), QUADAS-2 score (7, 8, 9, 10, or 11) (Appendix Table A4), publication year (2000-2019) (Appendix Table A5), and gold standard (arthroscopic surgery) (Appendix Table A6) suggested a similar direction and magnitude of effect for studies investigating the diagnostic value.
Discussion
An RCT is one of the most common causes of shoulder pain and disability. 18,55 Yamamoto et al 186 found that 20.7% of 1366 shoulders had FT RCTs in a Japanese mountain village population. Whether to proceed to arthroscopic or open surgery for RCTs depends not only on clinical findings but also on imaging results; additionally, findings during surgery are largely affected by the availability of imaging reports. 178 The diagnostic accuracy and effective use of imaging technology are major concerns for clinicians and patients. Therefore, it is essential to compare the accuracy of MRA, MRI, and US in the diagnosis of RCTs and analyze their advantages and disadvantages under various conditions.
It has long been debated whether to inject contrast agents when using MRI for the detection of RCTs. With regard to lesions of the glenoid labrum and labral capsular ligamentous complex, MRA is thought to be the most accurate. 7,19,71,94,125,144 The anatomic resolution is good, subtle defects can be depicted by contrast material, and leakage of contrast agents is usually evident, thus enhancing the diagnostic accuracy of FT tears. 26,60,68,120 We found that MRA was also the most accurate method for detecting RCTs regardless of type (FT or PT tear). However, the injection of a contrast agent is an invasive procedure, infections and adverse reactions occur, 44 and the examination time is longer. 53 The accuracy of MRA is affected by the classification and basic properties of the contrast agent; as a result, the sensitivity and specificity were improved only by 3% to 4% when compared with plain MRI. 27 False positive results due to the inflamed tendon showing high intensity, 5,53 leakage through the postoperative incompletely healed tendon, 30 and false negative results due to the failure of contrast to pass into the bursa can lower the sensitivity, specificity, and accuracy of MRA. 25,88 Moreover, in clinical practice, doctors and radiologists make the diagnosis based on a combination of medical history, physical examination, and imaging findings, unlike in a research project, during which the investigator is deliberately blinded to the clinical findings. The differences in specificity and sensitivity between MRA and MRI are quite small, and that may be a good reason to avoid the potential risk/cost of MRA, especially if one suspects an FT tear.
A PT tear is a source of surgically treatable shoulder pain, and it may deteriorate into an FT tear; therefore, the identification and surgical repair of PT tears have recently gained attention. 25 Our meta-analysis shows that MRI had a similar sensitivity to MRA in the diagnosis of bursal-side PT tears (0.73 vs 0.75, respectively). It seems not all that beneficial to inject contrast agents when using MRI for the detection of RCTs. However, technological innovations, such as using fat-suppression sequences to distinguish fat from contrast agents 169 and using intravascular injections to achieve delineation of the bursal-side PT tears, 57,168 make MRA still valuable under specific circumstances in which US and MRI are not definitive. 34,154
MRI and US are currently regarded as the modalities of choice for the noninvasive diagnosis of rotator cuff lesions. 6,12,60,114,132,161 MRI excels in localizing and defining the extent of the RCT, which is critical for diagnosis and for guiding treatment decisions. 137,162 US provides a dynamic assessment of the shoulder, but it is sometimes impossible to achieve full visualization of the entire rotator cuff in patients with restricted range of motion, 130 which may reduce its accuracy. MRI has been shown to be a reproducible method, with low observer variability, 6,138 as opposed to US, which is considered the most operator-dependent imaging technique in the detection of shoulder disease. 95,101 Another barrier to the widespread use of US is the steep learning curve. 101,112,136 Murphy et al 110 reported that 300 scans are required under the supervision of an experienced musculoskeletal ultrasonographer to become adept, which is not feasible for most clinicians. On the positive side, US allows patient-clinician interactions and real-time feedback 101,112 and provides opportunities for patients to point out symptomatic areas. 111 There are no contraindications and no artifacts from metal implants, making it the first choice in patients with pacemakers and in postoperative evaluations. 30,85,129
Low cost has always been an advantage of US. Roy et al 135 recommended US as the best option for the detection of FT tears, when considering economic benefits and safety, even though MRI is more accurate. In 2014, Voigt et al 175 reported that false positive and false negative MRI findings in the diagnosis of RCTs resulted in an unnecessary cost of $210 million in the United States. However, Gyftopoulos et al, 55 focusing on the detection of FT tears, performed a cost-effectiveness analysis and found MRI to be the preferred imaging strategy rather than US. While taking all types of musculoskeletal disorders into consideration, Bureau and Ziegler 15 recommended US as the primary tool to detect RCTs because of its comparable accuracy and high cost-efficiency compared with MRI.
Since the normal rotator cuff anatomy on US was first described by Middleton et al 100 in 1984, the technical limitations of US have always been an issue. Nowadays, technical advancements, such as the linear array broad-bandwidth transducers, 66,162 and the establishment of a standardized imaging protocol 29 have increased the accuracy and reliability of US. Our subgroup analysis based on the publication year found that the newer machines did provide better diagnoses of RCTs. Similarly, the technological innovations in MRI have improved its diagnostic ability. Additionally, the higher accuracy based on MRI and US may be related to the improved ability to diagnose RCTs intraoperatively. Our subgroup analyses based on MRI and US parameters demonstrated that ≥7.5-MHz US is superior to 1.5-T MRI in the detection of FT tears, PT tears, or any tear, although it is inferior to 3.0-T MRI. The differences in specificity and sensitivity between MRI and high-frequency US were quite small, and that may be a good reason to avoid the potential cost of MRI. However, in making final decisions, the available equipment (parameters of MRI and US) and examiner experience should also be taken into consideration.
We acknowledge several limitations in this network meta-analysis. We assessed the diagnostic value of the imaging modalities alone. The roles of patient history and physical examination results were not evaluated. Real-life situations, such as MRI with physical tests and US with physical tests, were not analyzed side by side. Several subgroup analyses, such as specific tendon-based analyses, were implemented based on insufficient data, which makes the results open to question. Insufficient data also made it impossible to conduct several subgroup analyses, including the diagnostic value of 3 imaging modalities for different types of partial tears, such as superficial tears, partial articular supraspinatus tendon avulsion lesions, or interstitial tears. Unfortunately, many other imaging diagnostic measures could not be included in our analysis because of the limited number of studies; these included arthro–computed tomography, which is considered by some surgeons to be the gold standard for diagnosing FT RCTs, and standard radiography, which is regarded as the first choice for the diagnosis of shoulder pain. Additionally, the diagnostic ability of these imaging modalities in evaluating rotator cuff repair postoperatively was not studied. Future advances in MRI and US technology will likely render the conclusions of older studies, and their derivative meta-analyses, out of date. Most surgeons are already using MRI to confirm the presence of RCTs, so this article will not change clinical practice, but it does provide statistical evidence to support the practice.
Conclusion
This network meta-analysis of diagnostic tests revealed that high-field MRA had the highest diagnostic value for detecting any tear, followed by low-field MRA, high-field MRI, high-frequency US, low-field MRI, and low-frequency US. These findings can help guide clinicians on the appropriate imaging modality.
Footnotes
Final revision submitted September 18, 2019; accepted October 10, 2019.
One or more of the authors has declared the following potential conflict of interest or source of funding: This study was supported by the China Scholarship Council, which funded 2 of the authors (F.L.: No. 201808080126; F.X.: No. 201706920036), and the National Key R&D Program of Shandong Province (J.D.: No. 2016GSF201214). AOSSM checks author disclosures against the Open Payments Database (OPD). AOSSM has not conducted an independent investigation on the OPD and disclaims any liability or responsibility relating thereto.
Appendix
Subgroup Analysis Based on Gold Standard (Arthroscopic Surgery) a

| Test | Absolute Sensitivity | Absolute Specificity | Diagnostic Odds Ratio [Rank] | Superiority Index [Rank] | Relative Sensitivity | Relative Specificity | Data Sets, n | Studies, n |
|---|---|---|---|---|---|---|---|---|
| PT tear | ||||||||
| 3.0-T MRI | 0.84 |
0.88 |
73.13 |
3.02 |
1.00 |
1.00 |
10 | 8 |
| 1.5-T MRI | 0.82 |
0.78 |
18.41 |
0.68 |
0.98 |
0.90 |
17 | 15 |
| ≥7.5-MHz US | 0.92 |
0.86 |
82.87 |
4.84 |
1.10 |
0.99 |
13 | 13 |
| <7.5-MHz US | 0.63 |
0.62 |
14.26 |
0.43 |
0.75 |
0.71 |
1 | 1 |
| PT tear | ||||||||
| 3.0-T MRI | 0.87 |
0.89 |
194.03 |
3.26 |
1.00 |
1.00 |
5 | 5 |
| 1.5-T MRI | 0.78 |
0.81 |
20.98 |
0.53 |
0.91 |
0.92 |
9 | 9 |
| ≥7.5-MHz US | 0.92 |
0.88 |
182.00 |
3.58 |
1.07 |
1.01 |
7 | 7 |
| <7.5-MHz US | 0.74 |
0.73 |
136.19 |
1.08 |
0.87 |
0.84 |
1 | 1 |
| PT tear | ||||||||
| 3.0-T MRI | 0.79 |
0.85 |
146.65 |
3.70 |
1.00 |
1.00 |
5 | 5 |
| 1.5-T MRI | 0.70 |
0.77 |
9.27 |
0.72 |
0.91 |
0.93 |
12 | 12 |
| ≥7.5-MHz US | 0.76 |
0.91 |
44.61 |
3.64 |
0.98 |
1.10 |
7 | 7 |
| <7.5-MHz US | 0.46 |
0.70 |
11.00 |
0.54 |
0.59 |
0.86 |
1 | 1 |
a Data are reported as mean (95% CI) unless otherwise indicated. FT, full-thickness; MRI, magnetic resonance imaging; PT, partial-thickness; US, ultrasound.