
Abstract
Background:
Numerous studies have investigated injuries and treatments in the baseball athlete. The majority of these studies have focused on the throwing shoulder and elbow. However, more recent literature is reporting injuries to other regions in this cohort, including the knee, head, hip, and hamstring.
Purpose/Hypothesis:
The purpose of the current study was to determine the number and type of injuries in Major League Baseball (MLB) and Minor League Baseball (MiLB) players that do not occur during the actual game but are related to baseball participation. Our hypothesis was that there would be a substantial number of injuries that occurred in professional baseball players during non-game situations.
Study Design:
Descriptive epidemiological study.
Methods:
Deidentified, anonymous data were collected from the 2011 through 2016 seasons from the MLB Health and Injury Tracking System (HITS) medical record database. All injuries that were identified as a primary diagnosis and resulted in at least 1 day out of play from both MLB and MiLB were examined. Injuries were categorized as occurring during the game (“game” injuries) or not during the game. A “non-game” injury was defined as occurring at any time other than during the scheduled game from the first to last pitch.
Results:
There were 51,548 total injuries in MLB and MiLB players from 2011 to 2016, almost 40% of which were attributed to non–game-related injuries (n = 19,201; 37.2%). The remainder occurred during a game (n = 32,347; 62.8%). A significantly greater percentage of non-game injuries were season ending (10.8%) compared with the percentage of game-related season-ending injuries (8.4%) (P < .0001). Pitchers had significantly more non–game-related injuries than game-related injuries (P < .0001).
Conclusion:
A large number of injuries occur in professional baseball outside of actual games. MiLB players, specifically pitchers, are particularly at risk for these types of injuries. It is feasible that the overall injury rate in professional baseball players could be reduced by analyzing these injuries in more detail to develop prevention strategies.
A number of studies have evaluated various injury patterns and rates in professional sports. 16 There exists a higher number of epidemiological studies examining professional baseball and football when compared with basketball and hockey. 16 The Major League Baseball (MLB) Health and Injury Tracking System (HITS) database is a comprehensive injury surveillance system that has been available since 2011 for data analysis and research. 19 Before its implementation, studies examining MLB injuries relied on information from the disabled list, which reported only those injuries resulting in ≥15 days lost. 9,20 Several recent studies have been published examining the incidence of injuries in MLB and Minor League Baseball (MiLB) players using the MLB’s Injury Surveillance System. 2,4 –6,10,11,13 Camp et al 6 conducted a study to characterize the most common injuries that occur in MLB and MiLB. The authors found that there was no significant change in the number of injuries from 2011 to 2016 and that pitchers sustained the most injuries. 6 Additionally, while the most common body region injured was the upper extremity, the most prevalent injury was specifically a hamstring strain. 6
Other studies utilizing the HITS database have examined more specific injuries and mechanisms in detail. 2,4,5,7,8,10,11,13 Ahmad et al 2 described hamstring strains that occurred during the 2011 season and compared these injuries with others that resulted in a high amount of days (games) missed. In addition to the high incidence of hamstring injuries in MLB, they found that the most prevalent mechanism of injury was base running. 2 Green et al 13 examined mild traumatic brain injuries using the same database during the 2011 and 2012 seasons. They reported the number of injuries, days missed, injury activity, player position, field location, and mechanism of injury. The highest number of injuries occurred during fielding (53% MiLB; 51% MLB). However, they also determined that a number of injuries also occurred during conditioning, observing, and unspecific non–game-related activities (11% MiLB; 7% MLB). 13 This demonstrates the existence of a possible number of preventable injuries occurring during non–game-related activities.
To our knowledge, no previous has specifically examined all non–game-related injuries. However, several studies have provided some incomplete information regarding these injuries in collegiate athletes. Utilizing the National Collegiate Athletic Association Injury Surveillance Program, DeFroda et al 12 reported on elbow ulnar collateral ligament injuries among collegiate baseball players and found that throwing accounted for 85% of all elbow ulnar collateral ligament injuries. General throwing accounted for 40% of the total injuries, while pitching accounted for 45%. Interestingly, the athletes were injured at a similar rate when comparing games with practices. 12 Agel and Schisel 1 specifically examined injuries during practice in collegiate sports from 1988 to 2004. For baseball, the injury rate during practice was highest for Division I athletes, and the preseason rate of injuries was higher than the in-season and postseason injury rates for Divisions I, II, and III. 1
The purpose of the current study was to determine the number and type of injuries that can occur in MLB and MiLB players that do not occur during the actual game. This information is significant because an understanding of the prevalence, type, and cause of these injuries may help reduce the incidence by educating players, medical staff, and coaching staff about these risks.
Methods
Deidentified, anonymous data were collected from the 2011 to 2016 seasons from the HITS medical record database. Injuries were entered into the database by a team’s certified athletic trainer. All injuries that were identified as a primary diagnosis and resulted in at least 1 day (game) of missed play in either MLB and MiLB players were examined. Injuries were categorized as occurring because of game play (“game” injuries) or not. A “non-game” injury was defined as all injuries occurring at any time other than during the scheduled game (first pitch to last pitch), including pregame, postgame, off-season, batting practice, weight room, and workout. Non–work-related injuries were excluded because we were not able to determine which injuries were caused by athletic activities (and therefore related to baseball). Off-season injuries were included, but they had to continue to be work related and hence baseball related. Additional variables included player age, position, injury activity, mechanism of injury, and time of injury. Days of missed play were calculated as the time between the date of injury and the date of medical clearance to return to play. To be consistent with previous studies involving HITS data, summaries involving days missed excluded injuries whose injury date and medical clearance date were not in the same calendar year (signifying a season-ending injury) because these clearance dates are usually not entered until the following spring training, and thus, accurate time out of play cannot be determined.
The frequency and percentage of game- versus non–game-related injuries, as well as total days missed, were recorded and stratified by level of play (MLB or MiLB). Additionally, timing across the years (2011-2016) was recorded as well as timing within a given year (spring training, in-season, postseason, off-season) and month(s) within a given season (April-September).
Our analysis also included examining more player- and injury-specific details of game- versus non–game-related injuries, presented and tested similarly as those describing the overall burden of these injuries. These characteristics included player age at the time of injury, position (pitcher, catcher, infielder, outfielder), activity at the time of injury (throwing, pitching, hitting, fielding, base running, conditioning, other), and mechanism involved at the time of injury (contact, noncontact, other). Because of the results found with variations across positions, pitchers were further stratified into starters and relievers, with game- versus non–game-related injuries examined separately by level of play (MLB and MiLB) and also combined.
Two-sample proportion statistical tests were performed comparing the distribution of game- versus non–game-related injuries across the levels of each variable considered, with significance determined at the P < .05 level and taking into account Bonferroni adjustments for multiple testing. All statistical analyses were conducted within the R statistical computing environment. 22 The study was approved by the Johns Hopkins Bloomberg School of Public Health Institutional Review Board.
Results
Table 1 summarizes the overall burden of non–game-related injuries in professional baseball. Non-game injuries are defined as those that did not occur from the time of the first pitch of the game to the last and include pregame, postgame, batting practice, workout, weight room, on-premises other, off-premises other, and other. There were 51,548 total injuries related to baseball participation in MLB and MiLB players from 2011 to 2016, with almost 40% attributed to non–game-related injuries (n = 19,201; 37.2%) and the remaining occurring during the game (n = 32,347; 62.8%). The total number of days missed over the study period because of an injury was 716,166 days, with over 40% from non–game-related injuries (297,775 days; 41.6%). A significantly greater percentage of non-game injuries were season ending (10.8%) compared with the percentage of game-related season-ending injuries (8.4%) (P < .0001). When stratified by level of play, there were significantly more game-related than non–game-related injuries in the MLB (18.0% vs 14.0%, respectively; P < .0001). However, the opposite pattern emerged in MiLB, with significantly more non–game-related injuries than game-related injuries (86.0% vs 82.0%, respectively; P < .0001).
Further examination of the burden of these injuries based on timing is also presented in Table 1. There were no significant differences in the proportion of non–game-related injuries compared with game-related injuries when stratified by year (2011-2016; interpretation based on adjusting P values for multiple testing), except for 2011, which had significantly more game-related injuries. During spring training, the proportion of non–game-related injuries (25.9%) was significantly higher than game-related injuries (9.8%) (P < .0001). The same pattern was observed in the postseason and off-season time periods, with the proportion of non–game-related injuries significantly greater than game-related injuries (4.7% vs 1.8% and 7.8% vs 1.6%, respectively; all P < .0001). Not all teams participate in the off-season, which certainly contributes to the postseason findings. During the regular season, however, the proportion of game-related injuries was significantly higher than non–game-related injuries (86.7% vs 61.6%, respectively; P < .0001), which can be attributed to less time during the season being devoted to non-games or amount of practice activities. Results based on within the season showed a significantly greater proportion (adjusted for multiple testing) of non–game-related injuries compared with game-related injuries in the earlier months of April and May (P = .0068) and also September (P < .0001), followed by the opposite trend in July and August, with the proportion of game-related injuries being significantly greater than non–game-related injuries.
Game- and Non–Game-Related Injuries a
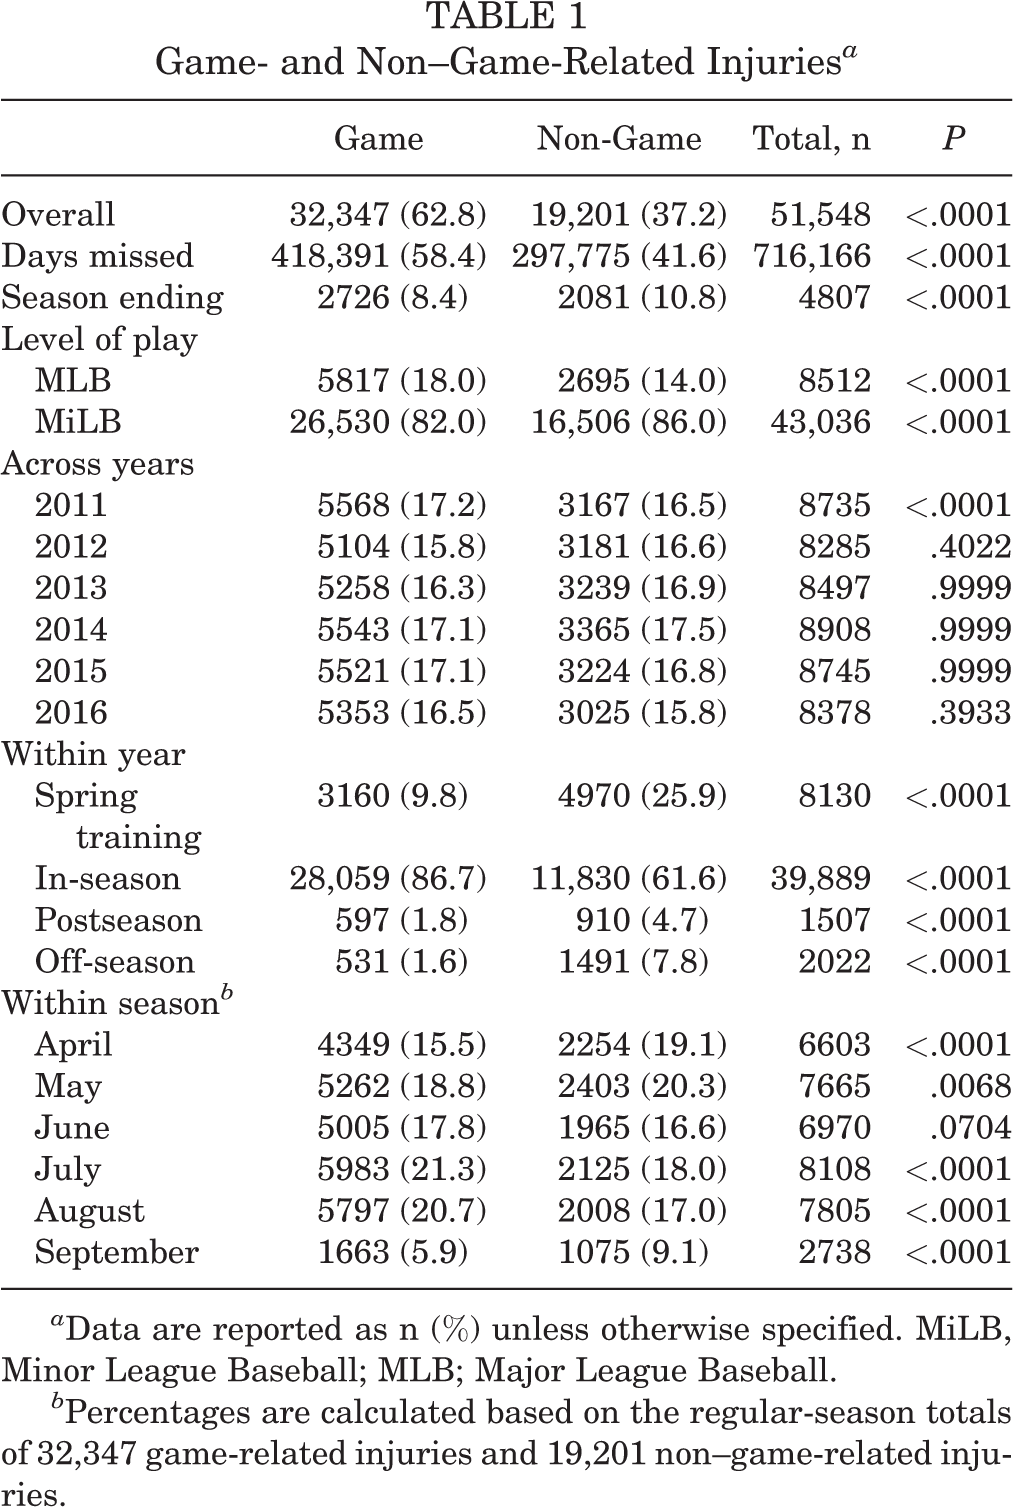
a Data are reported as n (%) unless otherwise specified. MiLB, Minor League Baseball; MLB; Major League Baseball.
b Percentages are calculated based on the regular-season totals of 32,347 game-related injuries and 19,201 non–game-related injuries.
Table 2 presents the results examining player- and injury-specific details of game- versus non–game-related injuries. The mean age for game-related injuries was 24.0 years, which was significantly higher than the mean age of 23.2 years for non–game-related injuries, although the practical relevance of this difference is negligible. The distribution of game- compared with non–game-related injuries across positions showed a more interesting pattern. Within MLB, pitchers (starters and relievers) had significantly higher proportions of non–game-related injuries than game-related injuries (28.5% vs 20.2% and 23.7% vs 13.7%, respectively; all P < .0001). However, the pattern reversed for position players (catchers, infielders, and outfielders), whose proportion of game-related injuries was significantly higher than non–game-related injuries (8.8% vs 6.4%, 31.2% vs 22.9%, and 26.1% vs 18.5%, respectively; P = .0041 for catchers). Consistent results were found in MiLB, with pitchers having significantly more non–game-related injuries than game-related injuries and the opposite trend for position players having significantly more game-related injuries than non–game-related injuries (Table 2). Also of note is that starting pitchers combined for a large majority of the non–game-related injuries with 37.0% (767 for MLB and 6332 for MiLB relative to 19,201 total non-game injuries).
Player- and Injury-Specific Characteristics of Game- and Non–Game-Related Injuries a
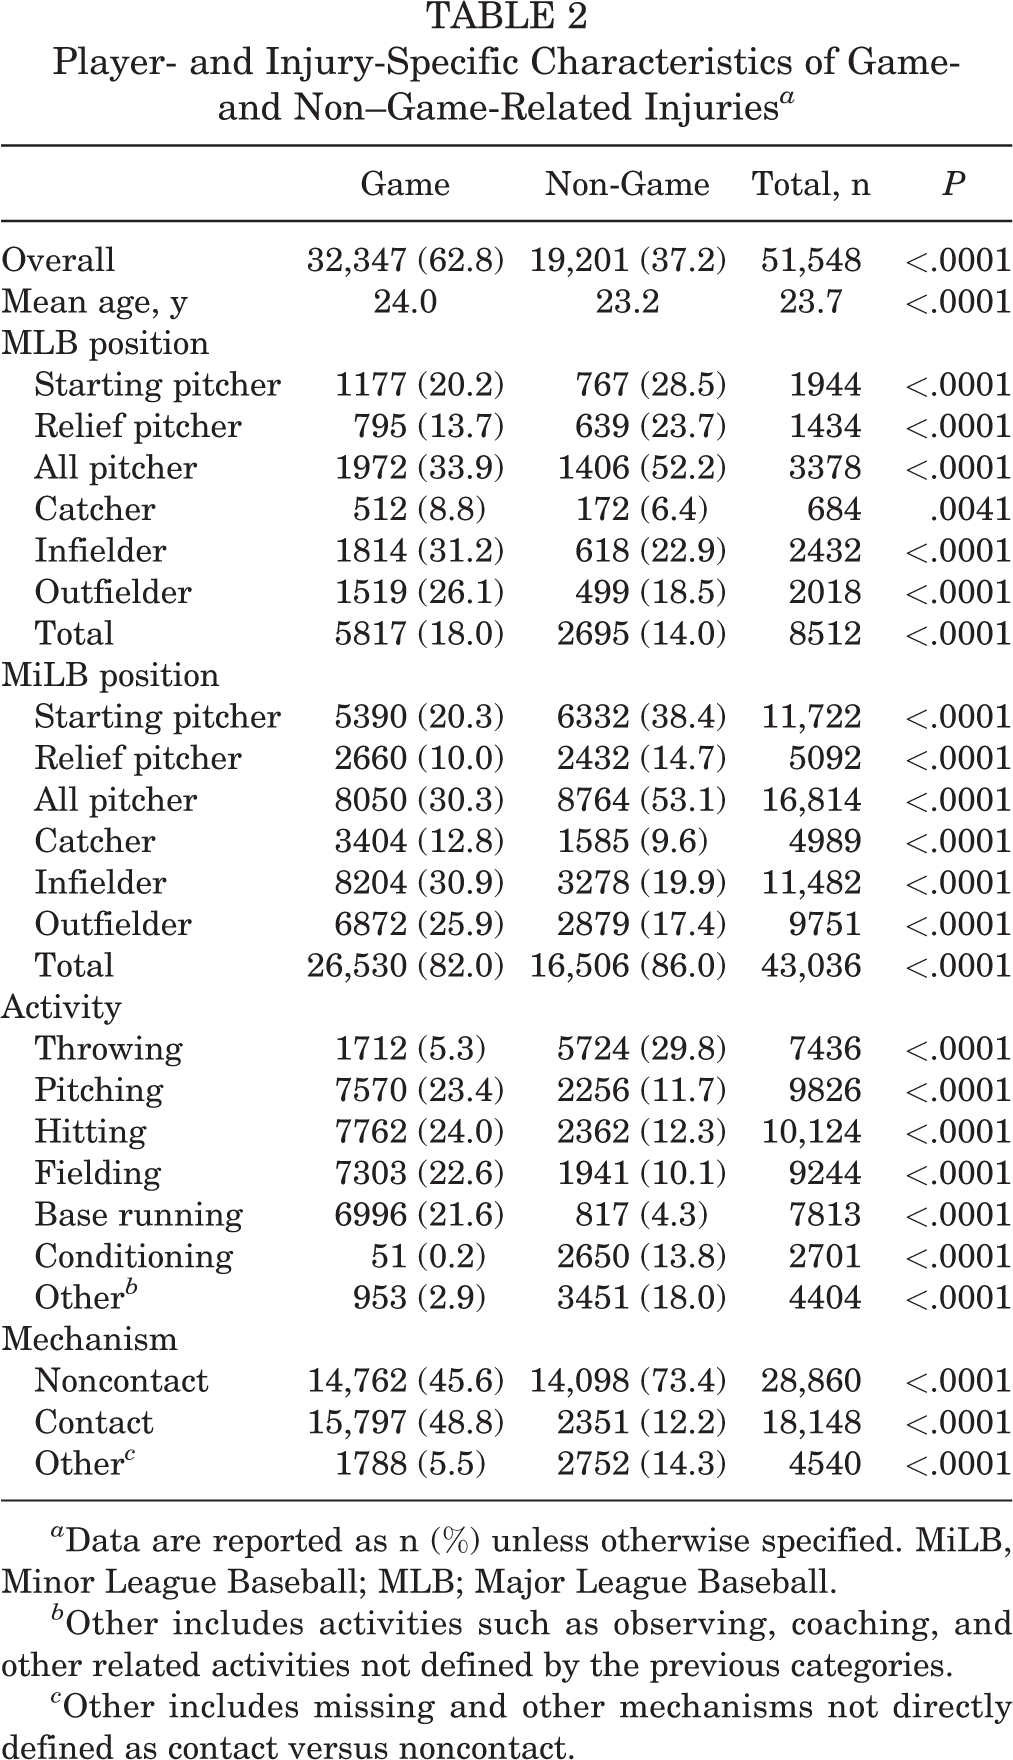
a Data are reported as n (%) unless otherwise specified. MiLB, Minor League Baseball; MLB; Major League Baseball.
b Other includes activities such as observing, coaching, and other related activities not defined by the previous categories.
c Other includes missing and other mechanisms not directly defined as contact versus noncontact.
Results based on specific injury activities and mechanisms are also presented in Table 2. Significantly higher proportions of game- compared with non–game-related injuries were seen with activities related to pitching, hitting, fielding, and base running (23.4% vs 11.7%, 24.0% vs 12.3%, 22.6% vs 10.1%, and 21.6% vs 4.3%, respectively; all P < .0001). On the other hand, significantly higher proportions of non–game-related injuries compared with game-related injuries were seen with activities related to throwing, conditioning, and other (29.8% vs 5.3%, 13.8% vs 0.2%, and 18.0% vs 2.9%, respectively; all P < .0001). The “other” category included activities such as observing, coaching, and other related activities. Most injuries were noncontact related and were significantly more likely to occur during non-game situations (73.4% vs 45.6%, respectively; P < .0001), whereas contact-related injuries were more likely to occur in game situations than non-game situations (48.8% vs 12.2%, respectively; P < .0001).
Further analyses of the subcategories in non-game injuries show that the majority was categorized as workout (32% of non-game injuries), followed by pregame injuries (24%). Overall, the most prevalent injury activity reported as a non-game injury was throwing (27%), followed by other (17%) and batting and pitching (11% each).
Discussion
Overall, we found that non-game injuries related to baseball participation make up over one-third of the total injuries incurred by professional baseball players, that these injuries are more likely to occur in MiLB athletes and pitchers, and that they are more likely to be season ending. Previously, it was reported that MiLB players sustain the majority (83.5%) of all injuries in professional baseball. 6 This is most likely explained by the larger number of athletes in MiLB compared with MLB. In our study, we found that MiLB players sustained significantly more non-game injuries compared with MLB players, which is most likely attributed to exposure (ie, more games in MLB and increased practice times in MiLB, including extended spring training and instructional league). MiLB players attempting to advance may also be conditioning, training, or practicing at a higher rate or volume than the body ultimately can handle. Although every attempt is made to make this an MLB-equivalent environment, the resources at the MiLB level may not permit this goal. Studies conducted on high school sports have found that access to an athletic trainer reduced the number of injuries throughout the season. 15,18 It is possible that consistent and predictable access to an athletic trainer or certified strength and conditioning coach could also help to reduce these injuries. While each MiLB team has a dedicated athletic trainer, each team does not always have a dedicated strength coach. Thus, although attempts at structured workouts and routine are attempted, execution may not be as feasible. Additionally, the maturity level of the MLB athlete and understanding of his own body are generally likely more advanced with MLB players.
Starting pitchers made up a large majority of the non–game-related injuries. The vast majority of these injuries in starting pitchers were considered either pregame or workout injuries, and the majority of workout injuries were also classified or reported as throwing injuries. Starting pitchers may be exposed to fewer games than players of other positions. However, they may also be exposed to more innings. It may be possible that starting pitchers, especially MiLB starters, are throwing too many pitches during their bullpen sessions or during their workouts between starting pitching appearances. A study examined MLB players who underwent ulnar collateral ligament reconstruction to determine whether pitch count affected revision rates. 14 The authors found that pitchers requiring a revision procedure actually pitched fewer total pitches in their first full season after surgery than those who did not: 1413 pitches (no revision) versus 959 pitches (revision). 14 However, the volume of throwing/pitching could have been inaccurate because pitches thrown in the bullpen and during a workout were not counted in this total pitch count, which would be a critical factor, especially with relief pitchers. A study conducted on high school athletes found that of the total number of pitches that a high school athlete threw in 1 game, 42% were bullpen pitches or warm-up pitches between innings. 23 These bullpen and warm-up pitches were not included in the total pitch count, indicating that a large amount of the workload on both starting and relief pitchers may occur outside of a game.
The vast majority (80%) of injuries in professional baseball players occur during the season. 6 However, we found that more than a quarter of the non-game injuries took place during spring training (25.9% of the total non-game injuries). There may be a number of factors that contribute to this high number of spring training injuries, foremost the likelihood of the sudden increase in workloads. Studies examining soccer, rugby, and football have found that high training loads can lead to an increase of injuries in these athletes. 3,17,21 The higher injury rate in April could also be caused by an increase in non–game-related activities just coming out of spring training. The increase in September may be more reflective of general body fatigue and accumulated microtrauma in the winding-down season. It does seem apparent that further examination of spring training protocols could help to reduce these injuries.
Season ending is not a measure of injury severity, as a season-ending injury in May is different from a season-ending injury in September. With that said, the proportion of non–game-related season-ending injuries being similar to game-related season-ending injuries, 10.8% versus 8.4%, respectively, was a surprising result. While we do not have an immediate justification for why this may be so, it further supports our message regarding the burden of non–game-related injuries in baseball. A previous study that described a general analysis of all injuries using the HITS database reported that the injuries that were most likely to be season ending were ulnar collateral ligament injuries in the elbow, anterior or posterior tears of the superior labrum, elbow sprains, lateral meniscal tears, or shoulder instability. 6
There are several improvements that could be made to the injury tracking database to better understand injuries that do not occur during games. For example, the majority of non-game injuries were categorized as “workout.” However, when examining this further, we found that only a quarter of those injuries were caused by conditioning and weight training, whereas the majority of them was caused by throwing. Having an improved understanding of the specifics of these non-game injuries could lead to strategies aimed at decreasing the overall injury rate in these athletes. Beginning with broad categories that narrow into more specific subcategories could assist with analysis of this information. We propose that injuries first be stratified into 4 major categories: pregame (defined as arrival to the stadium up until the first pitch), game (first pitch to last pitch), postgame (any time after the last out until players leave the stadium), and other (time between leaving and arriving to the field on a game day and all non-game days as well as unique situations such as a relief pitcher in the bullpen during the game or a position player injuring himself while hitting in the cage during the game). After categorizing into 1 of the 4 major categories, injuries could be further stratified into minor categories. These would include batting practice, pitching (throwing off the mound at any time), throwing (any throwing that does not occur on the mound), fielding practice, workout (stretching or conditioning that does not occur in the weight room), weight room (any activity that occurs in the actual weight room), and injury because of non–baseball-related activity (baseball-related activities include practicing or conditioning for baseball). Additional detailed subcategories could and should be added as well at the discretion of MLB. These detailed options within the HITS database could include bullpen (under pitching), long toss under the throwing category, and various details under the workout and weight room categories such as stretching, sprinting, distance running, and strength training (with weights, weighted balls, bands), to name a few. Any changes to the database would need to be weighed against the possibility of overburdening medical personnel.
This study has several limitations. We did not have an appropriate denominator to use to report these findings as injuries per athlete-exposure. It is unclear whether MLB and MiLB athletes are exposed to more athletic events that are non–game-related compared with those that are game-related. It is also not clear exactly how information is being entered into the database and how various circumstances are being interpreted, as with all databases of this nature, the data are only as accurate as what is entered. For example, a relief pitcher may be throwing in the bullpen, which would occur during the game, but an injury sustained at that time should be considered a “non-game” injury.
Conclusion
A large number of injuries occur in professional baseball outside of the actual game itself. MiLB players, specifically pitchers, are particularly at risk for this type of injury. The majority of these non-game injuries are categorized as workout injuries, and these workout injuries accounted for over 100,000 days missed over 5 seasons. Based on these findings, an examination of training protocols and efforts to decrease the number of injuries should take place. It is feasible that the overall injury rate in professional baseball players could be reduced by analyzing these injuries in more detail to develop improved prevention strategies.
Footnotes
Acknowledgment
The authors acknowledge the Major League Baseball Players Association and Major League Baseball for their ongoing support and review of this work.
One or more of the authors has declared the following potential conflict of interest or source of funding: The Johns Hopkins Bloomberg School of Public Health (JHBSPH) has an ongoing (≥5 years) contractual arrangement with Major League Baseball to provide injury, epidemiological, and biostatistical support for research related to player health and safety. M.T.F. has received grant support from DJO, consulting fees from Medical Device Business Systems (DePuy) and Smith & Nephew, speaking fees from Integra, and hospitality payments from Wright Medical. F.C.C. is a full-time faculty member in the Department of Epidemiology at the JHBSPH and receives partial salary support for his efforts in these endeavors, which included his involvement in the current study. S.E.L. has received educational support from Pinnacle and hospitality payments from Smith & Nephew. AOSSM checks author disclosures against the Open Payments Database (OPD). AOSSM has not conducted an independent investigation on the OPD and disclaims any liability or responsibility relating thereto.
Ethical approval for this study was waived by the Johns Hopkins Bloomberg School of Public Health (No. 0004130).