
Abstract
Background:
The literature has seldom investigated the anterior cruciate ligament (ACL) tunnel position while considering the effect of rotation of 3-dimensional computed tomography (3D-CT) images during measurements.
Hypothesis:
We hypothesized that (1) measurement of the ACL tunnel position in the femur and tibia through use of 3D-CT is considerably influenced by rotation of the 3D model and (2) there exists a reliable measurement method for ACL tunnel position least affected by rotation.
Study Design:
Controlled laboratory study.
Methods:
The 3D-CT images of 30 randomly selected patients who underwent single-bundle ACL reconstruction were retrospectively reviewed. For femoral tunnel assessments, rectangular reference frames were used that involved the highest point of the intercondylar notch and outer margins of the lateral femoral condyle (method 1), the highest point of the intercondylar notch and outer margins of the lateral wall of the intercondylar notch (method 2), and the lowest point of the intercondylar notch and outer margins of the lateral femoral condyle (method 3). For tibial tunnel assessments, rectangular reference frames with the cortical outline at the articular surface of the tibia (method A) and the cortical outline of the proximal tibia (method B) were used. For both femoral and tibial assessments, the tunnel positions at 5°, 10°, and 15° of rotation of the 3D model were compared with that at a neutral position.
Results:
The values measured by methods 1 and 3 showed significant differences at greater than 5° of rotation compared with the value at the neutral position, whereas method 2 showed relatively consistent results. However, the values measured with both methods A and B showed significant differences at greater than 5° of rotation compared with the value at the neutral position.
Conclusion:
The tunnel position on 3D-CT images was significantly influenced by rotation during measurements. For femoral tunnel position, measurement with a reference frame using the lateral wall of the intercondylar notch (method 2) was the least affected by rotation, with relatively consistent results.
Clinical Relevance:
This study demonstrates that measurement using the lateral wall of the intercondylar notch might be a consistent and reliable method for evaluating the ACL femoral tunnel position considering the effect of 3D-CT image rotation during measurements. However, both methods to measure tibial tunnel position described in this study were similarly affected by rotation.
Recently, the trend of tunnel placement for anterior cruciate ligament (ACL) reconstruction has shifted from the isometric position to the anatomic position because of the biomechanical advantages and superior clinical outcomes of the latter position. 3,8,9,18,20,27,30,34 This has resulted in further studies on accurate tunnel positioning.
To evaluate the ACL tunnel position on plain radiographs, the Bernard quadrant method for the femur and the Amis method for the tibia have been widely used. 1,4 However, the accuracy of these methods has been questioned owing to the limitations of measurements using 2-dimensional (2D) images. 14,24,32 Therefore, evaluation using 3-dimensional computed tomography (3D-CT) images has been extensively investigated, and 3D-CT has replaced the use of plain radiographs. 5,7,12,16,23,25,29,33 Measurement of the ACL tunnel position on 3D-CT images according to a definite protocol has been reported to have high reliability and high agreement with measurement on plain radiographic images. 12,19,21,23 However, these measurements may differ depending on the process of 3D model preparation. Preparing the 3D model based on insufficiently detailed criteria provides an inconsistent measurement surface owing to rotation of the measurement plane. Indeed, many previous studies measuring the ACL tunnel position using 3D-CT images did not describe the 3D model preparation in detail, which might explain the deviations in the reported results. 5,7,15,22,28,36 Furthermore, although 3D rotation can be controlled with a high-end 3D workstation, not all required angles and measurement planes can be achieved in some cases because of technical limitations or inaccurate coordinates during the conversion of the reconstructed 3D model to 3D still images for use in clinical measurements. In turn, the measurement plane could be rotated without being vertically aligned according to the specified coordinate, which subsequently could affect the interpretation of results. As the use of 3D-CT has expanded to evaluation of the ACL tunnel position, it is necessary to identify the influence of the rotation of 3D-CT images on the measurement and to identify the measurement method least affected by the possible rotation of the 3D model.
To our knowledge, few studies have investigated 3D-CT evaluation of the ACL tunnel position while considering the effect of observational errors caused by the rotation of 3D-CT images during measurements. The aims of this study were therefore (1) to identify the effect of the rotation of 3D-CT images on the measurement of the ACL tunnel position and (2) to investigate the measurement method for the femur and tibia that is least affected by rotation during the measurement process. We hypothesized that (1) the measurement of ACL tunnel position in the femur and tibia using 3D-CT is considerably influenced by the rotation of the 3D model and (2) there exists a reliable measurement method for ACL tunnel position least affected by rotation.
Methods
Patient Enrollment
We collected the 3D-CT imaging data of patients who underwent single-bundle ACL reconstruction with an autogenous hamstring tendon through the transportal technique, as performed by a single surgeon (S.-H.K.) from January 2013 to December 2014. Patients with a prior history of ACL reconstruction surgery in the affected knee, history of surgery for fracture in the affected lower limb, underlying bony deformity of the affected lower limb, concomitant surgical procedures for other ligament injuries, history of septic arthritis of the affected knee, and age younger than 18 years were excluded. From the 63 eligible patients, we randomly selected 30 patients (22 males and 8 females) from a Microsoft Excel 2016 spreadsheet by assigning a random number for each row and sorting the data on the random number, and the selected patients were retrospectively investigated (Figure 1). The mean ± SD age, height, weight, and body mass index of the selected patients were 30.3 ± 9.5 years, 171.8 ± 5.9 cm, 70.8 ± 12.7 kg, and 23.9 ± 3.1 kg/m2, respectively. This study was approved by an institutional review board, which waived the requirement for informed consent from patients given the retrospective nature of the study.

Flowchart of patient selection in the study. ACL, anterior cruciate ligament.
3D Model Reconstruction and Measurement Methods
The 3D-CT scanning was performed by use of a 16-channel CT scanner (0.625 mm–thick slices; GE Healthcare) on the day of surgery to evaluate the surgical outcomes, including tunnel position, tunnel diameter, cortical blow-out, and status of the graft fixation in all patients who underwent ACL reconstruction surgery except those who declined to undergo CT scanning. Digital Imaging and Communications in Medicine files of enrolled patients were imported into validated medical imaging software (Mimics 17.0; Materialise) to segment 3D volumetric models for the femur and tibia. Then, 3D rotation was performed on the femoral and tibial models for the accurate realignment of each model (Figure 2).

The process of 3-dimensional model preparation with specified coordinates for accurate realignment.
The process of femoral model preparation was as follows: First, the long axis of the distal femur was defined as the axis of a best-fit cylinder on the distal metaphysis of the femur. Second, the long axis of the distal femur was horizontally aligned parallel to the ground, into a strict lateral view, allowing for overlapping of the femoral condyles. Third, a local coordinate system was set as follows: The x-axis was defined as the line connecting the lowest points of both femoral condyles, and the z-axis as the vector perpendicular to the x-axis, while parallel to the long axis of the distal femur. The y-axis was set as the line perpendicular to the x-axis, passing through the highest point of the posterior arch of the intercondylar notch, determined in the axial plane in which the distal femoral articular surface faced the front of the screen. Thereafter, the medial femoral condyle was removed along the y-z plane. Finally, the femoral model was rotated approximately 90° along the y-axis to orient the cutting surface parallel to the screen, enabling the accurate measurements of the ACL femoral tunnel (Figure 2). 19,23 This was defined as the neutral position of the femur in this study. On the basis of the neutral position of the femur, the reconstructed 3D model was simulated to rotate spatially for varus, valgus, internal rotation, and external rotation, each at 5°, 10°, and 15° (Figure 3).

(A) The 3-dimensional (3D) femoral model of the patient was simulated to rotate according to specified coordinates. On the basis of (B) the neutral position of the femur at the strict lateral position, the 3D model was rotated spatially for (C) varus, valgus, internal rotation (IR), and external rotation (ER), each at 5°, 10°, and 15°.
For the tibial model, the joint surface plane that was the best-fit surface for both tibial condyles was horizontally aligned parallel to the ground in the posterior view. The x-axis was defined as the line connecting the midpoints of the surfaces of both tibial condyles, and the z-axis as the vector perpendicular to the x-axis, passing through the midpoint of the tibial articular surface in the posterior view. The y-axis was then determined automatically through use of the vector product of the z-axis and the x-axis. The model was then rotated approximately 90° along the x-axis to position the joint surface parallel to the screen. Subsequently, the model was rotated so that the posterior articular margins of both tibial condyles were positioned in the same horizontal plane (Figure 2). 23 This was defined as the neutral position of the tibia in this study. As in the femoral model, the tibial model was simulated to rotate spatially for varus, valgus, flexion, and extension, each at 5°, 10°, and 15° (Figure 4). Consequently, 3D images with various degrees of rotation were obtained and registered on image-processing software (ImageJ v 1.50i; National Institutes of Health) to measure the tunnel position.

(A) The 3-dimensional (3D) tibial model of the patient was simulated to rotate according to specified coordinates. On the basis of (B) the neutral position of the tibia with the posterior articular margin of both tibial condyles aligned at the same horizontal plane, the 3D model was rotated spatially for (B) varus, valgus, flexion, and extension, each at 5°, 10°, and 15° . Ext, extension; Flx, flexion.
For the assessment of femoral tunnel position, the reference frame was drawn on the medial side of the lateral femoral condyle based on the grid system suggested by Bernard et al. 4 Because it has been reported that the femoral intercondylar notch has morphological variations such as straight, small hill, and large hill types that may influence measurement of the femoral tunnel position, 17,35 we used 3 measurement methods for the ACL femoral tunnel. Method 1 entailed a rectangular reference frame using the line passing the highest point of the intercondylar notch as the superior border and the outer margins of the lateral femoral condyle as the other borders. Method 2 involved a rectangular reference frame using the line passing the highest point of the intercondylar notch as the superior border, as in Method 1, and the outer margins of the lateral wall of the intercondylar notch as the other borders. Method 3 entailed a rectangular frame using the line passing the lowest point of the intercondylar notch as the superior border and the outer margins of the lateral femoral condyle as the other borders (Figure 5).
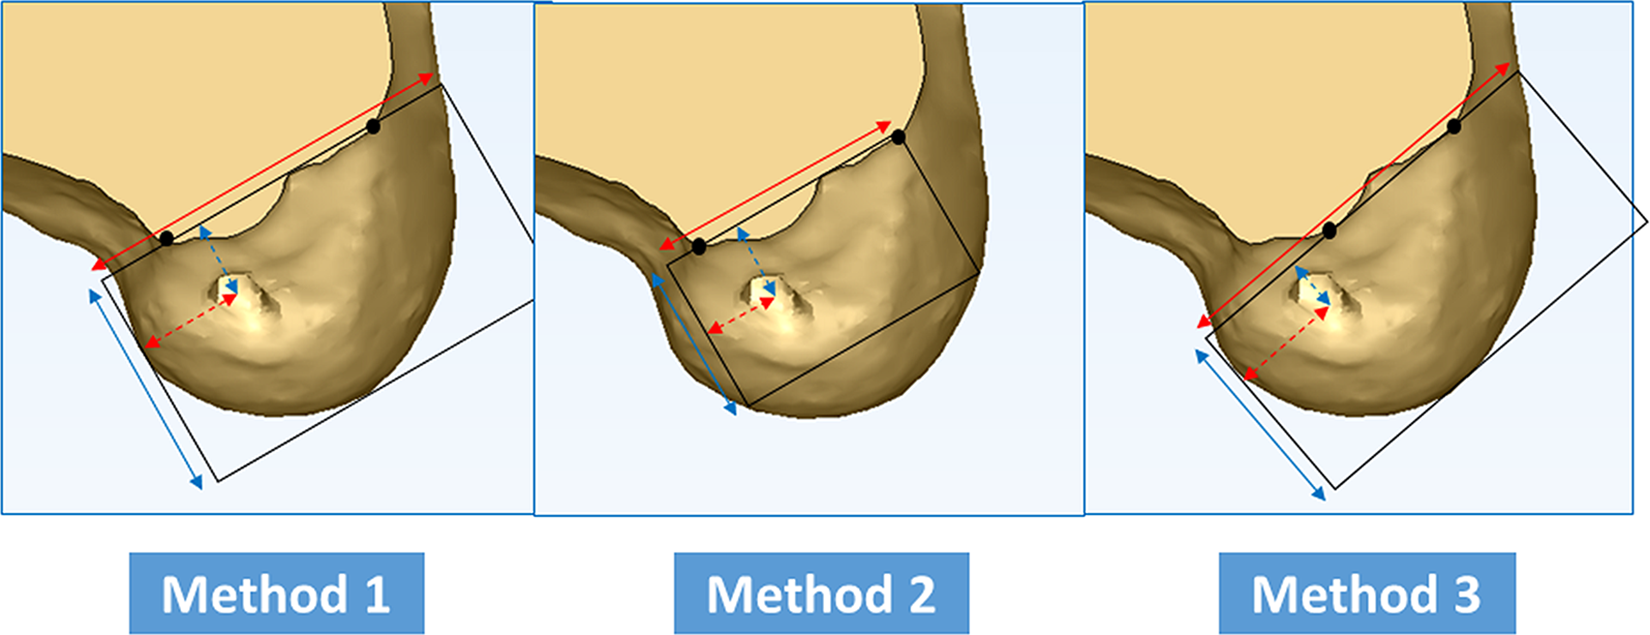
The 3 measurement methods for femoral tunnel height and depth, with different reference frames. The height of the femoral tunnel was expressed as a percentage in each method: vertical distance from the superior border of the reference frame to the center of the tunnel (dashed blue line) ÷ total height of the reference frame (solid blue line) × 100. Likewise, depth was expressed as a percentage in each method: horizontal distance from the deepest border of the reference frame to the center of the tunnel (dashed red line) ÷ total depth of the reference frame (solid red line) × 100.
For the assessment of the tibial tunnel position, the reference frame was drawn with the top view of the proximal tibia, and 2 measurement methods with different rectangular frames were used: Method A involved a rectangular reference frame using the cortical outline at the articular surface of the tibia as the outer borders, and Method B entailed a rectangular reference frame using the cortical outline of the proximal tibia as the outer borders (Figure 6).

The 2 measurement methods for tibial tunnel width and depth, with different reference frames. The depth of the tibial tunnel was expressed as a percentage in each method: vertical distance from the anterior border of the reference frame to the center of the tunnel (dashed blue line) ÷ total depth of the frame (solid blue line) × 100. Likewise, width was expressed as a percentage in each method: horizontal distance from the deepest border of the reference frame to the center of the tunnel (dashed red line) ÷ total width of the reference frame (solid red line) × 100.
All measurements were performed by 2 observers (H.-S.M., H.C.) who were blinded to each other’s findings. They measured each value twice over an interval of 6 weeks, with the patients ordered randomly.
Statistical Analysis
Before the study, a sample size calculation was performed through use of G*POWER software version 3.1.9.2 (F. Faul). Because of the different methods and measurements in the current study, sample size calculation was performed based on a preliminary analysis of ten patients. The significance level (α) was set at 5% and power (1-β) at 90%. The effect size F was set at 0.25, which represents a medium effect according to the criteria suggested by Cohen. 6 Nonsphericity correction (∊) was set at 0.334 on the assumption that the violation of sphericity can occur. Correlation coefficients among pairs of the repeated measurements were calculated for each measurement and direction, and the resulting coefficients ranged from 0.716 to 0.995. Calculated using the lowest correlation coefficient of 0.716, the sample size required for the current study was 29.
Subsequent statistical analyses were performed by use of SPSS statistics version 22.0 (IBM Corp). The height and depth of the femoral tunnel, as well as the width and depth of the tibial tunnel, were analyzed via repeated-measures analysis of variance according to each measurement method. The Bonferroni approach was used to adjust the alpha level for pairwise post hoc comparison. The interobserver reliabilities for tunnel measurements were calculated through use of the intraclass correlation coefficient (ICC) set at a 95% CI. The level of significance was set at P < .05.
Results
In our assessment of the femoral tunnel position, methods 1 and 3 showed significant differences at greater than 5° of rotation from the value measured at the neutral position, whereas method 2 showed relatively consistent results, with significantly different values from 10° of internal rotation and 15° of external rotation (Table 1 and Figure 7). However, in our assessment of the tibial tunnel position, both methods A and B showed a significant difference at greater than 5° rotation from the value measured at the neutral position (ie, similarly affected by various conditions of rotation) (Table 2 and Figure 8).
Measurements of the Height and Depth of the Femoral Tunnel at 5° to 15° of Rotation for Varus, Valgus, Internal Rotation, and External Rotation a

a The values are given as mean ± SD. See Figure 5 percentage calculations for femoral tunnel height and depth. Post hoc correction for multiple comparisons of 4 different degrees of rotation by the Bonferroni method resulted in a P value of .05 to indicate a significant difference compared with the measurement at the neutral position. ER, external rotation; IR, internal rotation.
b Reference value measured at the neutral position without any 3-dimensional rotation.
cP < .05.

Measurements of the height and depth of the femoral tunnel in the neutral position and the measurements at 5° to 15° of rotation for varus, valgus, internal rotation (IR), and external rotation (ER) according to the 3 methods used to assess femoral tunnel position. Ref, reference value. *P < .05. **P < .001.
Measurements of the Width and Depth of the Tibial Tunnel at 5° to 15° of Rotation for Varus, Valgus, Flexion, and Extension a

a The values are given as mean ± SD. See Figure 6 for percentage calculations for tibial tunnel width and depth. Post hoc correction for multiple comparisons of 4 different degrees of rotation by the Bonferroni method resulted in a P value of .05 to indicate a significant difference compared with the measurement at the neutral position.
b Reference value measured at the neutral position without any 3-dimensional rotation.
cP < .05.

Measurements of the width and depth of the tibial tunnel in the neutral position and the measurements at 5° to 15° of rotation for varus, valgus, flexion (Flx), and extension (Ext) according to the 2 methods used to assess tibial tunnel position. Ref, reference value. *P < .05. **P < .001.
The 95% CIs of ICCs were 0.95 to 0.97 (observer 1) and 0.95 to 0.98 (observer 2) for intraobserver reliabilities and 0.90 to 0.94 for interobserver reliabilities.
Discussion
The principal finding of the current study was that the assessment of ACL tunnel position on 3D-CT images was significantly influenced by the rotation of the 3D model during the measurement. In the assessment of the femoral tunnel position, measurement with a reference frame using the lateral wall of the intercondylar notch was least affected by rotation and showed relatively consistent results. However, in the assessment of the tibial tunnel position, the 2 measurement methods used in this study were similarly affected by rotation. This study demonstrates that for accurate measurement of the ACL tunnel position, it is necessary to prepare a 3D model of the patient with a strictly specified position accompanied by appropriate structural descriptions of the position and measurement method. Furthermore, although the present study could not provide an appropriate measurement method for the tibial tunnel, it provides a reliable measurement method for the ACL femoral tunnel position that takes into account possible errors due to the rotation of 3D-CT images during the measurement process.
Although conventional 2D images (plain radiographs) have been used to evaluate tunnel position in ACL reconstruction, 4 they have been shown to lack accuracy and reliability owing to image distortion, structure overlapping, and inappropriate radiographic technique. 14,24 To overcome these problems, 3D-CT images are being increasingly used in the clinical setting. Measurements on 3D-CT images have been reported to have excellent intraobserver and interobserver reliability, with most of the reported ICCs being greater than 0.9. 12,19,21,23
In previous studies, measurements of ACL tunnel position using 3D-CT images showed considerable discrepancies. Although various investigators used the same Bernard quadrant method to measure the ACL tunnel location created through the transportal technique, the mean femoral tunnel height and depth on 3D-CT images were reported to range from 30% to 41.1% and 30% to 36.3%, respectively. 5,7,15,19,22,28,36 Although the ACL tunnel location depends on various conditions, including surgeon-related factors, the measurement process should be able to provide an accurate interpretation of the results. Indeed, many preceding studies did not describe the process of 3D model preparation in detail, 5,7,15,22,28,36 which subsequently reduced the reliability of the results. It is entirely possible that the measurement plane varies depending on the position or angle of the cutting plane that removes the medial femoral condyle during the 3D model preparation, which may result in the rotation of the 3D model to realign the measurement plane. Moreover, because the radius of the medial femoral condyle is known to be slightly larger than that of the lateral femoral condyle, 10 subtle discrepancies between the 3D-CT models in 3D position will be present because of inaccurate overlapping of the femoral condyles during the 3D model preparation.
Furthermore, in clinical practice, it is not uncommon that 3D images are not obtained at all desired angles or that the continuity between still images is not detailed, limitations that subsequently cause the measurements to be performed in an inaccurate position. Although the 3D-CT model is initially made through use of professional 3D medical software, discrepancies can occur in the process of selection, manipulation, and transfer of a series of 3D still images for use in clinical evaluations. 13 Previous studies have reported that 3D model rotation affects the assessment of the tunnel position. 11,26 However, they did not provide adequate solutions to the inconsistent measurement results that could arise from the rotation of the 3D-CT image. Although Mahajan et al 26 suggested that the Blumensaat line could be a reliable landmark for the assessment of tunnel location considering the effect of rotation, they did not provide a detailed description of the reference frame and did not evaluate comparative measurement methods. Because various measurement methods for the tunnel position in ACL reconstruction are available, 1,4,23,29 it is necessary to identify the proper measurement method considering the influence of the rotation of 3D-CT images during measurements.
In this study, 3 methods for the femur and 2 methods for the tibia were proposed for the measurement of ACL tunnel position. For the assessment of femoral tunnel position, the quadrant method proposed by Bernard et al 4 has been extensively used given its excellent reliability. 4,5,7,12,25 However, although the intercondylar notch roof, the main reference line of the Bernard quadrant method, is well-delineated on 3D-CT, it is reported to have various shapes. 2,17,35 Furthermore, it is often difficult to define the reference line of the intercondylar notch roof given its irregular margin, which may subsequently affect the definition of the reference frame. We therefore used 2 different reference lines for the intercondylar notch roof in the current study. Moreover, the outer borders of the rectangular frame comprising the inferior, shallowest, and deepest border were set on the basis of the contour of the lateral femoral condyle and the outer margins of the lateral wall of the intercondylar notch. Both of the outer reference borders were adopted in the current study because they have been reported to provide excellent reliability in the measurement of the ACL femoral tunnel. 23 For the assessment of tibial tunnel position, 3 measurement methods were initially used, in which the measurement surface of the 3D-CT model was aligned parallel to the joint surface in 2 methods 1,23 and was perpendicular to the tibial axis in 1 method. 31 However, because the method proposed by Staubli and Rauschning 31 poses difficulty in defining the reference point and is limited in top-view assessment, 2 methods with the measurement surface aligned parallel to the joint surface were assessed in the current study. 1,23
All measurement methods used for the ACL tunnel position of the femur and tibia showed excellent reproducibility in the current study, with intraobserver and interobserver reliabilities higher than 0.90. These results were consistent with previous studies 19,23,25 demonstrating the usefulness of 3D-CT for the measurement of ACL tunnel position. However, if the measurement is affected by rotation of the 3D model, the value begins to differ from the reference value measured at the neutral position. In method 1 for the femoral tunnel, the assessment of tunnel height was rarely affected by rotation in 4 directions, whereas the assessment of tunnel depth showed significant differences from the reference value at greater than 5° of rotation. In method 3, both tunnel height and tunnel depth measurements were affected by rotation in all 4 directions and by various degrees of rotations. In both methods 1 and 3, more than 5° of rotation of the models significantly affected the measurement of the femoral tunnel position. However, method 2 showed relatively consistent results compared with methods 1 and 3, in which the values were affected only by rotation from 10° of internal rotation and 15° of external rotation.
These findings can be attributed to different factors. First, the lateral wall of the intercondylar notch is located relatively at the center of the rotation axis. Because its 3D location is in proximity to the center, it can be less influenced by rotation. Second, the lateral wall of the intercondylar notch has a relatively flatter surface, which can be easily distinguished from the curved shape of the femoral condyle. Therefore, the boundary between the lateral wall of the intercondylar notch and the femoral condyle has a relatively distinct margin generated from an acute angle between the 2 surfaces, which allows identification of the outer border even at a small degree of rotation. In contrast, because the outer border of the lateral femoral condyle has a curved contour, the reference line for the measurement can be changed by 3D rotation. As a result, we suggest that the measurement method using the lateral wall of the intercondylar notch (method 2) as the most consistent and reliable method for evaluating the ACL femoral tunnel position while considering the effect of 3D-CT image rotation during the measurement. Regarding tibial tunnel position, both of the measurement methods in this study were similarly affected by rotation, thus we were unable to suggest a more reliable measurement method for the tibial tunnel position.
In this study, we found that more than 5° of rotation of the 3D model to the correct plane significantly affected the measurement of the tunnel aperture position in both the femur and the tibia. Because a small degree of rotation has a large influence on the measurement of tunnel location, it is necessary to prepare a 3D model with a strictly specified position accompanied by appropriate structural descriptions of the position and measurement method. Furthermore, an appropriate measurement method is needed that accounts for possible errors due to the rotation of the 3D model during the measurement process. In this study, we found that the appropriate measurement method for the femoral tunnel position was with a reference frame using the lateral wall of the intercondylar notch.
The current study has several limitations. First, the degree of rotation of the 3D-CT models was simulated by rotation at 5° intervals instead of 1° intervals. Although the 3D rotation of the patient was intended to reflect the subtle differences (from the strictly specified position) that may occur during measurements in clinical practice, all cases showing subtle differences were not simulated. Second, we simulated 4 directions of rotation but did not simulate a combination of these directions. However, if all of the situations mentioned above were simulated, the consequent excessive number of cases would cause confusion in the interpretation of results. Except for 1 measurement method for the femoral tunnel location, most of the unidirectional rotations of greater than 5° were sufficient to reveal the effect of rotation on measurement accuracy. Third, the tunnel aperture on the 3D-CT model was observed as an oval shape rather than a round shape, which also changed with rotation during the measurement. This could lead to bias in the measurement of the exact center of the tunnel. However, the current study showed high reliability, with both intraobserver and interobserver ICCs higher than 0.9. Additionally, for the tibial tunnel position, we could not find an appropriate measurement method considering the effect of 3D rotation. Further investigation with different measurement methods is required for this issue.
Conclusion
The assessment of the tunnel position on 3D-CT images was significantly influenced by the rotation of the 3D model during the measurement. In the assessment of the femoral tunnel position, measurement with a reference frame using the lateral wall of the intercondylar notch was the least affected by rotation, with relatively consistent results.
Footnotes
The authors declared that there are no conflicts of interest in the authorship and publication of this contribution. AOSSM checks author disclosures against the Open Payments Database (OPD). AOSSM has not conducted an independent investigation on the OPD and disclaims any liability or responsibility relating thereto.
Ethical approval for this study was obtained from Severance Hospital, Yonsei University College of Medicine (Ref. No. 4-2018-1203).