
Abstract
Background:
Noninvasive quantitative magnetic resonance imaging (MRI) measures to assess anterior cruciate ligament (ACL) graft maturity are needed to help inform return to high-demand activities and to evaluate the effectiveness of new treatments to accelerate ACL graft maturation. Quantitative MRI ultrashort echo time T2* (UTE-T2*) and T2* mapping captures short T2 signals arising from collagen-associated water in dense regular connective tissues, such as tendon, ligament, and maturing grafts, which are invisible to conventional MRI.
Hypothesis:
Quantitative MRI UTE-T2* and T2* mapping is sensitive to ACL graft changes over the first 2 years after ACL reconstruction (ACLR).
Study Design:
Case series; Level of evidence, 4.
Methods:
A total of 32 patients (18 men; mean ± SD age, 30 ± 9 years) undergoing unilateral ACLR and 30 uninjured age-matched controls (18 men; age, 30 ± 9 years) underwent 3-T MRI examination. Patients who underwent ACLR were imaged at 6 weeks, 6 months, and 1 and 2 years postoperatively. Two separate ACLR cohorts were scanned with 2 MRI platforms at 2 institutions. Twelve ACLR knees were scanned with a 3-dimensional acquisition-weighted stack of spirals UTE sequence on a Siemens scanner, and 20 ACLR knees were scanned with a 3-dimensional Cones UTE sequence on a GE scanner. UTE-T2* or T2* maps were calculated for the intra-articular portion of the ACL graft.
Results:
Mean ACL graft UTE-T2* and T2* decreased from 1 to 2 years after ACLR. ACL graft T2* increased 25% to 30% during the first 6 months (P < .013) to a level not different from that of uninjured native ACL (P > .4), stabilized between 6 months and 1 year (P ≥ .999), and then decreased 19% between 1 and 2 years after ACLR (P = .027). At 6-month follow-up, ACL graft UTE-T2* differed from that of tendon (P < .02) but not uninjured native ACL (P > .7) and showed the greatest variability among patients.
Conclusion:
UTE-T2* mapping suggested substantial changes within the graft during the first 6 months postsurgery. T2* and UTE-T2* mapping showed relatively stable graft composition from 6 months to 1 year, consistent with remodeling, followed by decreases from 1 to 2 years, suggestive of continuing maturation. MRI UTE-T2* and T2* mapping demonstrated potential clinical utility as noninvasive quantitative imaging metrics for evaluation of human ACL grafts.
Keywords
Premature return to sports and heavy work following anterior cruciate ligament reconstruction (ACLR) increases risk for reinjury. 4,30 A growing body of literature suggests that the process of anterior cruciate ligament (ACL) graft ligamentization 2 is variable 24,26 and that some grafts may not be sufficiently healed within the first 2 years after ACLR to adequately support mechanical challenges. 29,38 While increasing attention has been paid to patient-specific quantification of neuromuscular recovery, 4,20,40 allowance for graft maturation is generally estimated according to time from surgery. The reason is that the degree and timing of ACL graft ligamentization for individual patients are difficult to measure owing in part to a lack of generalizable quantitative noninvasive assessment metrics.
Measuring ACL graft signal intensity on conventional magnetic resonance imaging (MRI) has been shown in animal studies to correlate with mechanical properties. 8,41 A study by Biercevicz et al 6 showed that, in humans, ACL graft volume combined with median signal intensity measured on standard MRI correlated with single-legged hop at 3 and 5 years. The same group showed that these graft MRI metrics also correlated with patient-reported outcomes at 5 years but not 3 years. 7 However, these authors noted that the use of signal intensity as an outcome measure was limited by dependence on the specific image acquisition parameters and scanner manufacturer used. 9 Furthermore, Li et al 24 evaluated the MRI signal/noise quotient of ACL grafts at 3, 6, and 12 months after ACLR and did not find a correlation between MRI signal intensity and clinical or functional outcomes during the first year after ACLR, when clinical decisions concerning advancement of physical activity are being made.
Efforts to improve quantitative MRI assessment of ACL grafts include measurement of T2* relaxation time, a tissue property reflecting collagen organization, hydration, and the local magnetic environment, to examine healing of native and reconstructed ACL tissues 6 months to 1 year after ACL transection. 5,9 While healthy ligaments and tendons show an abundance of short (<10 ms) T2 species, 34 these tissues are difficult to image with conventional MRI sequences. Special sequences capable of obtaining ultrashort (<1 ms) T2* signals, however, readily acquire short and ultrashort signals. 18,33
Prior MRI studies with ultrashort echo time (UTE)–enhanced T2* measurements show that MRI UTE-T2* is sensitive to collagen matrix integrity and organization, 12,42,44 particularly within dense regular connective tissues emitting an abundance of short T2 signals, such as the deep zone of articular cartilage and the meniscus. 9,11,12,44 UTE-T2* values in these tissues are typically elevated with increased degeneration. 12,44 A previous longitudinal study found that 2 years after ACLR, initially elevated deep cartilage UTE-T2* values decreased to levels comparable with those of controls in most but not all patients undergoing ACLR. 12 Additional studies showing that MRI UTE-T2* mapping 2 years after ACLR correlates with mechanical metrics of increased osteoarthritis risk 39,45 and patient-reported outcomes 45 support the clinical relevance of changes to cartilage MRI UTE-T2*.
With increasing interest in biologic treatments to enhance ACL repair 28 and accelerate ACL graft ligamentization, 10,16 there is clinical need for improved quantitative MRI measures of ACL and ACL graft properties to assist with evaluating new treatments and to inform decisions concerning return to play and physically demanding jobs for individual patients. This study was performed to test the hypothesis that MRI UTE-T2* and T2* mapping shows high potential for quantitative and noninvasive evaluation of ACL graft maturation over the first 2 years after ACLR.
Methods
The investigative cohort consisted of 32 patients (18 men; mean ± SD age, 30 ± 9 years; body mass index [BMI], 26 ± 5) undergoing unilateral ACLR and 30 uninjured age-matched controls (18 men; age, 30 ± 9 years; BMI, 23 ± 3), who provided informed consent to participate in this institutional review board–approved study. The inclusion criteria were as follows: (1) unilateral ACL injury indicated for ACLR, (2) ages 18 to 60 years, and (3) ability and willingness to complete longitudinal MRI examination. The exclusion criteria included (1) concomitant injury beyond medial collateral ligament or meniscal tear, (2) full-thickness chondral defect or cartilage loss by preoperative MRI, and (3) rheumatoid or other inflammatory arthritis, diabetes, or systemic illness requiring medication. There were 2 separate cohorts based on differences in MRI acquisition sequences used at 2 institutions: the 3-dimensional (3D) acquisition-weighted stack of spirals (AWSOS) cohort and the 3D Cones cohort. A total of 147 MRI scans were analyzed for this study.
3D AWSOS Cohort
In the AWSOS cohort, 12 patients undergoing ACLR (5 men; age, 31 ± 11 years; BMI, 28 ± 7; 7 autologous hamstring tendon grafts and 5 soft tissue allograft tendon grafts) (Table 1) and 10 uninjured controls (5 men; age, 27 ± 3 years; BMI, 24 ± 3) underwent 3-T MRI examination of the index knee (Magnetom Trio Tim; Siemens) with the AWSOS sequence. 33,42 AWSOS sequence parameters are listed in Table 2. To facilitate image registration, AWSOS acquisitions underwent cubic interpolation to a 512 matrix size. Effective in-plane resolution was 0.273 × 0.273 mm with 2-mm slice thickness. All patients in the AWSOS cohort who underwent ACLR were scanned at 1 year postoperatively; in addition, 10 of the 12 were scanned at 2 years, and 8 were scanned at 6 months. Uninjured controls in the AWSOS cohort were scanned once.
Acquisition-Weighted Stack of Spirals MRI UTE-T2* Cohort a

a F, female; M, male; MRI, magnetic resonance imaging; UTE, ultrashort echo time.
MRI Parameters a

a AWSOS, acquisition-weighted stack of spirals; ETL, echo train length; FOV, field of view; FS, fat suppression; MRI, magnetic resonance imaging; TE, echo time; TR, repetition time.
b Cones set 1 TE = 0.032 ms and set 3 TE = 0.5 ms not included in any T2* curve fit owing to inadvertent gain change relative to all other echoes in some patients.
3D Cones Cohort
In the Cones cohort, 20 patients undergoing ACLR (13 men; age, 30 ± 9 years; BMI, 25 ± 3; 8 hamstring autografts, 2 peroneus longus allograft, 5 bone–patellar tendon–bone [B-PT-B] autografts, and 5 B-PT-B allografts) (Table 3) and 20 uninjured age-matched controls (13 men; age, 31 ± 10 years; BMI, 23 ± 3) underwent 3-T MRI examination (MR 750; GE Healthcare) with a radial-out 3D Cones acquisition. 18,45 Cones sequence parameters are listed in Table 2. To facilitate image registration, 3D Cones acquisitions underwent cubic interpolation to a 512 matrix size. Effective in-plane resolution for all images was 0.234 × 0.234 mm with 3-mm slice thickness. The index knees of all patients in the Cones cohort who underwent ACLR were scanned at 6 weeks, 6 months, and 1 year postoperatively, and 10 of the 20 ACLR knees were scanned at 2 years. At the 1-year time point, both knees of patients who underwent ACLR were imaged. Uninjured controls in the Cones cohort were scanned once.
Cones MRI T2* Cohort a

a B-PT-B, bone–patellar tendon–bone; F, female; M, male; MRI, magnetic resonance imaging.
UTE-T2* and T2* Analyses
Mean UTE-T2* (AWSOS) or T2* (Cones) relaxation times (in milliseconds) were generated via pixel-by-pixel monoexponential curve fit of the T2* decay signal 27 with MRIMapper software running on a MATLAB platform (Beth Israel Deaconess Medical Center and MIT 2006; The MathWorks). 39,43 Relaxation times calculated from the AWSOS data included an ultrashort echo time (<1 ms) in the curve fit and were therefore UTE-T2* times. Longitudinal registration of image sections across study time points was achieved by visual identification of anatomic landmarks by 1 experienced analyst (A.A.W.) using the same methods previously shown to be repeatable. 43 To evaluate maturation of the intra-articular portion of the graft, UTE-T2* or T2* maps were manually segmented to assess graft tissue appearing in the intra-articular space and to exclude proximal and distal insertions (Figures 1 -3). Intra-articular graft regions of interest were segmented from a single sagittal slice. UTE-T2* and T2* values were also calculated and segmented to assess the patellar tendons of uninjured controls (Figure 2C). Voxels appearing affected by metal artifacts were excluded from the regions of interest.

Sample segmentation (dashed outline) of anterior cruciate ligament graft on Cones sequence image with echo time = 4.7 ms.

ACL graft MRI UTE-T2* decreases from 1 to 2 years after ACLR. (A) As compared with much lower patellar tendon MRI UTE-T2* of uninjured controls (n = 10), UTE-T2* in ACL grafts (n = 8) suggests that ACL graft composition undergoes significant change from that of tendon by 6 months postsurgery (P = .009). UTE-T2* in ACL grafts at 6 months does not differ from uninjured control native ACL (P > .7). (B) A 13% decrease (P = .006) in ACL graft UTE-T2* values (n = 10) from 1 to 2 years after ACLR suggests that the graft continues to remodel during this time frame. Error bars represent ±1 SD. *Paired difference, P < .05. (C) UTE-T2* maps of patellar tendon and ACL in an uninjured control (left) and in the same ACLR case (patient 10 from Table 1) at 1 year (center) and 2 years (right) after ACLR. ACL, anterior cruciate ligament; ACLR, ACL reconstruction; MRI, magnetic resonance imaging; SX, surgery; UTE, ultrashort echo time.
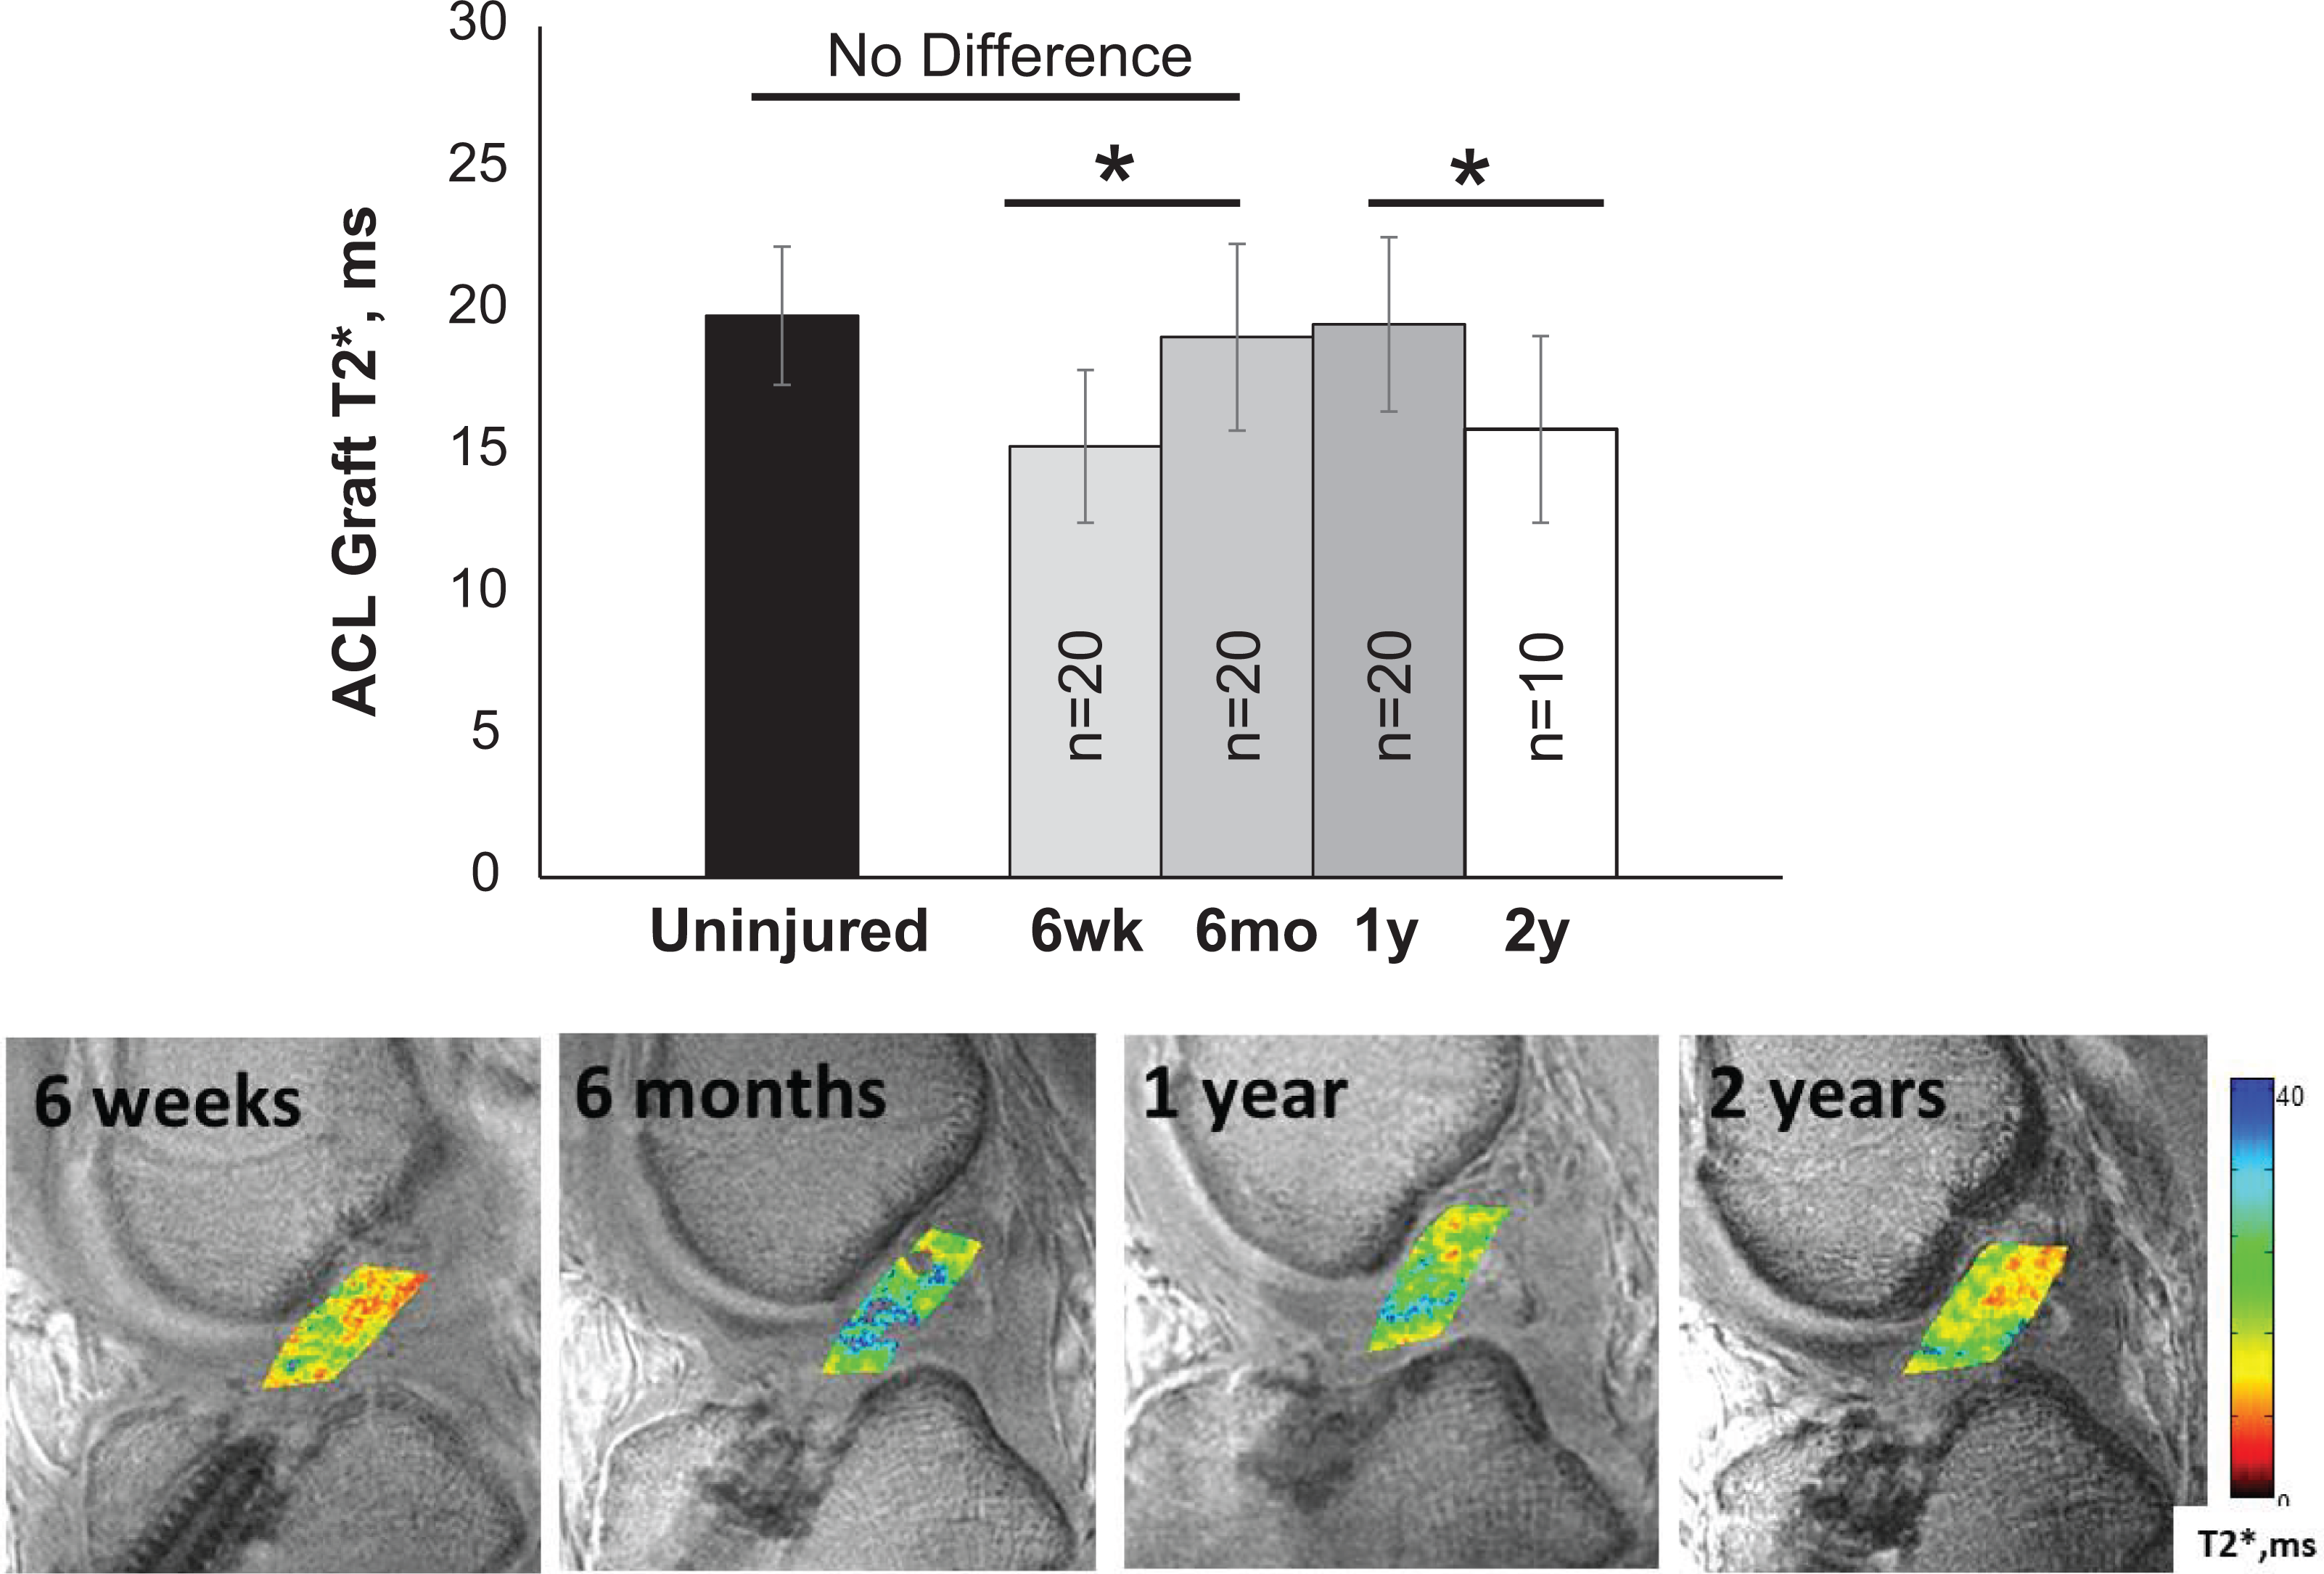
MRI T2* from 6 weeks to 2 years after ACLR. (Top) Repeated quantitative MRI T2* measure of ACL graft tissue in 20 patients shows substantial compositional changes to the graft occurring between 6 weeks and 6 months after ACLR, consistent with the transition from the early to remodeling phase of graft maturation. 13 Across all 20 patients, mean T2* values increased 25% (P < .001) between 6 weeks and 6 months. By 6 months, ACL graft T2* values did not differ from that of native ACL measured in age-matched uninjured controls (n = 20; P ≥ .999). Graft T2* was relatively stable from 6 months to 1 year after ACLR, suggestive of continued remodeling and partial ligamentization. 13, 46 Post hoc pairwise assessment of repeated measures in 10 patients over 2 years indicated that mean graft T2* decreased 19% during the second year after ACLR (P = .027). Error bars represent ±1 SD. *Adjusted P < .05. (Bottom) T2* maps of the ACL graft in patient 2 from Table 3 demonstrate increasing graft T2* values between 6 weeks and 6 months, which then become relatively unchanged to 1 year, as followed by a decrease at 2 years. ACL, anterior cruciate ligament; ACLR, ACL reconstruction; MRI, magnetic resonance imaging.
Statistical Analyses
Normality of all data sets was assessed with Shapiro-Wilks tests. Differences in mean UTE-T2* between 6-month and 1-year time points and between 1- and 2-year time points from the AWSOS cohort were assessed with paired t tests. Differences between UTE-T2* graft values at 6 months and uninjured control ACL or patellar tendon UTE-T2* values were assessed with a Kruskal-Wallis test, and post hoc pairwise comparisons were adjusted for multiple comparisons with Bonferroni t tests. Differences in mean T2* over 3 or 4 time points from the Cones cohort were assessed with repeated-measures analysis of variance (ANOVA) or Friedman ANOVA by ranks (for data not normally distributed). Post hoc pairwise assessments were adjusted for multiple comparisons with Bonferroni t tests (or Tukey for Friedman test). Side-to-side differences at the 1-year time point for the Cones cohort were assessed with a paired t test. Contralateral uninjured ACL T2* values were compared with uninjured control ACL T2* values via a t test. In addition, t tests (or Mann-Whitney for nonnormally distributed data) were used to test for differences in T2* of the Cones cohort with graft source (allograft or autograft), graft type (hamstring or B-PT-B), and sex. Presented P values are from pooled variances unless the variances were unequal between groups as assessed via F tests. Relationships of graft T2* with age and BMI were assessed with Pearson product-moment correlations (or Spearman rho for nonnormally distributed data).
Post hoc power analyses showed that the Cones cohort sample sizes of 20 patients measured 3 times over 1 year and the subset of 10 patients measured 4 times over 2 years both achieved >84% power to detect the measured mean T2* changes of ≤3.9 and 4.4 ms, respectively, between time points as the main effect, with mean (known) within-patient variabilities of 2.9 and 2.9 ms in a repeated-measures model with a significance level of .05. Statistical analyses were performed with SPSS (IBM), Sigma Plot v 12.5 (Systat), and GLIMMPSE (glimmpse.samplesizeshop.org).
Results
ACL Graft MRI UTE-T2* for the AWSOS Cohort
UTE-T2* values to intra-articular ACL graft tissues at 6 months after ACLR (n = 8) were significantly higher than values measured in the patellar tendon of uninjured controls (n = 10; P = .009 after post hoc adjustment for multiple comparisons) but did not differ from native uninjured ACL UTE-T2* of uninjured controls (n = 10; P > .7 after post hoc adjustment) (Figure 2A). Between 6 months and 1 year following ACLR, mean ACL graft UTE-T2* values did not differ (n = 8, paired t test: P > .8). However, mean UTE-T2* values decreased 13% between 1 and 2 years following ACLR (n = 10; paired t test, P = .006) (Figure 2B). On an individual basis, 8 of 10 patients demonstrated a decrease to their intra-articular graft UTE-T2* values, while the remaining 2 patients showed no change between 1 and 2 years. Sample UTE-T2* maps in an uninjured control and patient who underwent ACLR at 1 and 2 years postoperatively are shown in Figure 2C.
ACL Graft MRI T2* for the Cones Cohort
T2* values to intra-articular ACL graft tissue increased between 6 weeks and 6 months, then stabilized for most patients between 6 months and 1 year before decreasing to 2 years. T2* maps measured in the same 20 patients at 6 weeks, 6 months, and 1 year showed significant intra-articular ACL graft T2* elevations over time (n = 20; Friedman test, P < .001) (Figure 3). Post hoc pairwise assessments showed 25% elevation of 6-month T2* values (P = .001) and 29% elevation of 1-year T2* values (P = .002) as compared with T2* measured in the graft at 6 weeks. Between 6 months and 1 year, ACL graft T2* did not change (P ≥ .999). The standard deviation of intra-articular graft T2* values at 6 months of 3.3 ms was 22%, 7% greater than the standard deviations of 2.7 ms and 3.1 ms observed at 6 weeks and 1 year, respectively. Mean ACL graft T2* values at 6 months after ACLR did not differ from that of native ACL in uninjured controls (n = 20; t test, P > .4). The echo times utilized in the monoexponential curve fit of the Cones data did not adequately capture the very fast T2* signal decay in tendon tissue. Thus, T2* relaxation times could not be reliably calculated in the patellar tendons of the Cones cohort.
There were no significant differences in mean Cones T2* values between ACL grafts of men and women (7 women, 13 men; t tests, P > .56), by overall graft type (10 soft tissue, 10 B-PT-B; t tests, P > .37), or between hamstring autografts and B-PT-B autografts (8 hamstring autografts, 8 B-PT-B autografts; t tests, P > .21) at any time point.
Among the subset of Cones patients for which 2-year T2* data were available (n = 10; 8 men; age, 27 ± 6 years; BMI, 24 ± 2), significant changes to mean T2* were detected over time (repeated-measures ANOVA, P < .005) with post hoc pairwise assessments showing that T2* increased 30% from 6 weeks to 6 months after ACLR (P = .013), was stable between 6-month and 1-year follow-up (P ≥ .999), and then decreased 19% during the second year after ACLR (P < .027) (Figure 3). Examination of individual graft T2* longitudinal changes over 2 years showed the greatest variability in T2* measured at 6 months after ACLR, as compared with the other time points (Figure 4).

ACL graft MRI T2* changes vary among patients. T2* in ACL grafts of 10 patients over 2 years following ACLR shows the greatest variation among patients at the 6-month time point. All but 1 patient showed a downward trend in T2* from 1 to 2 years after ACLR. ACL, anterior cruciate ligament; ACLR, ACL reconstruction; MRI, magnetic resonance imaging.
Cones MRI T2* of ACL Graft Versus Uninjured ACL
At the 1-year time point, T2* values were assessed in the contralateral uninjured ACLs of 17 Cones cohort patients who underwent ACLR. Side-to-side comparisons indicated that T2* in the contralateral uninjured ACLs was 10% higher than that of the ACL grafts of the index knees at 1-year follow-up (paired t test, P = .02) (Figure 5). At all time points, the ACL graft MRI T2* differed from that of the contralateral uninjured ACL (paired t tests, P > .05). T2* of the uninjured contralateral native ACL of patients who underwent ACLR (n = 17) was 9% higher than that of a separate cohort of age-matched uninjured controls (n = 20; t test, P = .023).

ACL graft MRI T2* differs from uninjured ACL. T2* of ACL grafts differed from the contralateral uninjured native ACL at all time points after ACLR (P > .05). At the 1-year time point, T2* of the contralateral native ACL remained 10% higher than that of ACL grafts (P = .020) in 34 paired knees of 17 patients with ACLR. Error bars represent ±1 SD. *Paired difference, P < .05. ACL, anterior cruciate ligament; ACLR, ACL reconstruction; MRI, magnetic resonance imaging.
Discussion
Short- and ultrashort-T2 MRI techniques, particularly MRI UTE-T2*, have been used for several years to image human knees in patients after ACLR. 12,39,44 The technologies are currently used at several academic institutions. 3,23,37 The data presented here support the potential clinical utility of MRI relaxometry involving short echo time acquisitions for evaluating ACL graft maturation during the first 2 years after ACL surgery, when decisions concerning return to sport and work activities are being made.
Specifically, MRI UTE-T2* and T2* detected changes to human ACL graft signal over the first 2 years after ACLR that were consistent with what is currently known about the histological stages of ACL graft ligamentization in humans. 1,13,15,36 MRI UTE-T2* and T2* both showed elevations within 6 months after surgery, relative stability between 6-month and 1-year follow-up, and a significant decrease between 1 and 2 years, suggestive of remodeling followed by continued graft maturation into the second year after surgery. Of high potential clinical relevance, the consistent results we obtained in 2 cohorts imaged to answer different questions using different acquisition technologies on 2 MRI platforms demonstrated a degree of signal robustness that supports potential application to multicenter and longitudinal clinical studies.
While the process, timing, and completeness of ACL graft ligamentization in humans have been difficult to evaluate, the existing histological reports in human patients after ACLR show a similar time course to the MRI UTE-T2* and T2* changes observed in this study. Claes et al 13 performed a systematic review of human clinical studies evaluating this question and found just 4 studies, none of which reached a level of evidence higher than 3, reporting on highly variable biopsy endpoints ranging from 3 weeks to 10 years. Based on histological evaluation of cellularity, vascularization, and collagen bundle structure, human ACL graft remodeling was summarized in chronological order into 3 stages: early, remodeling, and maturation. The 3 higher-quality studies showed that the early stage occurred during the first 6 months, the remodeling stage was between 3 and 12 months, and the maturation stage started ≥9 months after surgery. 13 These histologically determined time frames are consistent with the MRI UTE-T2* and T2* findings of this study.
MRI T2* mapping of short T2 signal acquisitions has been shown to be sensitive to collagen structure. 7,42,44 The 6-week T2* data showed that the transplanted tendons had lower T2* than that of uninjured ACLs. However, at 6 months after ACLR, the AWSOS images showed that ACL graft UTE-T2* was significantly higher than that of patellar tendon tissue and did not differ from uninjured control ACL levels. While elevation of T2* between 6 weeks and 6 months likely reflects the histologically observed increases in collagen matrix disorganization of early-stage tendon grafts, 2 subsequent relative stability in mean T2* through 1 year likely reflects variable graft “remodeling,” where residual collagen fragmentation contributes to signal elevation while maturation contributes to lower T2 signals. Limited human histological studies have shown that “ligamentization” remains incomplete even at 10 years after ACLR, 46 suggesting that mature ACL graft tissue properties will be somewhere between native tendons and ligaments. As collagenous tissues mature, the proportion of tightly bound water increases, and UTE-T2* and T2* can be expected to decrease. 34 Thus, the observed longitudinal decrease in UTE-T2* and T2* of ACL graft tissues from 2 cohorts imaged with 2 different T2* acquisition sequences between 1 and 2 years after ACLR suggests that graft maturation continues during the second year after surgery.
Recent data showing that the contralateral uninjured knees of patients who underwent ACLR also exhibit mechanical and physiologic changes soon after surgery 14,32 indicate that the contralateral knee cannot be considered a healthy control. Specifically, Pedoia et al 32 reported that knee cartilage MRI biomarkers T1ρ and T2 demonstrated increases in both knees as soon as 6 months after ACLR. The authors attributed those changes to early cartilage degeneration from altered loading patterns and neuromuscular dysfunction that are known to affect both limbs after ACLR. Additionally, Erhart-Hledik et al 14 observed kinetic and kinematic changes between 2 and 8 years after ACLR in the contralateral limb similar to those observed in the ACLR limb, suggesting bilateral adaptations to injury of a single limb. 14 Given these potential confounders, we employed age-matched healthy participants as primary control cohorts in our study. To additionally address the possibility that interindividual differences may impede detection of relevant changes within ACLR grafts as compared with native ACLs, we imaged the contralateral knee of the T2* Cones cohort at the 1-year time point as a secondary control group. A comparison of the 2 control groups found that the mean T2* of the uninjured contralateral native ACL of patients who underwent ACLR was significantly higher than that of the ACL in a separate cohort of age-matched uninjured controls. This finding supports the use of uninjured participants as controls in examinations of ACL graft maturation.
The analyses of conventional MRI to assess ACL graft maturity have shown important correlates to clinical measures. 8,19,25,35 These studies normalized the conventional signals within the graft to either background signal, termed signal/noise quotient, 25,35 or signal arising from other tissues, termed grayscale value or signal intensity ratio. 8,19 In 2017, Rose et al 35 reported that the signal/noise quotient based on conventional T2-weighted images at 6 months after ACLR showed moderate to strong correlations with sagittal ACL graft angle and tibial tunnel position. In an earlier report, Li et al 25 demonstrated that the signal/noise quotient could differentiate between allograft and autograft tendons at 2 years after ACLR, even though no functional differences were detected in graft strength or stability, nor did the graft types differ in width or edematous condition. Analysis of images acquired with conventional MRI sequences, however, lacks sufficiently short echo times to detect the collagen-associated water signal 31,42 reflective of the graft collagen structure. Thus, the signal/noise quotient findings of these studies may relate more to the vascularity of the grafts during the ligamentization process than to collagen structure.
As our study did not include clinical correlates, it remains unknown whether assessment of short- and UTE-T2* signal improves sensitivity to clinically relevant changes in ACL grafts. However, examinations of short- and long-T2 components in clinical studies of other collagen-rich musculoskeletal tissues have shown improved injury detection specifically from methods with sensitivity to short-T2 components. In Achilles and patellar tendinopathies, T2* assessments that included contributions from short-T2 components have been shown to be sensitive to subtle and even “preclinical” degeneration, 17,21,23 while assessments of long-T2 components in these tissues could not discriminate between injured and control tendons. 21,23 Similarly, mild and occult intrasubstance degeneration within intact menisci has also been identified with UTE sequences sensitive to short-T2 signals. 22,44
Furthermore, other MRI measures based on T2*-weighted sequences show sensitivity to collagen organization. 31,42,44 In a human study, Hakozaki et al 19 found that the graft signal intensity ratio derived from T2*-weighted images was associated with anterior drawer and pivot-shift tests of graft stability at 1 year after ACLR, while graft signal intensity ratio values derived from conventional proton density–weighted images were not. In an animal model with grayscale values for quantitative graft evaluation, Biercevicz et al 8 found that normalized graft T2*-weighted signal was predictive of graft mechanical properties. While not assessing collagen structure directly, findings from both these studies demonstrate the utility of T2*-weighted measures for assessing maturation of ACL grafts.
Another advantage of T2* relaxometry is improved longitudinal reliability. MRI metrics based on signal intensity are subject to variation with sequence parameters and imaging conditions, thereby limiting reliability beyond the particular protocol and magnet with which they are measured. The potential for such variation is especially problematic for longitudinal studies that traverse software and hardware upgrades to the MRI scanner. T2* relaxometry, by comparison, represents inherent tissue properties that are more robust to differences in measurement sequences, scanners, and institutions, as demonstrated in this work. Furthermore, the T2* and UTE-T2* measurements used in this study have the additional advantage of being sensitive to short-T2 signal and thus to collagen organization as an indicator of graft maturation.
By being both sensitive to and able to robustly quantify contributions from short-T2 signals in ACL tissues, UTE-T2* and T2* relaxation metrics represent a new approach to the study of ACL graft maturation that moves the field beyond what can be achieved with conventional MRI. Specifically, standard MRI cannot account for the collagen-associated short-T2 water signals that are abundant in tendon, ligament, and mature ACL grafts. Notably, the echo times included in the AWSOS cohort UTE-T2* decay curve fits robustly measured monoexponential T2* relaxation in tendon tissue and ACL grafts, while the Cones cohort T2* decay curve fits, which had only 1 echo image with echo time <3 ms, did not. These data reflect the abundance of very short T2 species in patellar tendon and indicate that inclusion of a UTE or additional echo images with echo time ≤3 ms is needed to adequately measure T2* relaxations in patellar tendon.
Limitations of this study include the following: small patient numbers, the presence of small metal artifacts that increase segmentation uncertainty, protocol differences that preclude combined analyses of the 2 cohorts, and a lack of histological, biomechanical, or clinical correlates of graft maturity, owing to the original design of the studies, which were for bench-to-bedside translation of MRI UTE-T2* mapping techniques. While T2* relaxations were not observed to differ among grafts, the low number of patients with B-PT-B autografts as compared with hamstring autografts and the combination of allograft and autografts used in these cohorts limit these types of analyses.
Conclusion
MRI UTE-T2* and T2* mapping shows potential clinical utility as noninvasive imaging metrics for evaluation of human ACL graft maturation. These metrics were sensitive to changes in human ACL grafts, consistent with the time course estimated from histological assessments. 1,13,15,36 The short-T2* signals assessed in this work are thought to primarily reflect collagen organization; thus, T2* and UTE-T2* changes observed herein suggest progressive and continuing maturation of the collagen architecture in ACL grafts over the first 2 years after ACLR. Consistent UTE-T2* and T2* findings between 1 and 2 years across 2 cohorts imaged with different sequences and scanners support the robustness of short-T2 relaxometry for use in future multicenter and longitudinal clinical studies assessing the potential impact of surgical techniques, graft choice, biologics, and other factors on ACL graft ligamentization.
Footnotes
One or more of the authors has declared the following potential conflict of interest or source of funding: This study was funded by the National Institutes of Health (AR052784, to C.R.C.). GE Healthcare provided the Cones sequence and sequence support with access to its research magnet installed at Stanford University. AOSSM checks author disclosures against the Open Payments Database (OPD). AOSSM has not conducted an independent investigation on the OPD and disclaims any liability or responsibility relating thereto.
Ethical approval of this study was obtained from the Stanford University Panel on Medical Human Subjects.