
Abstract
Background:
Lower socioeconomic status (SES) is associated with worse patient-reported outcome (PRO) after orthopaedic procedures. In patients with anterior cruciate ligament (ACL) reconstruction, evaluating SES by use of traditional measures such as years of education or occupation is problematic because this group has a large proportion of younger patients. We hypothesized that lower education level and lower values for SES would predict worse PRO at 2 years after ACL reconstruction and that the effect of education level would vary with patient age.
Purpose:
To compare the performance of multivariable models that use traditional measures of SES with models that use an index of neighborhood SES derived from United States (US) Census data.
Study Design:
Cohort study; Level of evidence, 3.
Methods:
A cohort of 675 patients (45% female; median age, 20 years), were prospectively enrolled and evaluated 2 years after ACL reconstruction with questionnaires including the International Knee Documentation Committee (IKDC) questionnaire, the Knee injury and Osteoarthritis Outcome Score (KOOS), and the Marx activity rating scale (Marx). In addition, a new variable was generated for this study, the SES index, which used geocoding performed retrospectively to identify the census tract of residence for each participant at the time of enrollment and extract neighborhood SES measures from the 2000 US Census Descriptive Statistics. Multivariable models were constructed that included traditional measures of SES as well as the SES index, and the quality of models was compared through use of the likelihood ratio test.
Results:
Lower SES index was associated with worse PRO for all measures. Models that included the SES index explained more variability than models with traditional SES. In addition, a statistically significant variation was found regarding the impact of education on PRO based on patient age for the IKDC score, the Marx scale, and 4 of the 5 KOOS subscales.
Conclusion:
This study demonstrates that lower neighborhood SES is associated with worse PRO after ACL reconstruction and that age and education have a significant interaction in this patient population. Future studies in patients who have undergone ACL reconstruction should attempt to account for neighborhood SES when adjusting for confounding factors; further, targeting patients from areas with lower neighborhood SES with special interventions may offer an opportunity to improve their outcomes.
When the effects of medical treatment, the effects of surgical treatment, or the propensity to develop a disease are evaluated, the consideration of socioeconomic status (SES) is essential. Different socioeconomic factors are known to affect health through numerous causal pathways. 4 For example, it has been found that people with low SES experience more dysfunction in multiple biological systems compared with people who have higher SES. 3 Furthermore, neighborhood SES has been shown in many studies to correlate with the observed measure of health more strongly than common individual socioeconomic factors. 8,9 Within the realm of orthopaedic surgery, several retrospective studies have identified associations between SES and important aspects of total joint arthroplasty. 11,14,15,19 Mahomed et al 15 found SES to be indirectly related to mortality and wound infection following total hip arthroplasty. SooHoo et al 18 found that patients insured with Medicaid had higher odds of having an infection following a total knee arthroplasty than those with private insurance.
Anterior cruciate ligament (ACL) reconstruction can effectively restore knee stability and allow patients to return to sporting activities, but not all patients have the same improvement in patient-reported outcome (PRO) after surgery. For example, certain factors such as younger age and use of allograft have been associated with higher failure rates and a worse PRO. 6,12 In addition, socioeconomic variables including race and education level have been significant predictors of outcome in previous studies from our cohort. 6 However, a growing body of evidence suggests that neighborhood SES can be used as a proxy for individual SES and that a person’s health may be influenced more by neighborhood SES than individual-level SES. 3,7 –9 In addition, the young age of patients who have ACL reconstruction makes the use of education level as a predictor of SES problematic. Many of these patients are students, so their final education level has not yet been attained. Because education level increases with age in children and young adults, any findings attributed to this variable may be confounded by age until students complete their education.
The purpose of this study was to clarify the relationships between age, education level, neighborhood SES, and PRO after ACL reconstruction. We hypothesized that lower education level and lower neighborhood SES would predict worse PRO at 2 years after ACL reconstruction and that the relationship between education level and PRO would vary depending on patient age. We also hypothesized that models including neighborhood SES would explain more variation than models without these variables.
Methods
The Multicenter Orthopaedic Outcomes Network (MOON) is a prospective, multicenter cohort study that began enrolling patients at 7 sites in 2002. Details of the study design have been previously published. 6,10 Patient questionnaires were administered at baseline and 2 years postsurgery. Evaluation of later outcomes becomes more complex because patients are more likely to move and live in different neighborhoods 6 and 10 years after surgery, so we chose to focus on 2-year outcomes for this project. The validated outcome instruments included the International Knee Documentation Committee (IKDC) questionnaire, the Knee injury and Osteoarthritis Outcome Score (KOOS), and the Marx activity rating scale (Marx), and general questions included age, sex, race-ethnicity, height, weight, occupation, and years of education. Surgeon questionnaires were completed after surgery and included documentation of examination under anesthesia, arthroscopic findings, and details of the treatment such as graft choice, fixation technique, and meniscal and articular cartilage abnormalities and treatment. Rehabilitation was standardized across the cohort through use of an evidence-based rehabilitation protocol. Enrolling surgeons participated in a cadaveric study that established their ability to appropriately place tunnels regardless of surgical technique. 20
This study included patients from 2 of the MOON sites (Cleveland Clinic, Cleveland, Ohio, and Vanderbilt University Medical Center, Nashville, Tennessee) from the 2002 to 2004 enrollment years (Figure 1). Additional sites could not be included because of limitations placed by local institutional review boards on the use of protected health information (census data tract, in particular).

Patient enrollment flow diagram. ACL, anterior cruciate ligament; LCL, lateral collateral ligament; MCL, medial collateral ligament; PCL, posterior cruciate ligament.
SES Calculation
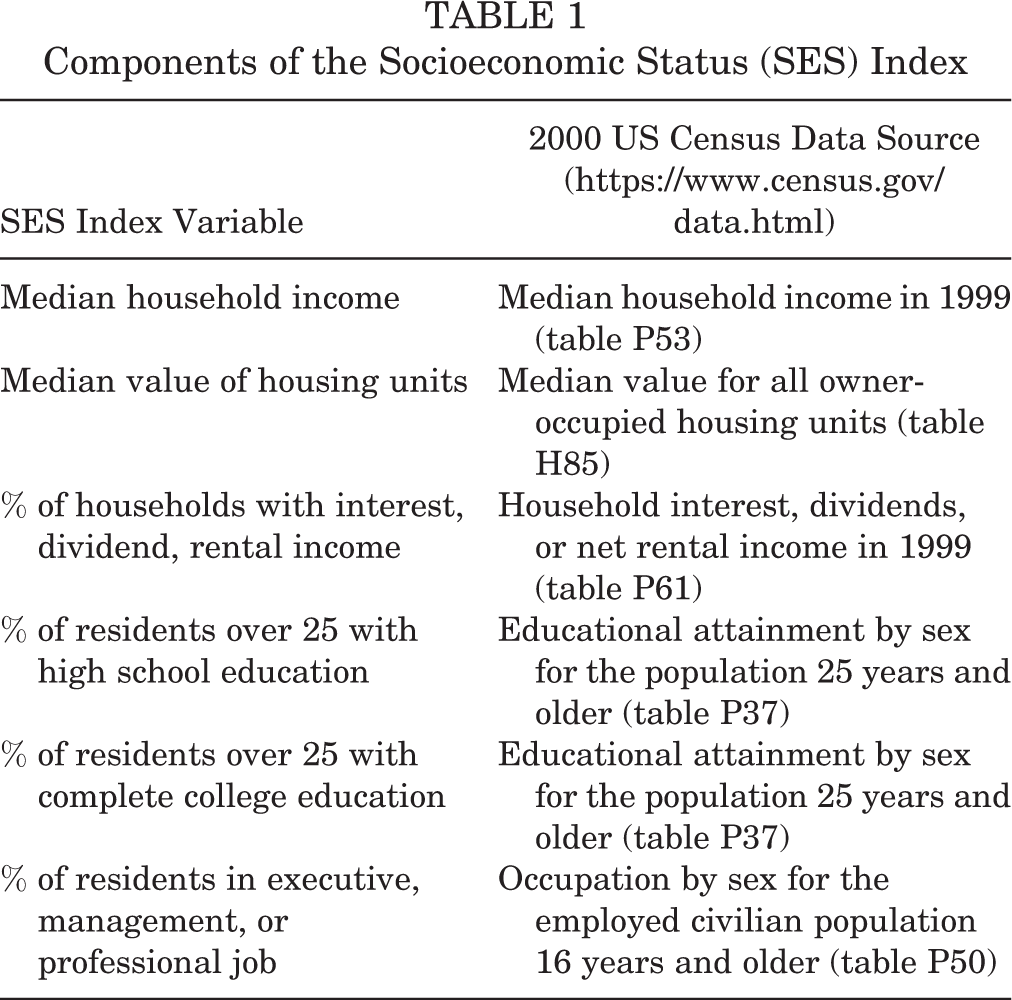
Neighborhood SES was appraised through the use of geocoding, using ArcGIS 10.1 (Environmental Systems Research Institute) to plot a patient’s address on a map and determine which census tract contains the address. Census tracts are small subdivisions of a county that usually contain between 2500 and 8000 persons; in a sense, census tracts are analogous to large neighborhoods. Census tracts are designed to be homogenous with respect to population characteristics, economic status, and living conditions. Once the census tract for each address was determined, descriptive statistics provided by the 2000 United States (US) Census were retrieved and used as a proxy for the SES of patients who lived within the respective census tracts. Because many of the variables from the US Census are overlapping and highly correlated, factor analysis was used to identify 6 largely uncorrelated variables that contribute to SES (Table 1). These variables were joined by summing their z scores (the number of standard deviations from the mean for each measurement) and were used as a composite index of SES. 3,4,7 –9
Components of the Socioeconomic Status (SES) Index
Statistical Analysis
Sequential models were constructed to better understand the additional effect of both standard socioeconomic variables (education, employment status, student status, disability status, and interaction of age and education) and neighborhood SES (SES index) on PRO (IKDC, KOOS subscales, and Marx scores).
A parsimonious clinical model was initially constructed to predict PRO scores based on demographic variables and details of physical examination, surgical findings, and surgical technique that were significant predictors in prior studies. 6,10 These variables included age, sex, race, body mass index, smoking status, sport played at the time of injury, competition level, graft type, primary versus revision surgery, lateral meniscal tear severity, and baseline outcome score.
Next, variables that have traditionally been used as a proxy for SES were added to the model. These included years of education, employment status (full-time, part-time, and unemployed), student status, and disability status. A variable to test the interaction of age and education was also included because many patients in the cohort were not old enough to have completed their education. The corrected Akaike information criterion (AICc), a measure of the relative quality of statistical models corrected for sample size, was calculated for each model. A general rule is that a difference of 2 or more in the AICc indicates a statistically better model. 1,5 In addition, hypothesis testing was performed by use of the likelihood ratio test, with P < .05 indicating a significant difference in models.
The SES index was calculated for each patient as follows: Each patient’s home address at baseline was mapped through use of ArcGIS software to determine the census tract for each address and link to the relevant statistics from the 2000 US Census. The 6 SES index variables and corresponding US Census statistics are listed in Table 1. Next, the variables were transformed so that higher values represented higher SES and were normalized by calculating a z score for each variable and summing the z scores for each variable to create a summary score, the SES index.
Next, the SES index variable was tested to see whether it improved the performance of the models. For outcome measures where the addition of the traditional SES variables improved model performance, the SES index was added to the model to see whether it provided any improvement in performance over the traditional SES variables. For outcome measures where the traditional SES variables did not improve model performance, the SES index variable was added to the clinical model and model performance was evaluated. As in the previous step, models were compared by use of the difference in AICc and the likelihood ratio test.
Results
Table 2 shows univariate baseline characteristics of the cohort. The cohort contained 675 patients; 45% were female, and the median age was 20 years. Table 3 shows the outcome scores at baseline and 2-year follow-up.
Descriptive Summary of the Cohort (N = 675) a

a BMI, body mass index; BTB, bone–patellar tendon–bone; Q1, first quartile; Q3, third quartile; SES, socioeconomic status.
Outcome Scores at Baseline and 2-Year Follow-up a

a Data are reported as median (1st quartile, 3rd quartile). ADL, activities of daily living; IKDC, International Knee Documentation Committee; KOOS, Knee injury and Osteoarthritis Outcome Score; Marx, Marx activity rating scale; QoL, Quality of Life; Sports&Rec, Sports and Recreation.
Table 4 shows the results of the model comparisons for each outcome measure (KOOS subscales, Marx, IKDC). “Clinical” indicates the model with only clinical variables, “A” indicates the additional variables that are traditionally used to account for SES (years of education, employment status, student status, disability status, interaction of age and education), and “B” indicates the SES index variable. For 4 of the outcomes (KOOS Activities of Daily Living [ADL], Knee-Related Quality of Life, and Pain subscales and the Marx scale), the model performed significantly better with the A variables. When the B variable was added to these models, the model improved in each case. For the other 3 outcome measures (KOOS Sports and Recreation and Symptoms subscales and the IKDC), addition of the B variable to the clinical model significantly improved the model in each case. Of note, the SES index (B variable) was always positive, indicating that higher SES index was associated with better PRO scores.
Comparison of the Clinical Model With Models Including SES Variables a
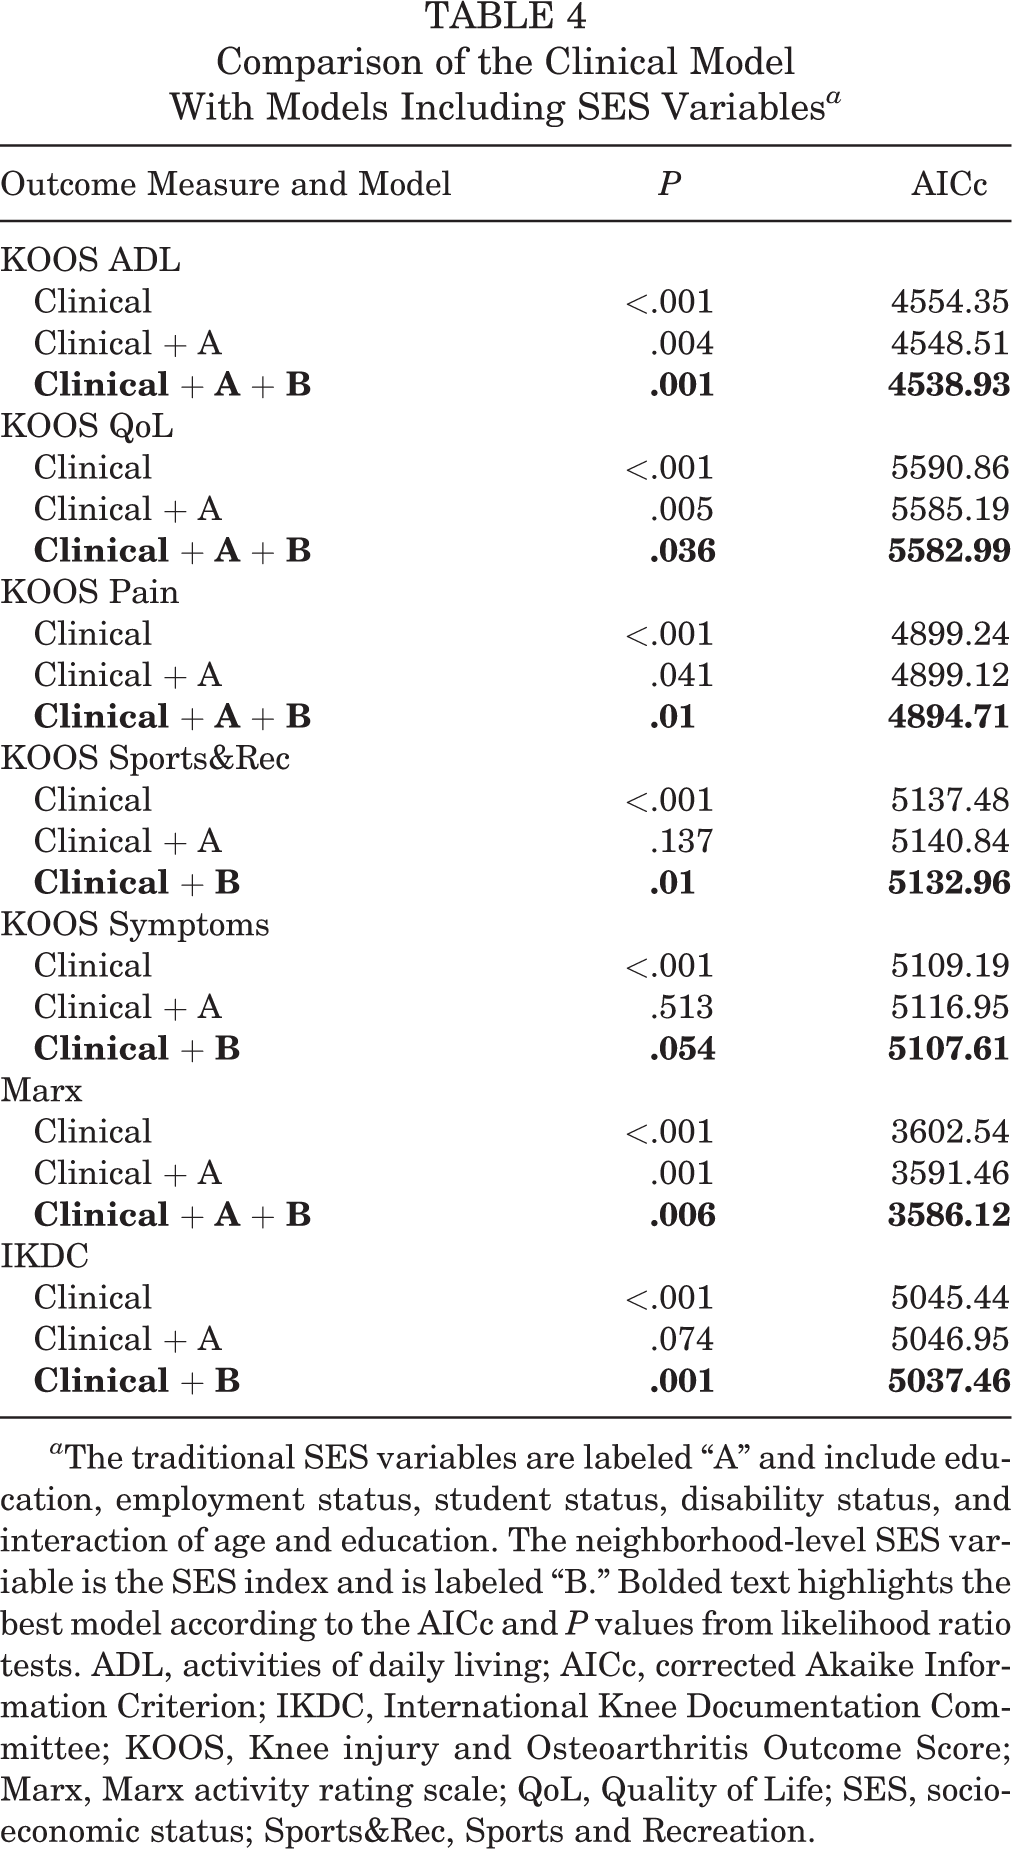
a The traditional SES variables are labeled “A” and include education, employment status, student status, disability status, and interaction of age and education. The neighborhood-level SES variable is the SES index and is labeled “B.” Bolded text highlights the best model according to the AICc and P values from likelihood ratio tests. ADL, activities of daily living; AICc, corrected Akaike Information Criterion; IKDC, International Knee Documentation Committee; KOOS, Knee injury and Osteoarthritis Outcome Score; Marx, Marx activity rating scale; QoL, Quality of Life; SES, socioeconomic status; Sports&Rec, Sports and Recreation.
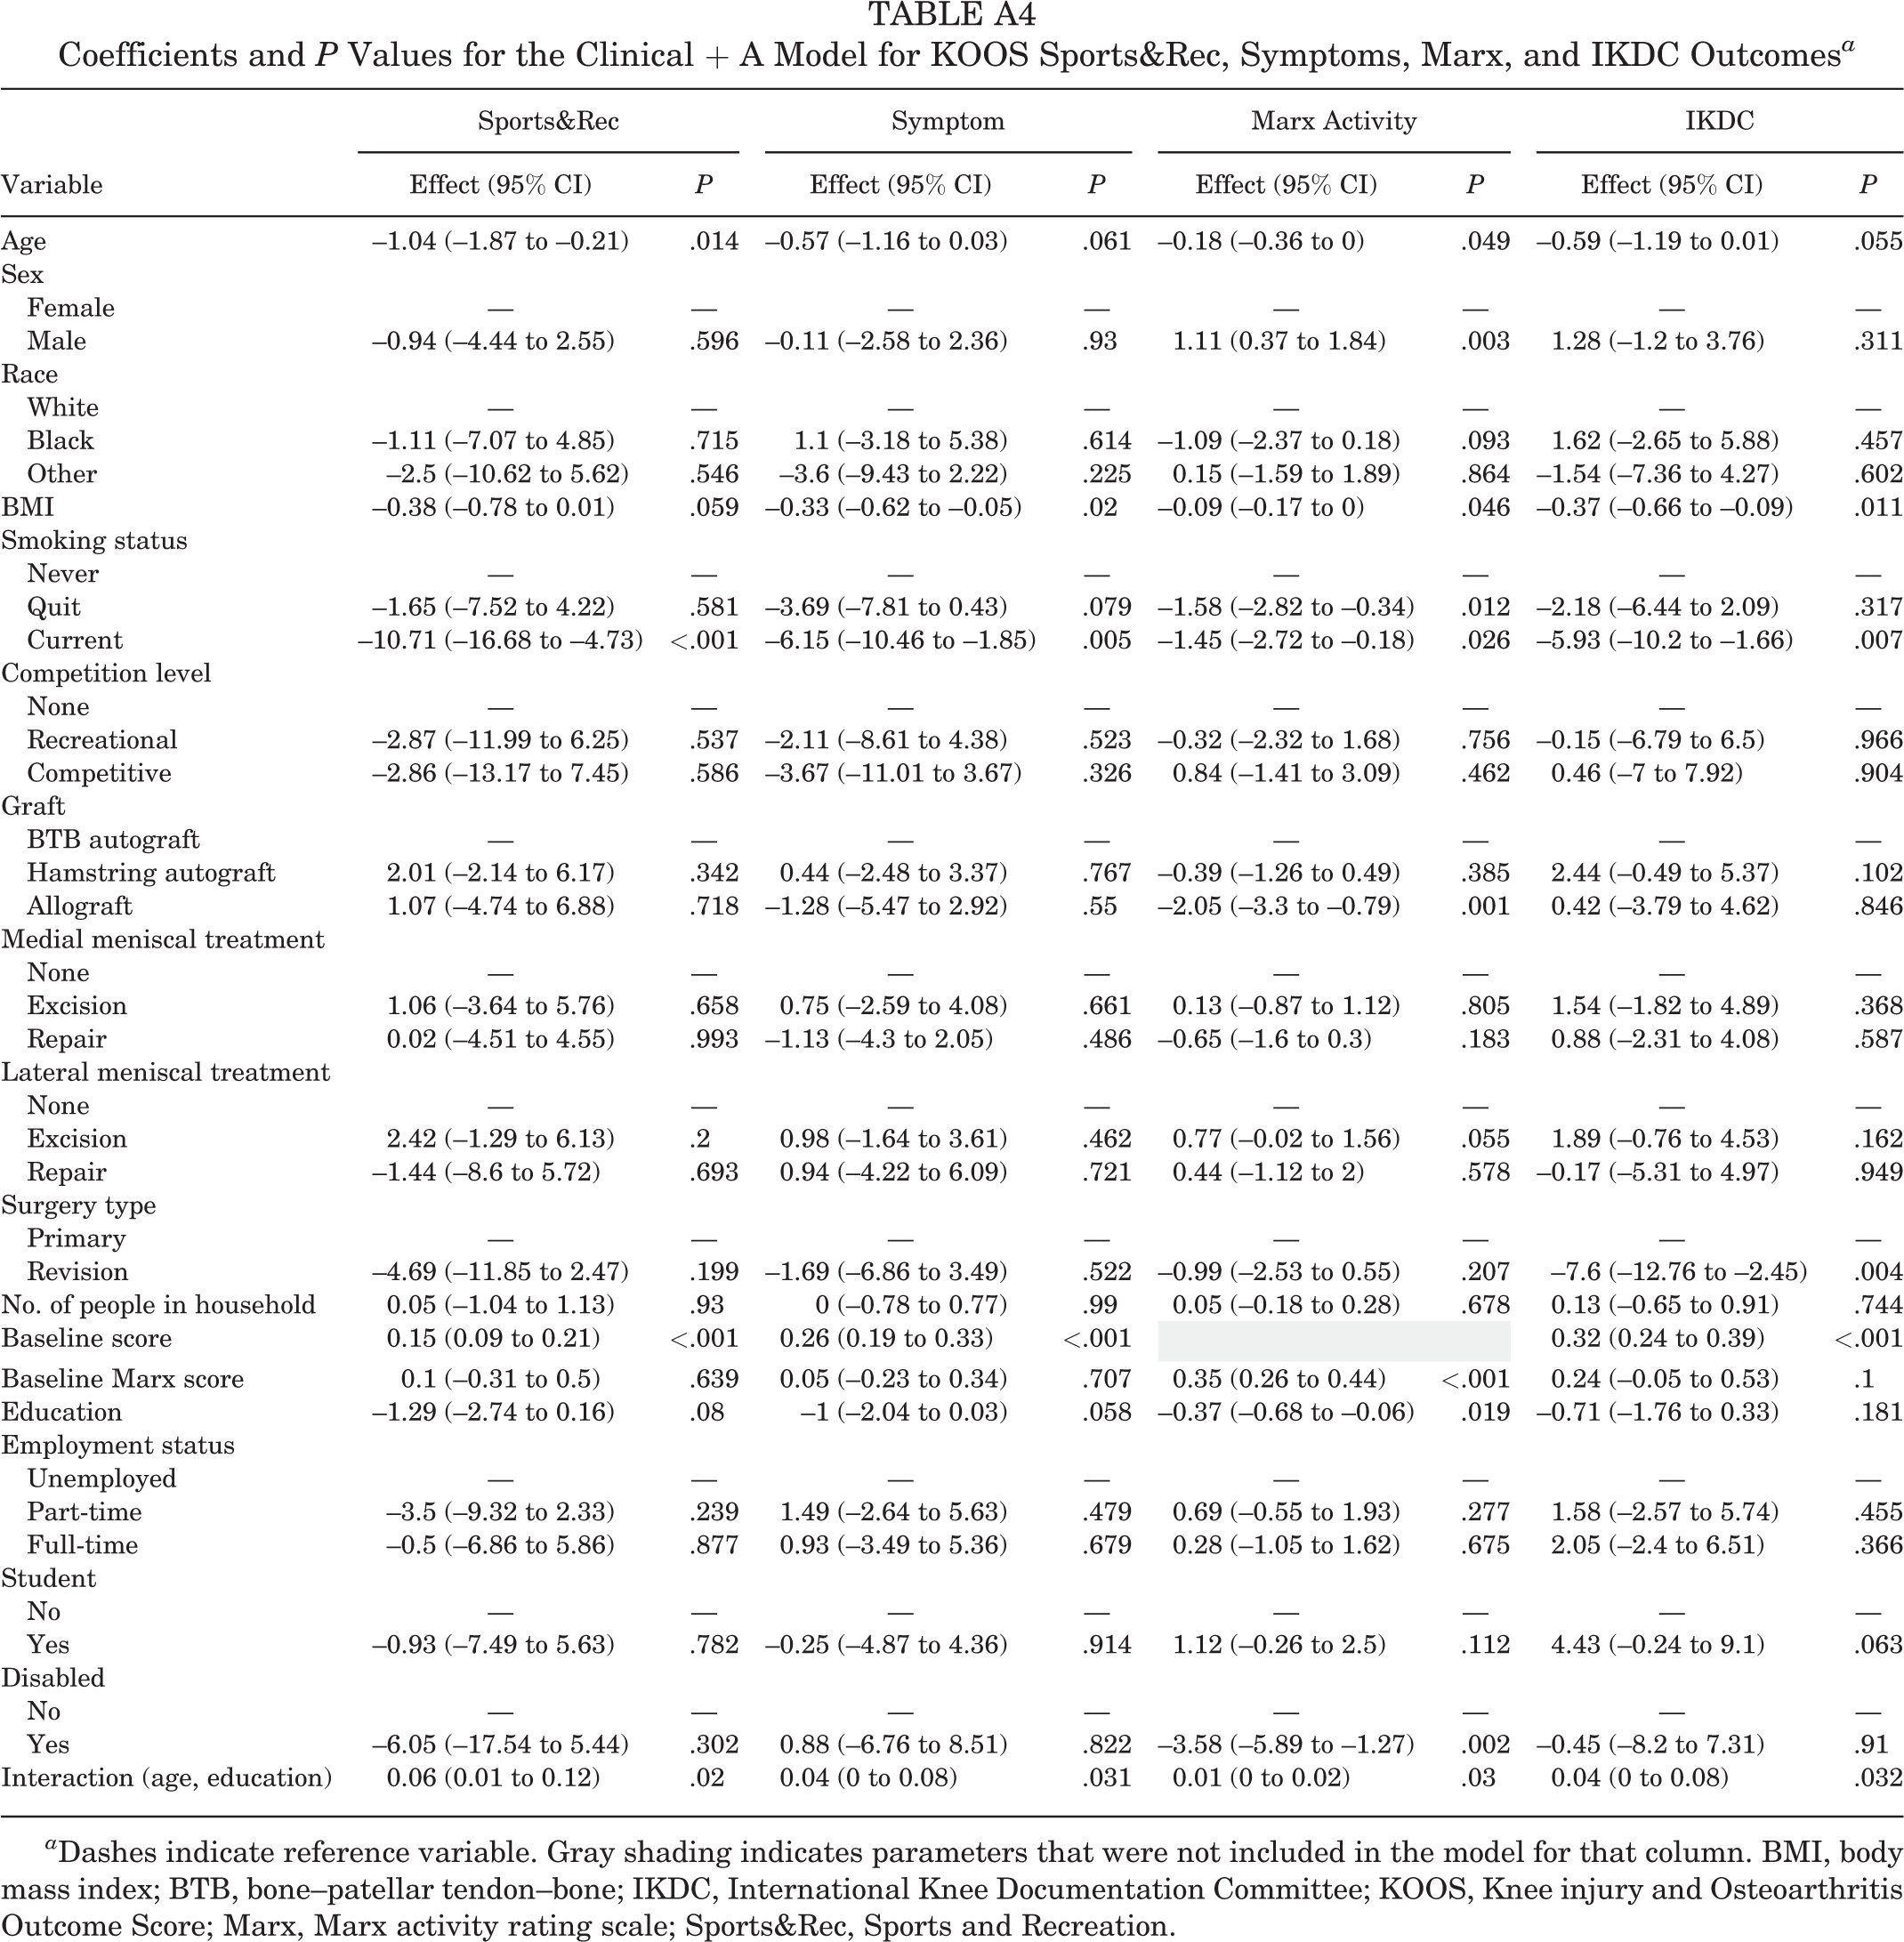
Tables 5 through 7 show coefficients for socioeconomic variables retained in the final models. Coefficients for the A variables are not reported if the addition of these variables did not improve the model. Of note, in the models that included the A variables but not the SES index, the interaction term between age and education was significant (P < .04) for the Marx, the IKDC, and all of the KOOS subscales except ADL. For more detailed information, see Appendix Tables A1 through A4. A representative nomogram for predicting IKDC score is presented in Figure 2 to give a visual representation of the relative contribution of each baseline factor to 2-year outcome. The remaining nomograms can be found in Appendix Figures A1 through A6.
Coefficients and P Values for the Best Model for KOOS ADL and QoL Outcomes a

a Dashes indicate reference variable. Bolded P values indicate statistical significance compared with reference variable. ADL, Activities of Daily Living; BMI, body mass index; BTB, bone–patellar tendon–bone; KOOS, Knee injury and Osteoarthritis Outcome Score; Marx, Marx activity rating scale; QoL, Quality of Life; SES, socioeconomic status.
Coefficients and P Values for the Best Model for KOOS Pain, Sports and Recreation, and Symptoms Outcomes a

a Dashes indicate reference variable. Bolded P values indicate statistical significance compared with reference variable. Gray shading indicates parameters that were not included in the model for that column. BMI, body mass index; BTB, bone–patellar tendon–bone; KOOS, Knee injury and Osteoarthritis Outcome Score; Marx, Marx activity rating scale; SES, socioeconomic status; Sports&Rec, Sports and Recreation.
Coefficients and P Values for the Best Model for Marx and IKDC Outcomes a
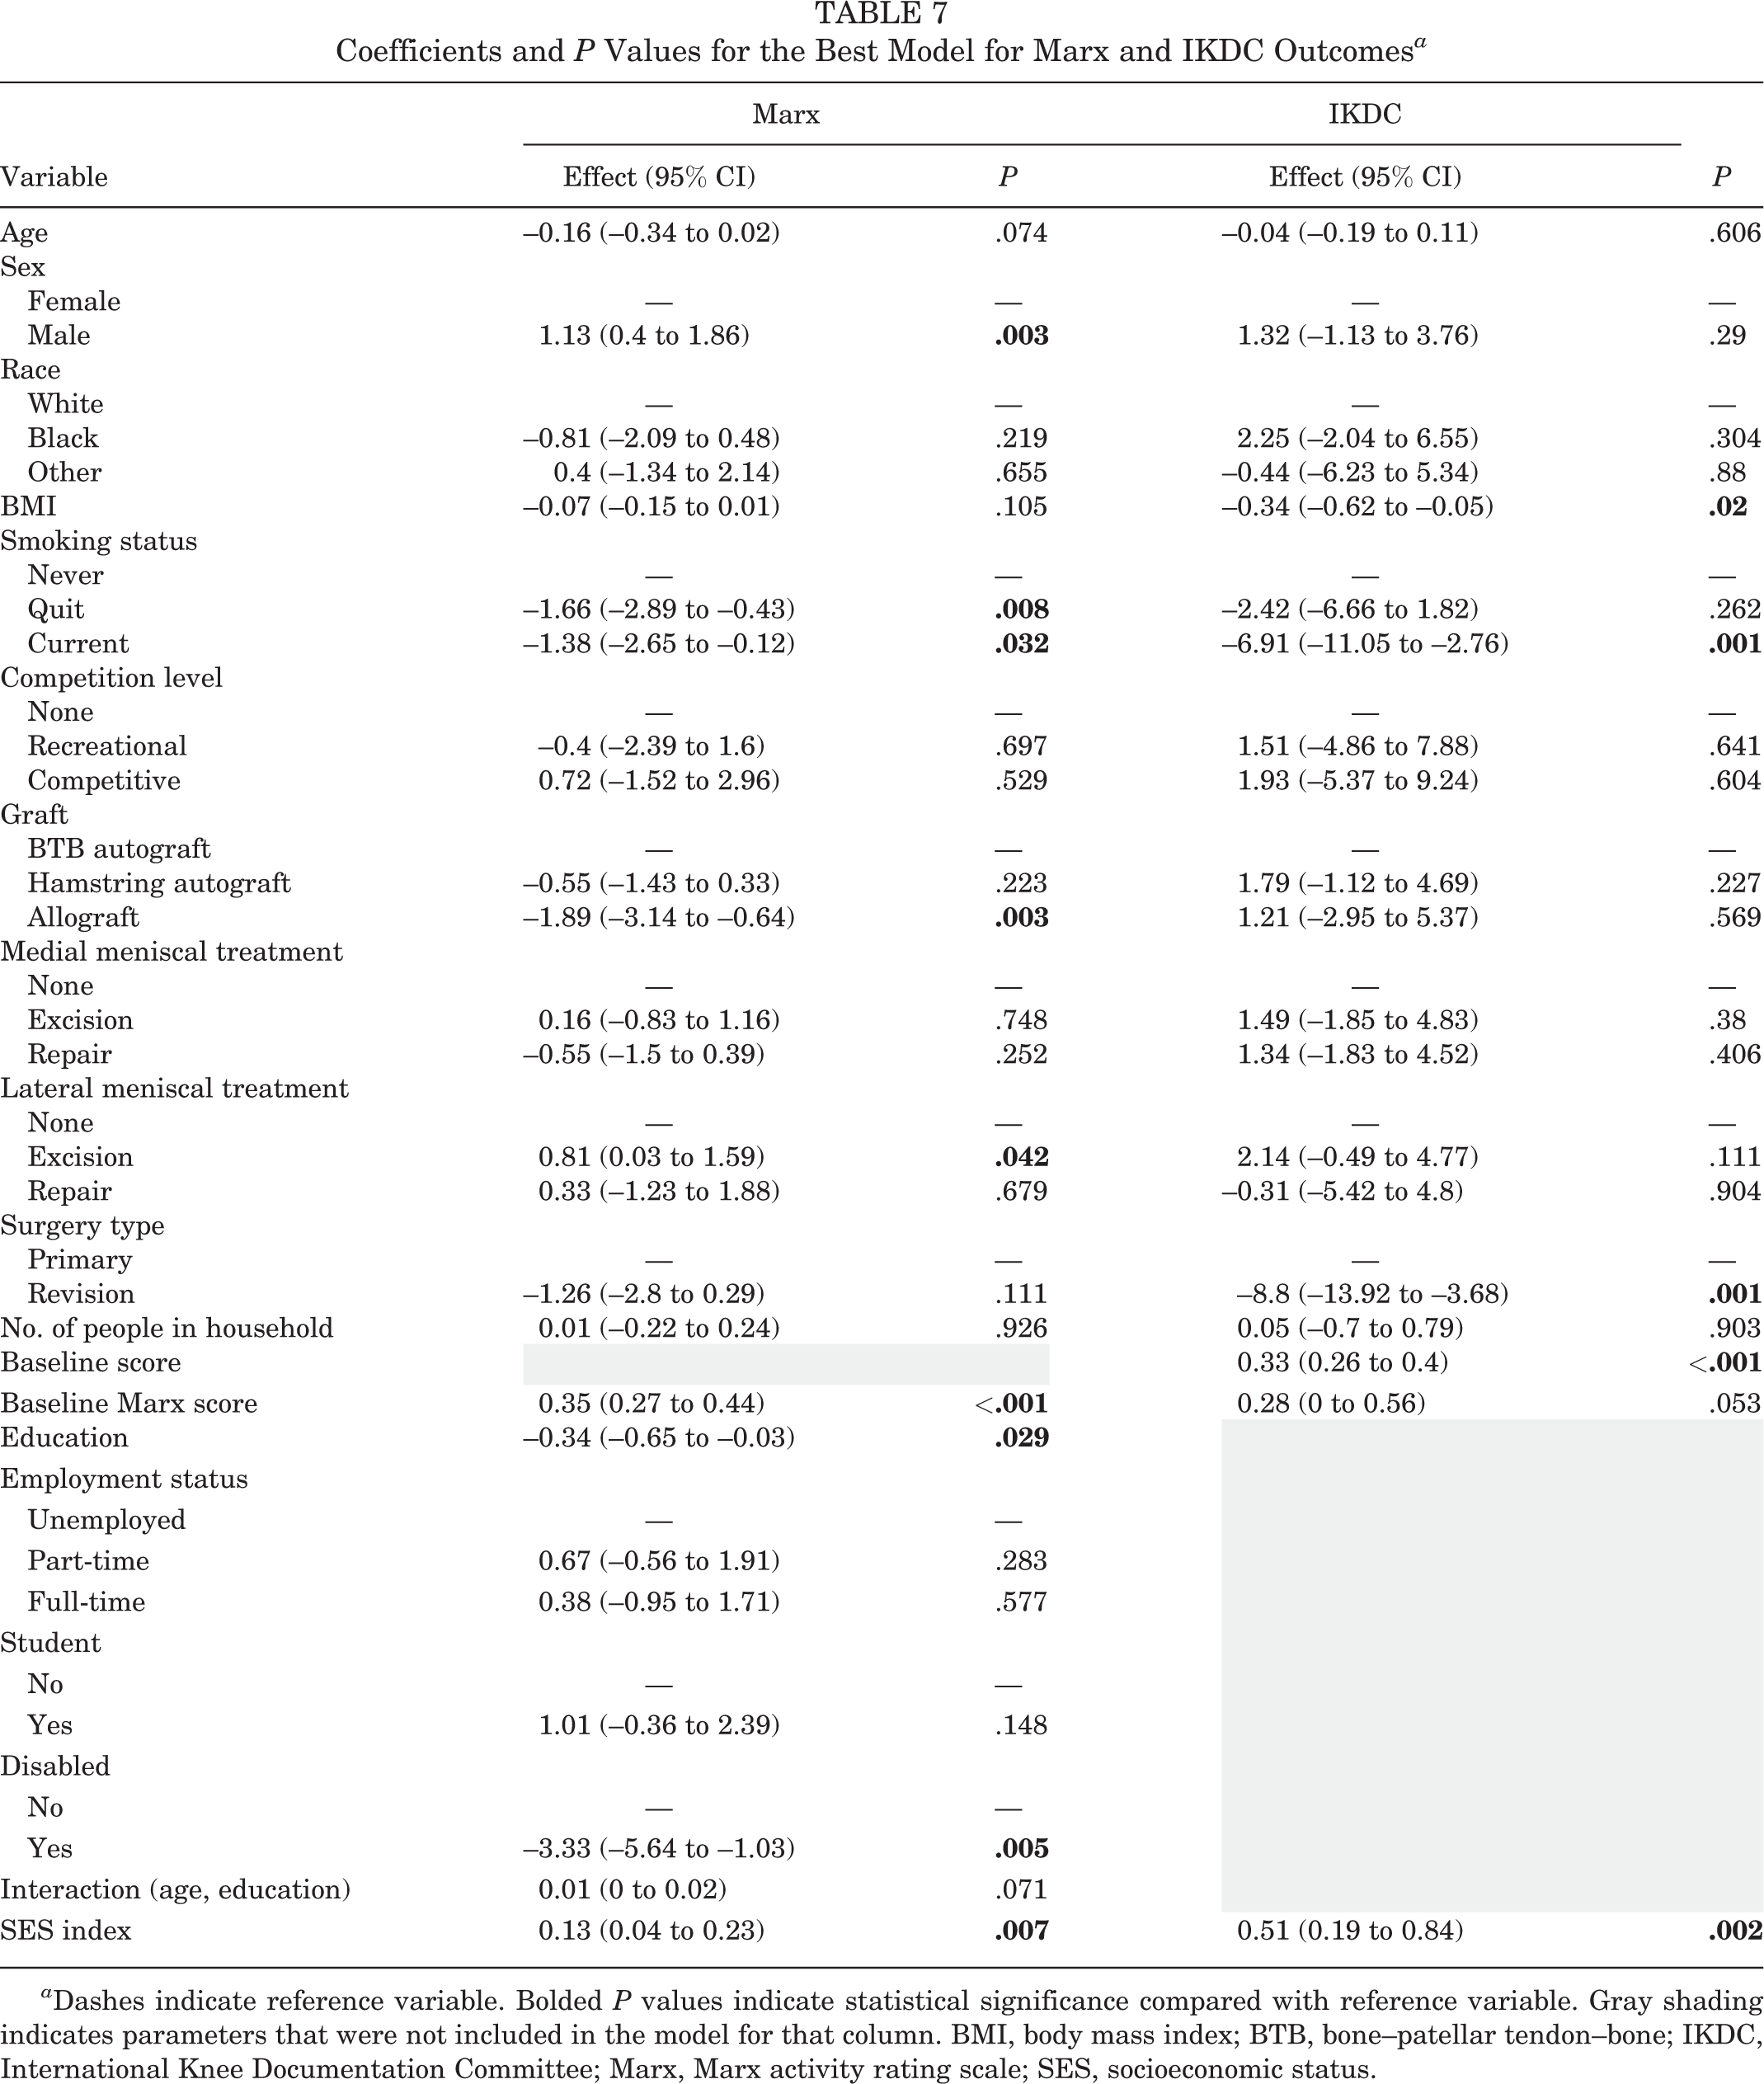
a Dashes indicate reference variable. Bolded P values indicate statistical significance compared with reference variable. Gray shading indicates parameters that were not included in the model for that column. BMI, body mass index; BTB, bone–patellar tendon–bone; IKDC, International Knee Documentation Committee; Marx, Marx activity rating scale; SES, socioeconomic status.

Nomogram for International Knee Documentation Committee (IKDC) score. BMI, body mass index; BTB, bone–patellar tendon–bone; SES, socioeconomic status.
Figure 3 presents boxplots that show the difference in distribution and mean for each PRO score between the lowest 10% and highest 10% of SES index values. A broader distribution of values is seen for patients with the lowest SES index, and the mean difference exceeds the minimal clinically important difference for the majority of PROs.

Boxplots depicting the distribution difference between the bottom 10% and top 10% of the SES group, stratified by 2-year patient-reported outcomes (KOOS subscales, IKDC, Marx). ADL, Activities of Daily Living; IKDC, International Knee Documentation Committee; Marx, Marx activity rating scale; QoL, Knee-related Quality of Life; SES, socioeconomic status; Sports&Rec, Sports and Recreation.
Discussion
Our analysis demonstrates that socioeconomic variables are significant predictors of PRO after ACL reconstruction and that the interaction between age and education level should be evaluated in this patient population because of the large proportion of students who undergo ACL surgery. Our findings also show that neighborhood factors are important predictors of outcome, in addition to the patient factors that are traditionally captured in clinical outcomes research. Furthermore, greater variation was seen in the outcomes of patients with the lowest SES. This suggests that improving access to care in neighborhoods with lower SES may provide an opportunity to lessen this variability and improve patient outcomes and that, when possible, future studies of outcomes after ACL reconstruction should include a measure of neighborhood SES. To our knowledge, this is the first study to evaluate the impact of SES on PRO after ACL reconstruction using both individual and neighborhood measures.
Multiple studies have evaluated the relationship between SES and orthopaedic outcomes. In a nationwide study of 25,354 elderly patients with hip fracture conducted in Denmark, patients with higher education levels and higher family incomes had lower rates of readmission and lower 30-day mortality rates. 13 In a Swedish study that examined the relationships between education level, household income, and likelihood of undergoing surgical treatment for cruciate ligament injury, the investigators found that patients with higher family income and/or education level were more likely to undergo surgical treatment. 16
Insurance status has been used as a surrogate for SES to evaluate the relationship between SES and outcome after orthopaedic procedures. For example, Sabesan and colleagues 17 showed that patients with Medicaid had a higher risk of complications and higher total charges after treatment of proximal humeral fractures. We did not prospectively record insurance status for our patients and could not reliably obtain this information retrospectively, so our analysis did not account for this variable.
Previous studies from our cohort have shown that nonwhite race predicts worse outcome after ACL reconstruction. 6,10 However, the relationship between race and outcome is confounded by SES. For example, in a systematic review of studies that reported revision rates after total knee replacement, a significant relationship was seen between race and outcome only in the study that did not adjust for insurance payer status. 2 Likewise, in the current study, race was not an independent predictor of outcome after the addition of socioeconomic variables.
Several potentially modifiable risk factors may be associated with differences in neighborhood SES but were not captured or analyzed in our current study. These include delays in accessing care (including office visits, diagnostic testing, surgery, and physical therapy) due to insurance access, transportation, or job status; differences in comorbidities between people in different neighborhoods; differences in sports and exercise participation; and differences in overall activity level. This study was performed prior to the Affordable Care Act, and any effect of this act on improving access to health care is unknown. These factors would make excellent topics for future study.
Conclusion
This is the first study to examine the impact of SES, using both individual and neighborhood measures, on PRO following ACL reconstruction surgery. We showed that neighborhood SES is associated with worse PRO after ACL reconstruction, with greater variability in outcome in the patients at the lowest end of the socioeconomic spectrum. In addition, we found that the effect of education on outcome varies with patient age in this population.
Future studies in the ACL reconstruction population should account for neighborhood SES when adjusting for confounding factors and should attempt to identify the modifiable risk factors for worse outcome in patients from low SES neighborhoods. That way, these patients can potentially be offered special interventions to improve their outcomes.
Footnotes
One or more of the authors has declared the following potential conflict of interest or source of funding: Research reported in this publication was partially supported by the National Institute of Arthritis and Musculoskeletal and Skin Diseases of the National Institutes of Health under award numbers K23AR066133 (to M.H.J.) and R01AR053684 (to K.P.S.). The content is solely the responsibility of the authors and does not necessarily represent official views of the National Institutes of Health. K.P.S. has received consulting fees from Cytori and hospitality payments from DePuy. AOSSM checks author disclosures against the Open Payments Database (OPD). AOSSM has not conducted an independent investigation on the OPD and disclaims any liability or responsibility relating thereto.
Appendix
Coefficients and P Values for the Clinical + A Model for KOOS Sports&Rec, Symptoms, Marx, and IKDC Outcomes a
| Variable | Sports&Rec | Symptom | Marx Activity | IKDC | ||||
|---|---|---|---|---|---|---|---|---|
| Effect (95% CI) | P | Effect (95% CI) | P | Effect (95% CI) | P | Effect (95% CI) | P | |
| Age | –1.04 (–1.87 to –0.21) | .014 | –0.57 (–1.16 to 0.03) | .061 | –0.18 (–0.36 to 0) | .049 | –0.59 (–1.19 to 0.01) | .055 |
| Sex | ||||||||
| Female | — | — | — | — | — | — | — | — |
| Male | –0.94 (–4.44 to 2.55) | .596 | –0.11 (–2.58 to 2.36) | .93 | 1.11 (0.37 to 1.84) | .003 | 1.28 (–1.2 to 3.76) | .311 |
| Race | ||||||||
| White | — | — | — | — | — | — | — | — |
| Black | –1.11 (–7.07 to 4.85) | .715 | 1.1 (–3.18 to 5.38) | .614 | –1.09 (–2.37 to 0.18) | .093 | 1.62 (–2.65 to 5.88) | .457 |
| Other | –2.5 (–10.62 to 5.62) | .546 | –3.6 (–9.43 to 2.22) | .225 | 0.15 (–1.59 to 1.89) | .864 | –1.54 (–7.36 to 4.27) | .602 |
| BMI | –0.38 (–0.78 to 0.01) | .059 | –0.33 (–0.62 to –0.05) | .02 | –0.09 (–0.17 to 0) | .046 | –0.37 (–0.66 to –0.09) | .011 |
| Smoking status | ||||||||
| Never | — | — | — | — | — | — | — | — |
| Quit | –1.65 (–7.52 to 4.22) | .581 | –3.69 (–7.81 to 0.43) | .079 | –1.58 (–2.82 to –0.34) | .012 | –2.18 (–6.44 to 2.09) | .317 |
| Current | –10.71 (–16.68 to –4.73) | <.001 | –6.15 (–10.46 to –1.85) | .005 | –1.45 (–2.72 to –0.18) | .026 | –5.93 (–10.2 to –1.66) | .007 |
| Competition level | ||||||||
| None | — | — | — | — | — | — | — | — |
| Recreational | –2.87 (–11.99 to 6.25) | .537 | –2.11 (–8.61 to 4.38) | .523 | –0.32 (–2.32 to 1.68) | .756 | –0.15 (–6.79 to 6.5) | .966 |
| Competitive | –2.86 (–13.17 to 7.45) | .586 | –3.67 (–11.01 to 3.67) | .326 | 0.84 (–1.41 to 3.09) | .462 | 0.46 (–7 to 7.92) | .904 |
| Graft | ||||||||
| BTB autograft | — | — | — | — | — | — | — | — |
| Hamstring autograft | 2.01 (–2.14 to 6.17) | .342 | 0.44 (–2.48 to 3.37) | .767 | –0.39 (–1.26 to 0.49) | .385 | 2.44 (–0.49 to 5.37) | .102 |
| Allograft | 1.07 (–4.74 to 6.88) | .718 | –1.28 (–5.47 to 2.92) | .55 | –2.05 (–3.3 to –0.79) | .001 | 0.42 (–3.79 to 4.62) | .846 |
| Medial meniscal treatment | ||||||||
| None | — | — | — | — | — | — | — | — |
| Excision | 1.06 (–3.64 to 5.76) | .658 | 0.75 (–2.59 to 4.08) | .661 | 0.13 (–0.87 to 1.12) | .805 | 1.54 (–1.82 to 4.89) | .368 |
| Repair | 0.02 (–4.51 to 4.55) | .993 | –1.13 (–4.3 to 2.05) | .486 | –0.65 (–1.6 to 0.3) | .183 | 0.88 (–2.31 to 4.08) | .587 |
| Lateral meniscal treatment | ||||||||
| None | — | — | — | — | — | — | — | — |
| Excision | 2.42 (–1.29 to 6.13) | .2 | 0.98 (–1.64 to 3.61) | .462 | 0.77 (–0.02 to 1.56) | .055 | 1.89 (–0.76 to 4.53) | .162 |
| Repair | –1.44 (–8.6 to 5.72) | .693 | 0.94 (–4.22 to 6.09) | .721 | 0.44 (–1.12 to 2) | .578 | –0.17 (–5.31 to 4.97) | .949 |
| Surgery type | ||||||||
| Primary | — | — | — | — | — | — | — | — |
| Revision | –4.69 (–11.85 to 2.47) | .199 | –1.69 (–6.86 to 3.49) | .522 | –0.99 (–2.53 to 0.55) | .207 | –7.6 (–12.76 to –2.45) | .004 |
| No. of people in household | 0.05 (–1.04 to 1.13) | .93 | 0 (–0.78 to 0.77) | .99 | 0.05 (–0.18 to 0.28) | .678 | 0.13 (–0.65 to 0.91) | .744 |
| Baseline score | 0.15 (0.09 to 0.21) | <.001 | 0.26 (0.19 to 0.33) | <.001 | 0.32 (0.24 to 0.39) | <.001 | ||
| Baseline Marx score | 0.1 (–0.31 to 0.5) | .639 | 0.05 (–0.23 to 0.34) | .707 | 0.35 (0.26 to 0.44) | <.001 | 0.24 (–0.05 to 0.53) | .1 |
| Education | –1.29 (–2.74 to 0.16) | .08 | –1 (–2.04 to 0.03) | .058 | –0.37 (–0.68 to –0.06) | .019 | –0.71 (–1.76 to 0.33) | .181 |
| Employment status | ||||||||
| Unemployed | — | — | — | — | — | — | — | — |
| Part-time | –3.5 (–9.32 to 2.33) | .239 | 1.49 (–2.64 to 5.63) | .479 | 0.69 (–0.55 to 1.93) | .277 | 1.58 (–2.57 to 5.74) | .455 |
| Full-time | –0.5 (–6.86 to 5.86) | .877 | 0.93 (–3.49 to 5.36) | .679 | 0.28 (–1.05 to 1.62) | .675 | 2.05 (–2.4 to 6.51) | .366 |
| Student | ||||||||
| No | — | — | — | — | — | — | — | — |
| Yes | –0.93 (–7.49 to 5.63) | .782 | –0.25 (–4.87 to 4.36) | .914 | 1.12 (–0.26 to 2.5) | .112 | 4.43 (–0.24 to 9.1) | .063 |
| Disabled | ||||||||
| No | — | — | — | — | — | — | — | — |
| Yes | –6.05 (–17.54 to 5.44) | .302 | 0.88 (–6.76 to 8.51) | .822 | –3.58 (–5.89 to –1.27) | .002 | –0.45 (–8.2 to 7.31) | .91 |
| Interaction (age, education) | 0.06 (0.01 to 0.12) | .02 | 0.04 (0 to 0.08) | .031 | 0.01 (0 to 0.02) | .03 | 0.04 (0 to 0.08) | .032 |
a Dashes indicate reference variable. Gray shading indicates parameters that were not included in the model for that column. BMI, body mass index; BTB, bone–patellar tendon–bone; IKDC, International Knee Documentation Committee; KOOS, Knee injury and Osteoarthritis Outcome Score; Marx, Marx activity rating scale; Sports&Rec, Sports and Recreation.