
Abstract
Background:
Weightbearing cone beam computed tomography (WB CBCT) allows detailed 3-dimensional imaging of the foot and ankle in a weightbearing state and provides improved accuracy and reliability of foot alignment measures, especially when compared with conventional radiographic views.
Purpose:
To describe the foot alignment in National Basketball Association (NBA) players with different symptomatic foot and ankle injuries using WB CBCT and to determine if any predominant morphotype would be identified.
Study Design:
Cross-sectional study; Level of evidence, 3.
Methods:
A total of 45 active NBA players (mean age, 24.4 years [range, 20-34 years]; N = 54 feet [29 right, 25 left]) were assessed using WB CBCT. Measurements included the following: (1) foot and ankle offset (FAO), (2) calcaneal offset (CO), (3) hindfoot alignment angle (HAA), (4) angle between the inferior and superior facets of the talus (Inftal-Suptal), (5) angle between the inferior facet of the talus and the horizontal floor line (Inftal-Hor), (6) forefoot arch angle (FAA), (7) navicular-to-floor distance, and (8) medial cuneiform–to-floor distance. Measurements were then compared with values available in the literature for a “normal” foot morphotype.
Results:
Among the 54 feet, the mean FAO was 0.48% (95% CI, –0.25% to 1.21%), the mean CO was 1.18 mm (95% CI, –0.50 to 2.87 mm), and the mean HAA was 1.42° (95% CI, –0.80° to 3.65°). The mean Inftal-Suptal angle was 5.31° (95% CI, 3.50°-7.12°), while the mean Inftal-Hor angle was 4.04° (95% CI, 2.56°-5.51°). The mean FAA was 15.84° (95% CI, 14.73°-16.92°), the mean navicular-to-floor distance was 38.30 mm (95% CI, 36.19-40.42 mm), and the mean medial cuneiform–to-floor distance was 26.79 mm (95% CI, 25.30-28.28 mm). None of these values were found to be significantly different when comparing forwards, guards, and centers.
Conclusion:
NBA players presenting with symptomatic foot and ankle injuries had a fairly “normal” foot morphology, with a tendency toward a varus hindfoot and a high-arched morphotype. No significant differences were found between players based on their position on the court. WB CBCT may help to shed light on anatomic risk factors for common injuries in professional players and may aid in the planning of specific prevention programs.
Professional basketball players who sustain lower extremity injuries may experience a significant reduction in playing time and decrease in performance, and in some cases, these injuries can be career ending. 1,24 Evidence has shown that movements specific to basketball such as jumping, sudden acceleration, and lateral cutting movements, together with the risk of collision, are associated with a marked increased risk of injuries. 22 These injuries most commonly involve the ankle and knee. 13 More specifically, foot and ankle injuries were found to account for 27% of total musculoskeletal injuries in competitive professional and collegiate athletes, with 21% of these injuries resulting in missed playing time. 14 It has also been estimated that 85% of basketball players experience at least 1 ankle sprain during the course of their career. 21,22 With these injury rates in mind, many have and are investigating potential risk and prognostic factors for these elite-level athletes. 18,23,32,35 Regarding injuries of the foot and ankle, varus hindfoot alignment in elite athletes has been reported as a predisposing factor for Jones-type metaphyseal-diaphyseal fractures and refractures of the fifth metatarsal. 5,11,28 A possible association between metatarsus adductus and stress fractures of the base of the fourth metatarsal has also been described. 31 In addition, a high-arched or cavus foot and metatarsus adductus have been proposed as risk factors for Lisfranc injuries and stress fractures of the tarsal bones, respectively. 26,31
Historically, assessments of foot alignment have relied on conventional radiographic views. Standard radiographs are however inherently limited, as they only illustrate the anatomy in a 2-dimensional (2D) manner and can be flawed by errors from patient and x-ray beam positioning, image superpositioning, and potential measurement errors. 3,17,33,37 Interestingly, the introduction and subsequent increased use of weightbearing cone beam computed tomography (WB CBCT) in clinical practice seem to have addressed many of the issues encountered with standard radiographs, allowing a better 3-dimensional (3D) assessment of the foot and ankle. 2,20,36 WB CBCT produces images comparable with traditional CT in quality but does so with the foot in a loaded condition and with a markedly lower radiation dose. 6,30 Many authors have recently demonstrated the efficacy and reliability of WB CBCT in different foot alignment measures 9,10,20,29,30 ; however, to the best of our knowledge, there has not been an investigation on professional basketball.
In this study, we described the foot morphology in a cohort of National Basketball Association (NBA) players who presented to our institution with different foot and ankle injuries, by means of different parameters of foot alignment measured on WB CBCT. We also compared our results with reference data for the same measures performed on “normal” feet and flatfeet obtained from the most recently available literature. In addition, we investigated any potential differences among players based on their position on the court by considering forwards, centers, and guards separately.
Methods
Data Collection
The data used for this study were obtained as part of routine clinical care of NBA players with symptomatic foot and ankle injuries who underwent WB CBCT from September 2013 through November 2017. Institutional review board approval was obtained for the review of these data. The images of 54 feet (29 right, 25 left) from 45 NBA players (mean age, 24.4 years [range, 20-34 years]) were retrospectively reviewed.
All images were obtained using a pedCAT unit (CurveBeam) installed in the outpatient clinic of an orthopaedic foot and ankle surgery referral center. The data sets were obtained using the following cone beam scanner settings: voxel size, 0.37 mm; field-of-view diameter, 350 mm; field-of-view height, 200 mm; exposure time, 9 seconds; and total scan time, 54 seconds. The data sets were extracted from an existing database containing 3D image data (Figure 1) as well as demographics related to age, side, and body mass index.

Example of 3-dimensional weightbearing cone beam computed tomography data set of a National Basketball Association player demonstrating a neutrally aligned hindfoot and slightly increased foot arch.
Measurements
For this study, both semiautomatic and manual measurements of foot alignment were obtained.
Semiautomatic Measurements
Data sets were screened using the built-in tool TALAS in CubeVue software (CurveBeam), and the 3D coordinates of specific anatomic landmarks required for the software to process and calculate the foot and ankle offset (FAO) were collected as described by Lintz et al. 20 This included the most distal weightbearing voxel of the head of the first metatarsal, head of the fifth metatarsal, and calcaneal tuberosity as well as the most proximal and central aspects of the talar dome (Figure 2).

Marking of 3-dimensional coordinates of specific anatomic landmarks: (A) most distal weightbearing vortex of the head of the first metatarsal, (B) most distal weightbearing vortex of the head of the fifth metatarsal, (C) most distal weightbearing vortex of the calcaneal tuberosity, and (D) most proximal and central aspects of the talar dome.
The FAO was described as a 3D offset measurement of the torque acting in the ankle joint as a result of body weight and ground-reaction forces. 19,20 It takes into consideration the relationship between the center of gravity of the tripod of the foot and the center of the ankle joint, represented by the apex of the talar dome. Negative measurements indicate that the center of the ankle joint lies laterally to the bisecting line of the foot tripod (varus alignment); positive values indicate that the center of the ankle joint is positioned medially to the bisecting line of the foot tripod (valgus alignment) (Figure 3).

Example of semiautomatic measurements using TALAS in CubeVue (CurveBeam). Three-dimensional coordinates (x, y, z planes) were collected for the first (Met1) and fifth (Met5) metatarsals, the calcaneus, and the talus. The tripod is represented by the triangle formed by the coordinates of M1 (first metatarsal), M5 (fifth metatarsal), and C (calcaneus). F represents the ideal position of the center of rotation of the ankle joint that lies on a bisecting line of the tripod. T represents the position of the most proximal and central aspects of the talus, the center of the ankle joint. In this specific patient, this point is positioned medially to the M1 point, demonstrating important valgus alignment of this hindfoot. CO, calcaneal offset; FAO, foot and ankle offset; HA, hindfoot alignment angle.
The mean FAO in asymptomatic patients with a normally aligned foot is described to be 2.3% ± 2.9%, 14 and this value was used as a reference for the current study. Other recorded measurements were the calcaneal offset (CO) and hindfoot alignment angle (HAA). The CO represents the distance (in mm) between a theoretically neutral position of the calcaneus and the actual position of the calcaneus. The HAA represents an estimate of coronal angular alignment of the hindfoot and is measured as the angle formed by 3 points: the apex of the center of the talar dome projected on the floor plane (as the vertex), the ideal position of the calcaneus, and the actual position of the calcaneus.
Manual Measurements
In the coronal plane, 3 angles were measured. The first 2 included the angle between the inferior aspect of the posterior facet of the talus at the subtalar joint and 2 reference lines: 1 horizontal line representing the floor (Inftal-Hor) and a tangent line to the superior aspect of the talar dome (Inftal-Suptal), as described by Probasco et al. 27 Both angles evaluate the orientation of the subtalar joint. The coronal plane in which the measurements were obtained was determined in the sagittal plane at the midpoint of the longitudinal length of the posterior facet of the subtalar joint. For these angles, positive values indicate valgus alignment and negative values indicate varus alignment.
The third angle measured in the coronal plane was the forefoot arch angle (FAA) as described by Ferri et al. 12 It measures the height of the transverse arch of the foot and relative supination/pronation of the forefoot. Positive values indicate relatively higher positioning of the medial cuneiform in relation to the fifth metatarsal.
Two linear measurements, both of which were used to evaluate the height of the transverse and longitudinal arches of the foot, were also recorded. The first was the navicular-to-floor distance, measured from the most inferior aspect of the navicular to the floor line, as described by Ferri et al. 12 The second was the medial cuneiform–to-floor distance, measured from the most inferior aspect of the medial cuneiform to the floor line. For all the manual measurements, standard values from the most recent literature were gathered and used in the comparison of normally aligned feet, varus and valgus alignment of the hindfoot, and flattening or elevation of the arch of the foot. 10,12,27 Examples of manual measurements are demonstrated in Figure 4.
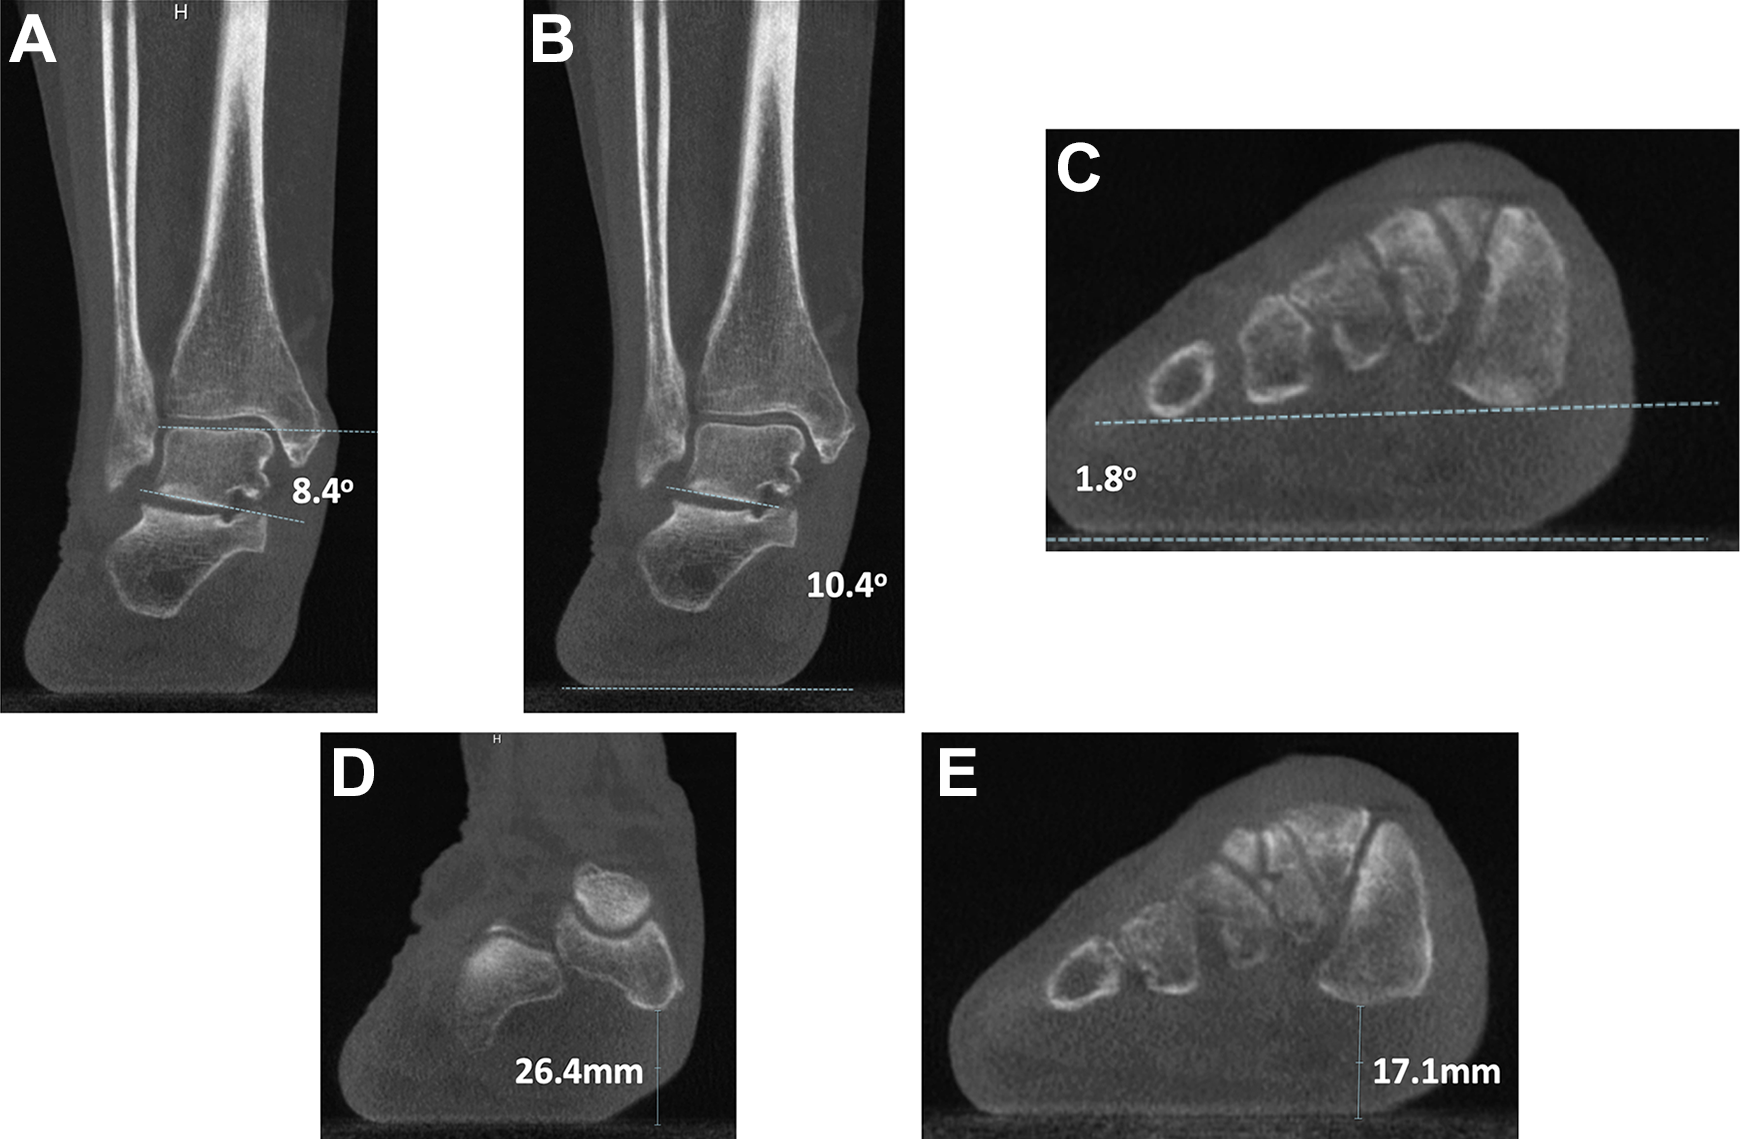
Example of manual measurements. (A) Inftal-Suptal angle: angle between the inferior aspect of the posterior facet of the talus and a tangent line to the superior aspect of the talar dome; (B) Inftal-Hor angle: angle between the inferior aspect of the posterior facet of the talus and a tangent line to the floor; (C) forefoot arch angle: angle between a line connecting the most inferior aspects of the medial cuneiform and proximal fifth metatarsal and a tangent line to the floor; (D) navicular-to-floor distance: shortest distance between the navicular and the floor; and (E) medial cuneiform–to-floor distance: shortest distance between the medial cuneiform and the floor.
Statistical Analysis
Summarized data are presented as absolute numbers, percentages, means, and 95% CIs. Analyses of variance with the Bonferroni test were conducted to estimate the association between playing position (pooled into 3 groups: forwards, guards, and centers) and the different alignment measurements assessed on WB CBCT images. The alpha level was set to .05. All analyses were performed using JMP statistical software (version 13.0.0; SAS Institute).
Results
Player demographics and player injuries are outlined in Tables 1 and 2, respectively. Among the 54 feet, the mean FAO was 0.48% (95% CI, –0.25% to 1.21%), the mean CO was 1.18 mm (95% CI, –0.50 to 2.87 mm), and the mean HAA was 1.42° (95% CI, –0.80° to 3.65°). The mean Inftal-Suptal angle was 5.31° (95% CI, 3.50°-7.12°), while the mean Inftal-Hor angle was 4.04° (95% CI, 2.56°-5.51°). The mean FAA was 15.84° (95% CI, 14.73°-16.92°), the mean navicular-to-floor distance was 38.30 mm (95% CI, 36.19-40.42 mm), and the mean medial cuneiform–to-floor distance was 26.79 mm (95% CI, 25.30-28.28 mm). The comparison between our results and standard control data available in the literature is presented in Table 3. With regard to player position, none of the variables examined differed significantly among forwards, guards, and centers (Table 4).
Characteristics of Players a
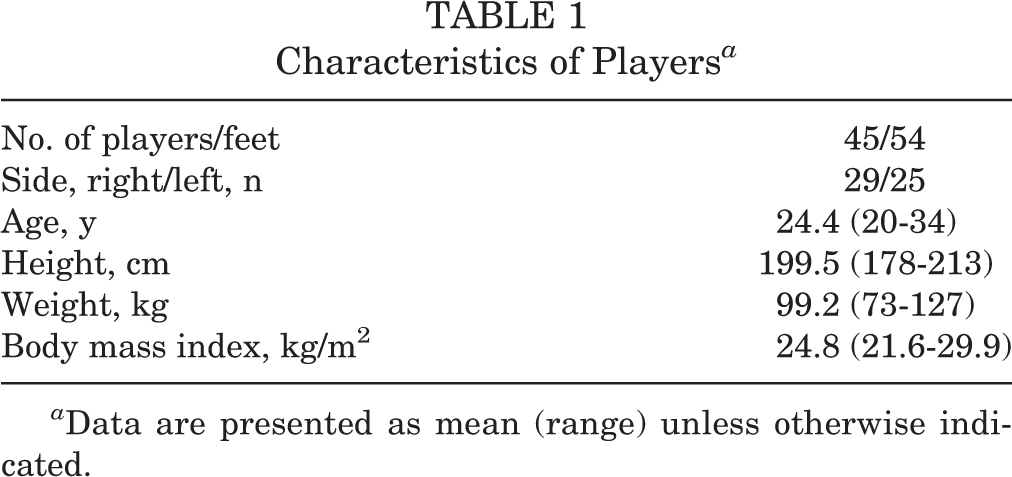
a Data are presented as mean (range) unless otherwise indicated.
Injuries of Players (N = 54 Feet)

Measurements of NBA Players Compared With Controls a

a Data are presented as mean (95% CI). Standard control data were gathered from the available literature. CO, calcaneal offset; FAA, forefoot arch angle; FAO, foot and ankle offset; HAA, hindfoot alignment angle; Inftal-Hor, angle between the inferior aspect of the posterior facet of the talus and the horizontal floor line; Inftal-Suptal, angle between the inferior aspect of the posterior facet of the talus and superior aspect of the talar dome; NA, not available; NBA, National Basketball Association.
b Variables for which more than 1 reference value was available in the literature.
c Simulated weightbearing.
Measurements by Playing Position Using the Bonferroni Test a

a “Difference” indicates the difference in mean values. CO, calcaneal offset; FAA, forefoot arch angle; FAO, foot and ankle offset; HAA, hindfoot alignment angle; Inftal-Hor, angle between the inferior aspect of the posterior facet of the talus and the horizontal floor line; Inftal-Suptal, angle between the inferior aspect of the posterior facet of the talus and superior aspect of the talar dome.
Discussion
To the best of our knowledge, this is the first time that reference values for foot morphotypes in professional NBA players have been reported in the literature, especially with the use of 3D WB CBCT. Notably, any available foot measurements have historically relied on conventional radiographic views. This approach is highly influenced by inherent potential flaws related to the evaluation of 2D imaging of a 3D structure. Errors in patient positioning, overlapping of different structures, and operator-related bias can limit the effectiveness of measurements on conventional radiographs. 3,17,33,37 The advent of WB CBCT allows clinicians to obtain images comparable with traditional CT but in a physiologically loaded condition and with a lower radiation dose. 30
Recent studies have also documented how the foot morphotype measurements utilized in the present study (such as the FAO, CO, HA, Inftal-Suptal angle, Inftal-Hor angle, FAA, navicular-to-floor distance, and medial cuneiform–to-floor distance) provide high intraobserver and interobserver reliability. 10,12,20,27 It is also important to emphasize that the concept of lever arms/offsets in orthopaedics is not new and that the use of semiautomatic 3D biometric measurements in foot and ankle injuries is well supported in the literature and has been progressively growing. 19,20,29
It has been shown in various previous studies that elite-level athletes have an increased risk for overuse or contact-related injuries when compared with the healthy and less physically active population. 1,24 Identifying risk and prognostic factors for foot and ankle injuries in professional players is a challenge and could have significant financial impact in the major leagues. 15,18,23,32,35 Our study demonstrated that professional male basketball players within the NBA appear to have a normally aligned hindfoot with a slight tendency toward a varus morphotype and a high-arched foot. No difference was found among athletes playing in different positions.
In professional basketball, the most common orthopaedic injuries leading to missed playing time occur in the knee, foot, and ankle. 13,22 Common risk factors already identified in the literature include previous injuries, game play as opposed to practices, player position, and single-sport participation. 23,32
A few authors have focused on the relationship between foot morphotype and specific foot and ankle injuries. The presence of varus hindfoot alignment, assessed both clinically and radiographically, has been described as a predisposing factor for Jones-type metaphyseal-diaphyseal fractures and refractures of the fifth metatarsal. 5,28 A possible association between metatarsus adductus and stress fractures of the base of the fourth metatarsal has also been identified. 31 Similarly, reports have linked high-arched cavus feet with a higher risk of Lisfranc injuries. 26 Also, a large prospective study on 449 military service members in training showed that dynamic pes planus, pes cavus, restricted ankle dorsiflexion, and increased hindfoot inversion were found to be associated with a higher risk of lower extremity overuse injuries. 16
Unfortunately, there are few studies in the available literature that assess foot morphotypes in professional athletes specifically. In a study of 151 competitive triathletes, the foot type, as assessed by the Foot Posture Index and valgus index, did not appear to be a risk factor for acute injuries of the foot and ankle; however, the authors found a 4-fold increased risk of overuse injuries in athletes with a supinated foot. 4 According to Lopezosa-Reca et al, 22 who investigated the Foot Posture Index in 220 basketball players, the foot morphotype was found to vary in players based on their position of play. Guards tended to have a more supinated foot, whereas centers presented with a more pronated foot. Interestingly, our results did not corroborate these findings, as we found no differences among playing positions for any of the variables we considered.
Within the literature, there exists some evidence suggesting that increased participation in high-impact sports during youth is associated with increased varus alignment of the knee at the end of growth in male patients, mainly because of the increased frequency of intense running and cutting maneuvers. 8,34 In addition, Norton et al 25 reported in a nonathletic population that compensatory valgus of the hindfoot could be expected in the setting of a varus knee. Whether opposite findings would be true in professional players of high-impact sports with varus knees has yet to be investigated.
Our study demonstrated that NBA players with symptomatic foot and ankle injuries demonstrated a “normal” foot morphotype when compared with historic controls, but there was a tendency for more neutral to mild varus alignment of the hindfoot and a slightly increased foot arch. These findings were confirmed by all measurements in our study except 1 (FAA). Any specific relation to knee alignment is yet not known and requires further investigation.
It is our opinion that WB CBCT will soon become gold-standard imaging in the evaluation of foot and ankle injuries, allowing for a more complete understanding of the complexity of the different deformities, with a low dose of radiation when compared with conventional CT. 6,30 The use of WB CBCT might allow surgeons to identify risk factors for specific athletic injuries related to different foot and ankle alignment and morphotypes, aiding in the development of prevention programs in certain groups of people such as elite athletes. In our clinic, athletes are routinely scanned, and a complete biomechanical evaluation of foot positioning and foot morphotype is performed.
Our study has several limitations. The primary limitations of this study are its retrospective design, the small sample size, and the lack of healthy control participants. With that said, we have compared our data with normative data from the most current literature assessing foot alignment. Because of the excellent reliability of these measurements documented in prior studies, we did not perform an assessment of intraobserver or interobserver agreement, which is also a limitation of the current study.
Conclusion
Professional NBA players seem to have a normally aligned foot when compared with historic controls, but our analysis revealed some tendency toward a varus hindfoot and a high-arched morphotype. This alignment may theoretically increase the risk of injuries, especially the ones related to an overload of the lateral column of the foot. In our series, no significant difference was seen when comparing different player positions (centers, guards, and forwards). In male basketball players, structured training programs have already been validated for sports injury prevention. 21 When confirmed through further prospective and controlled investigations, the findings of the current study on foot morphology may represent a starting point to guide future preventive measures for reducing the rate of foot and ankle injuries in professional basketball. Further studies are needed to identify groups of athletes at an increased risk as well as the relationship between different foot morphotypes and specific injuries.
Footnotes
One or more of the authors has declared the following potential conflict of interest or source of funding: C.C.N. is a paid consultant for CurveBeam and Ossio, has stock/stock options in CurveBeam, and has received hospitality payments from Stryker and Zimmer Biomet. F.L. is a paid consultant for CurveBeam and Newclip and has stock/stock options in CurveBeam. A.E. has stock/stock options in Bacterin, has received educational support from Arthrex and Gotham Surgical Solutions & Devices, and has received hospitality payments from Arthrex and Gotham Surgical Solutions & Devices. M.O. has stock/stock options in CurveBeam. AOSSM checks author disclosures against the Open Payments Database (OPD). AOSSM has not conducted an independent investigation on the OPD and disclaims any liability or responsibility relating thereto.
Ethical approval for this study was obtained from the Hospital for Special Surgery’s Foot & Ankle Steering Committee.